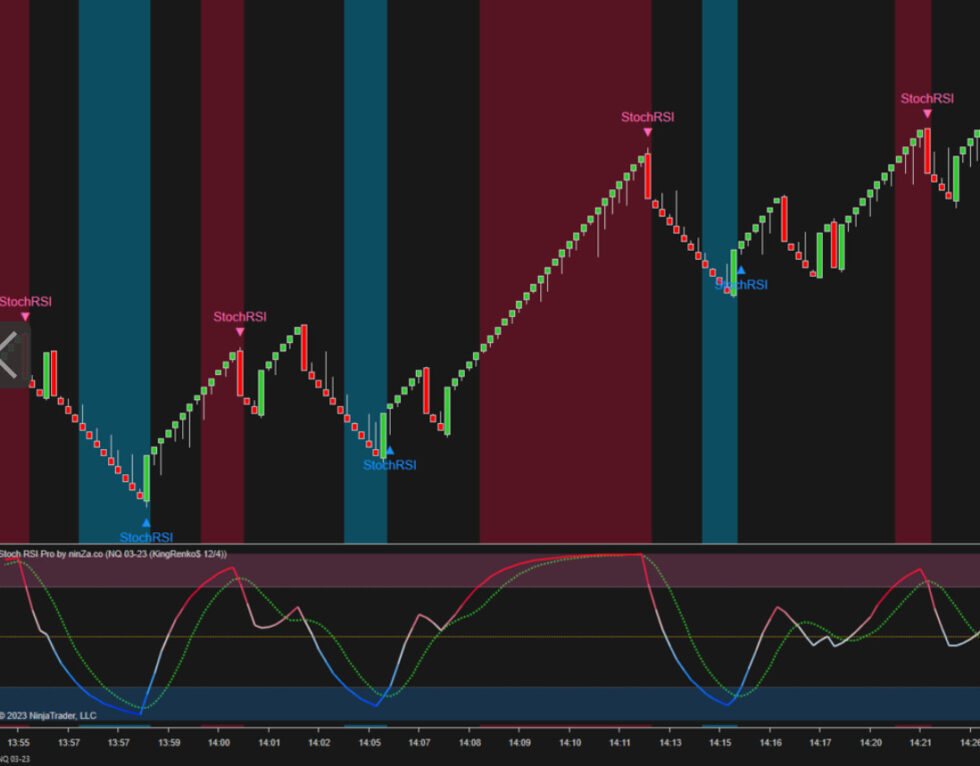
Day trading involves the rapid buying and selling of financial instruments within a single trading day to profit from short-term price movements. Unlike swing traders, day traders require a higher frequency of trading signals. These signals act as timely indicators, aiding day traders in identifying potential entry and exit points for their trades. The fast-paced nature of day trading necessitates quick decision-making, making the availability of multiple signals vital for capitalizing on short-term opportunities effectively.
Let's delve into the ideal day trading signal providers/indicators and what you should be aware of before delving into day trading.
Top Day Trading Signals Providers:
Traders use technical indicators to gain valuable insights into market trend, supply and demand dynamics, and overall securities behaviour. These indicators serve as the foundation of technical analysis. Key metrics like trading volume provide valuable clues about potential price moves. As a result, traders can use these indicators to generate buy and sell signals.
Now we'll check out some of the top indicators for day-trading:
Top day-trading indicators
- On-balance volume (OBV)
- Relative strength index (RSI)
- Stochastic oscillator
- Accumulation/distribution line
- Average directional index
- Aroon oscillator
- Moving average convergence divergence (MACD)
While it's not necessary to use all of these indicators, traders can select a few that they find most useful for making informed trading decisions. Understanding how these indicators work and leveraging their insights can significantly contribute to successful day trading strategies.
1. On-Balance Volume (OBV):
On-Balance Volume (OBV) is one of the most trusted day trading indicators since its discovery in the 1960s. The on-balance volume indicator is a cumulative total of up volume minus down volume. Up volume represents days when the price rallied, while down volume represents days when the price declined. OBV adjusts daily based on whether the price moves higher or lower.
A rising OBV suggests buyers are stepping in, pushing the price up, while a falling OBV indicates selling volume outweighs buying volume, suggesting lower prices. OBV serves as a trend confirmation tool; rising price and OBV indicate a potential continuation of the trend.
Traders using OBV also watch for divergence, where price and OBV move in opposite directions, signalling a potential trend reversal.
2. Relative Strength Index (RSI):

RSI is a versatile indicator with several uses. RSI moves between zero and 100, comparing recent price gains to losses and helping gauge momentum and trend strength.
RSI above 70 suggests overbought conditions and possible price decline, while below 30 indicates oversold conditions and a potential rally.
Divergence occurs when RSI and price move in different directions, signalling a weakening trend. RSI levels can also indicate support and resistance levels during uptrends and downtrends.
3. Stochastic Oscillator:

The stochastic oscillator is a popular technical indicator used in financial markets to measure the relative position of a security's closing price compared to its price range over a specified period. The indicator helps traders identify overbought and oversold conditions and potential trend reversals.
The stochastic oscillator ranges from 0 to 100. Readings above 80 are considered overbought, suggesting that the security may be overvalued, and a price correction or reversal could occur. Conversely, readings below 20 are considered oversold, indicating that the security may be undervalued, and a price rebound or reversal could be imminent.
4. Accumulation/Distribution Line (A/D Line):
The Accumulation/Distribution Line (A/D Line) is a technical indicator used in financial markets to gauge the flow of money into or out of a security over a given period. It provides valuable insights into the buying and selling pressure behind price movements.
The A/D Line takes into account both the trading volume and the price range of a security for the selected time frame. It is particularly useful for assessing the strength of trends and confirming potential reversals. By tracking the A/D Line, traders can identify whether a security is experiencing accumulation (buying interest) or distribution (selling interest) and use this information to make informed trading decisions.
5. Average Directional Index (ADX):
The average directional index (ADX) is a trend indicator used to measure the strength and momentum of a trend.
An ADX above 40 indicates a strong trend, either up or down, depending on the price direction. When the ADX is below 20, the trend is considered weak or non-trending. ADX is the primary line on the indicator, while two additional lines, DI+ and DI-, show the trend direction and momentum. ADX above 20 and DI+ above DI- indicate an uptrend, while ADX above 20 and DI- above DI+ signal a downtrend. ADX below 20 suggests a weak trend or ranging period.
6. Aroon Indicator:
The Aroon oscillator gauges whether a security is in a trend and identifies new highs or lows over a specified period.
This indicator comprises two lines: Aroon Up and Aroon Down. A crossover of Aroon Up above Aroon Down indicates a possible trend change. Aroon Up hitting 100 and staying near that level, while Aroon Down remains near zero, confirms an uptrend. The opposite applies when Aroon Down crosses above Aroon Up and stays near 100, signaling a downtrend.
7. Moving Average Convergence Divergence (MACD):
MACD helps traders identify trend direction and momentum and offers trade signals. A MACD above zero indicates an upward phase, while below zero suggests a bearish period. The indicator consists of the MACD line and a slower signal line. MACD crossing below the signal line indicates a price decline, and vice versa suggests a price rise.
Check out some outstanding Day Trading Signal indicators for NinjaTrader 8


