BigTrade Sweep maps aggressive buying and selling directly onto your chart, helping you spot concentrated participation, continuation, absorption, and potential market traps in real time.
Detect big trades at micro-tick level, track sudden liquidity surges in real time, and read how price responds to distinguish continuation from liquidity traps.
$275R2BOne-time investment
Zaccess extended through October Use coupon “ZACCESS” for up to 10% purchase assistance on this product’s R2B price. Learn more → https://ninza.co/zaccess
Earn $14 back in Zuture Wallet • Online orders only ✓
Need guidance? Contact sales
Perpetual license
Lifetime support
Free updates
30-day exchange
Earn $14 back in Zuture Wallet • Online orders only ✓
Part of a broad trading intelligence ecosystem comprising 300+ research projects and products.
Trusted by
60,000+ traders
worldwide
Reflected in
700+ verified
5-star reviews
Backed by
12 years of
research & innovation
BigTrade Sweep: Visualize aggressive Order Flow & spot market Traps in real time
Most volume indicators show how much volume traded during a bar.
What they don't show is where that volume entered the market, how aggressively it was executed, or how price responded afterward.
When a large volume spike appears on a traditional histogram, traders are often left with more questions than answers:
Where did the activity actually occur?
Were buyers or sellers driving the move?
Was the volume absorbed or accepted?
Did the move generate follow-through or fail?
Was it the beginning of a continuation move or a trap?
Because traditional charts compress all trading activity into a single candle, much of the underlying order flow remains hidden.
BigTrade Sweep helps uncover that missing layer.
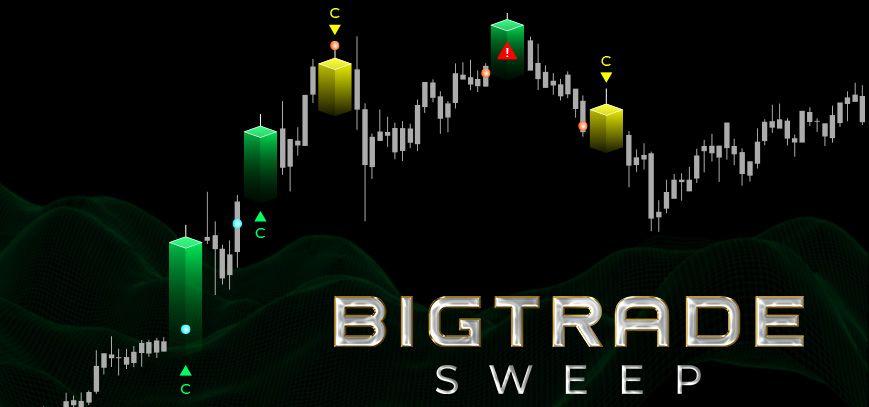
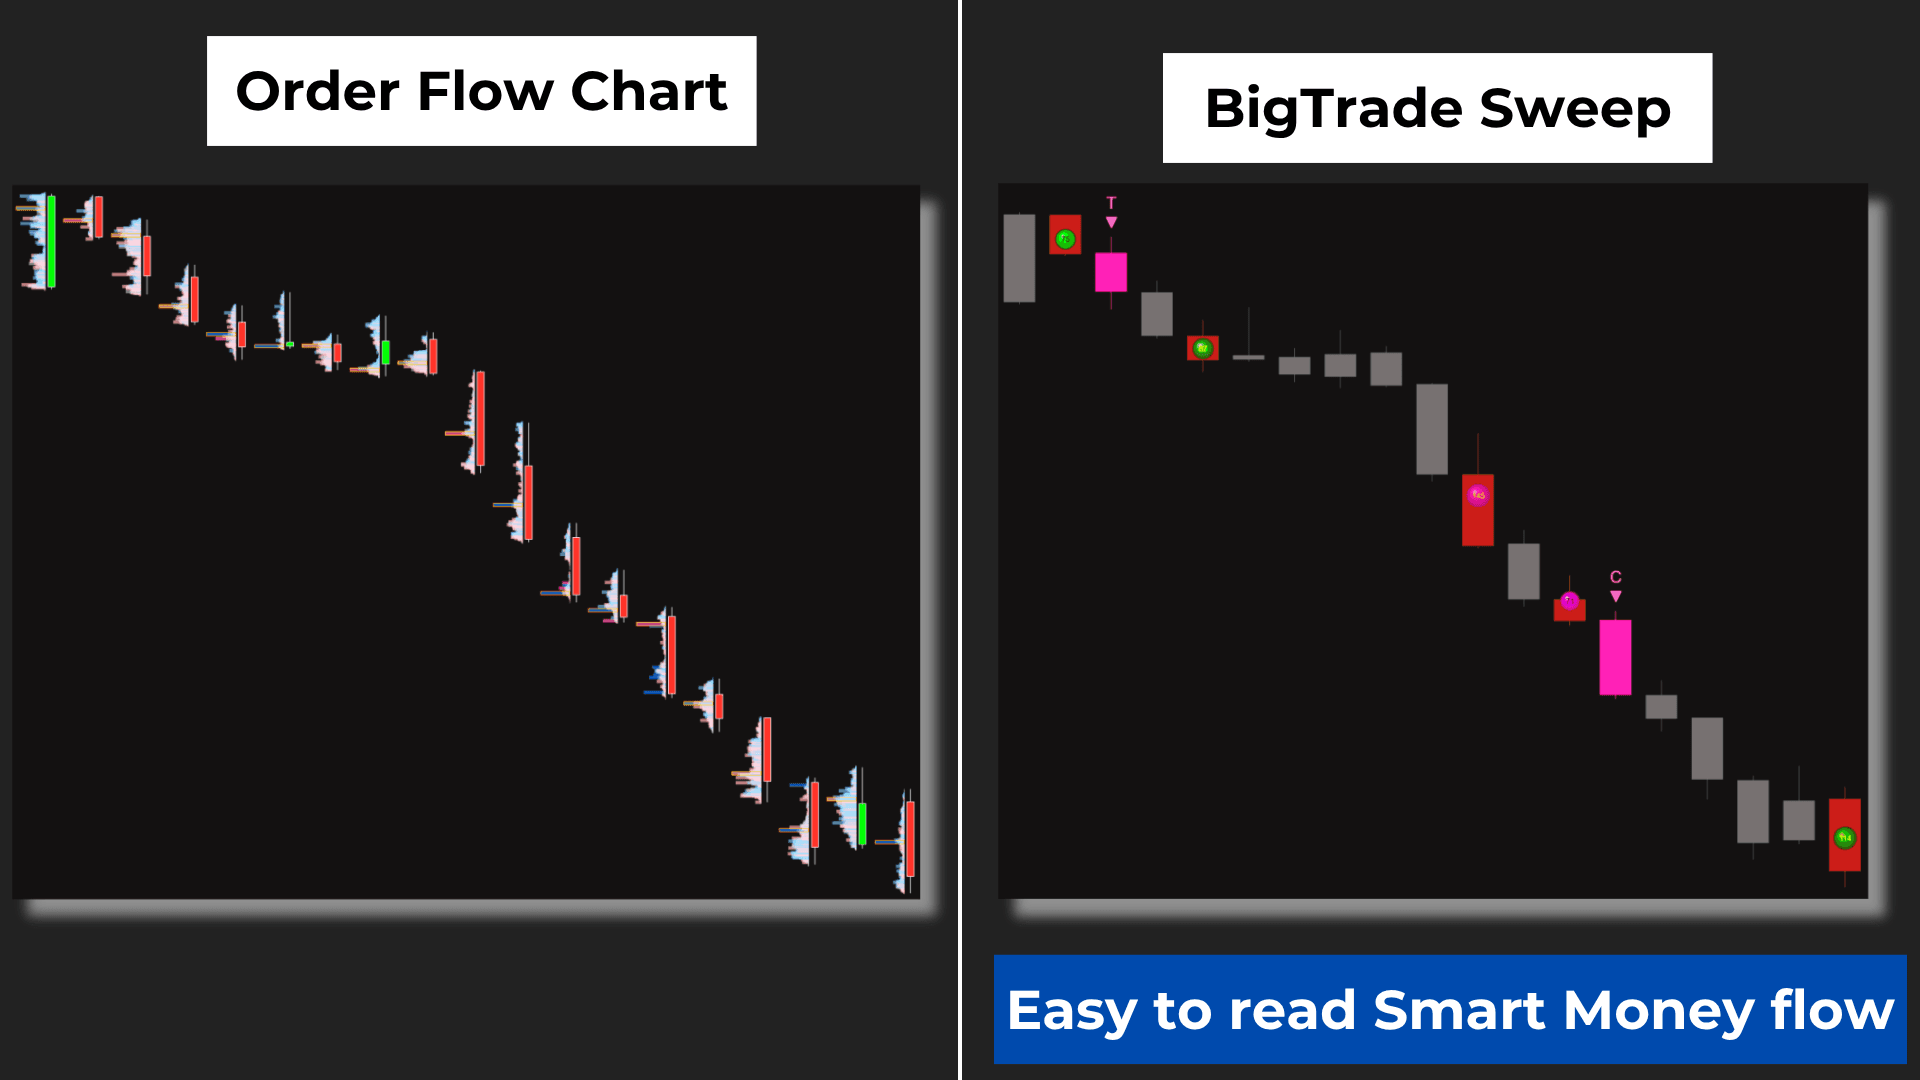
Using tick-by-tick execution data, the indicator identifies unusual bursts of aggressive buying and selling activity and maps them directly onto your chart through Volume Heat Bubbles and rule-based continuation (C) and trap (T) signals.
Rather than forcing you to interpret rapidly changing Footprint charts or raw time-and-sales data, BigTrade Sweep highlights the areas that matter most, making it easier to identify meaningful participation and understand how the market responds afterward.
Built on tick-level Order Flow analysis
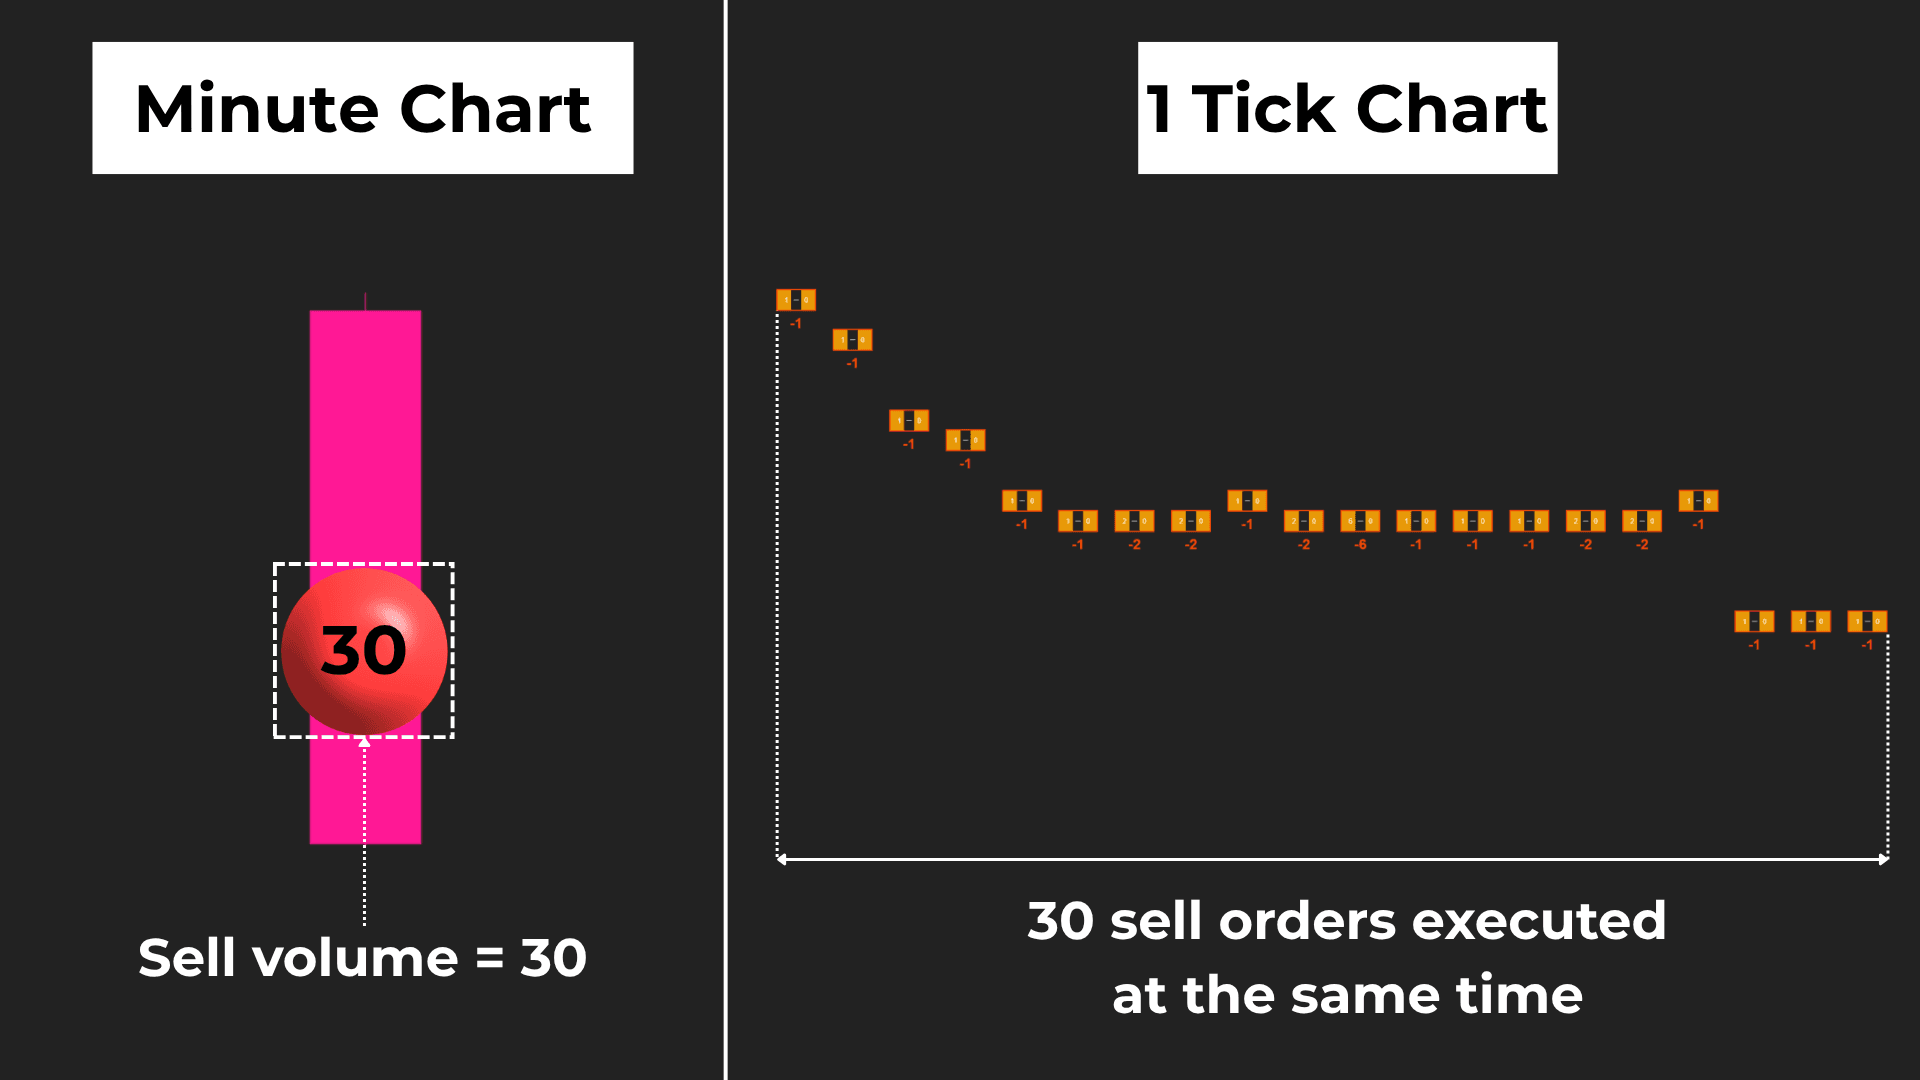
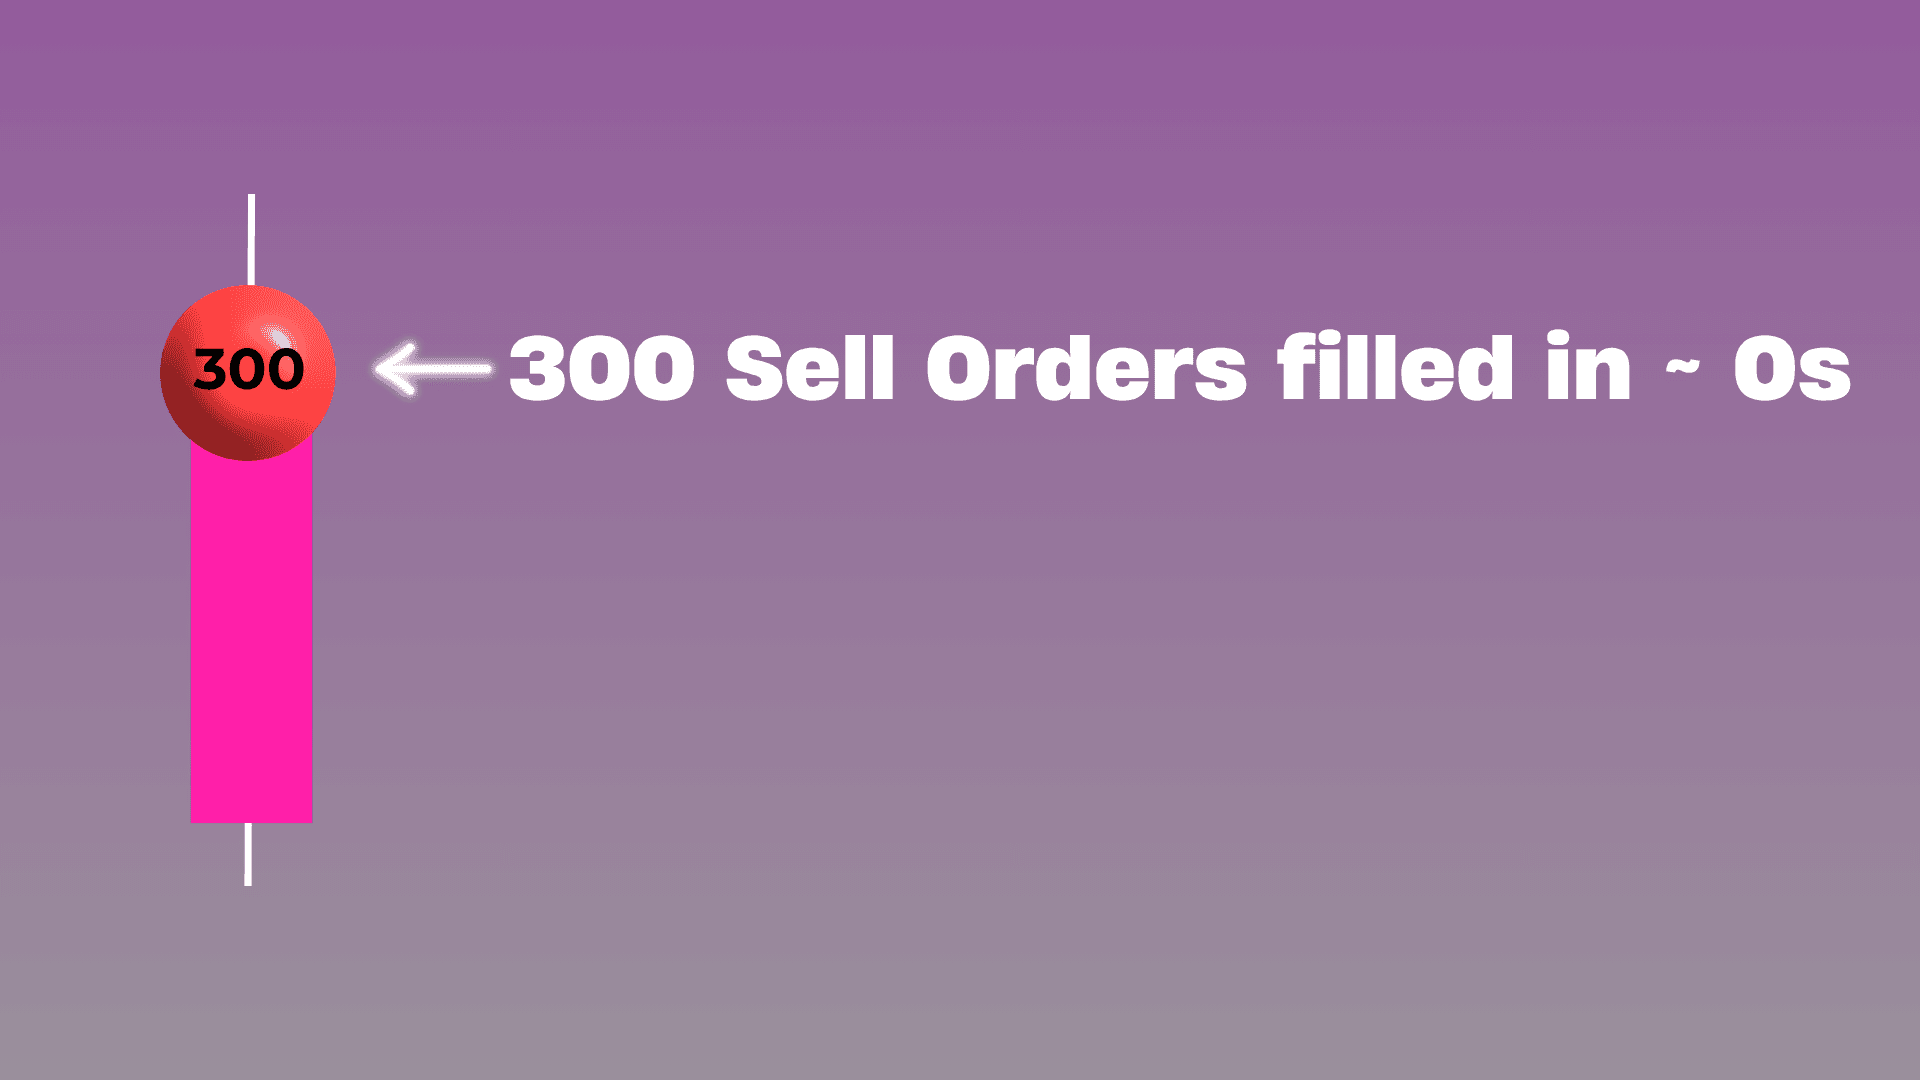
Large market participants rarely reveal their full size through a single trade.
Activity is often distributed across multiple executions, fragmented through algorithms, or hidden within iceberg-style order flow.
Traditional volume studies typically aggregate all of that activity into a single volume total.
BigTrade Sweep analyzes the underlying execution data in real time, monitoring:
Aggressive buying and selling pressure
Execution speed
Order flow imbalances
Concentrated bursts of activity
This helps identify areas where meaningful participation enters the market, even when that activity is distributed across multiple executions rather than appearing as a single block trade.
Volume Heat Bubbles
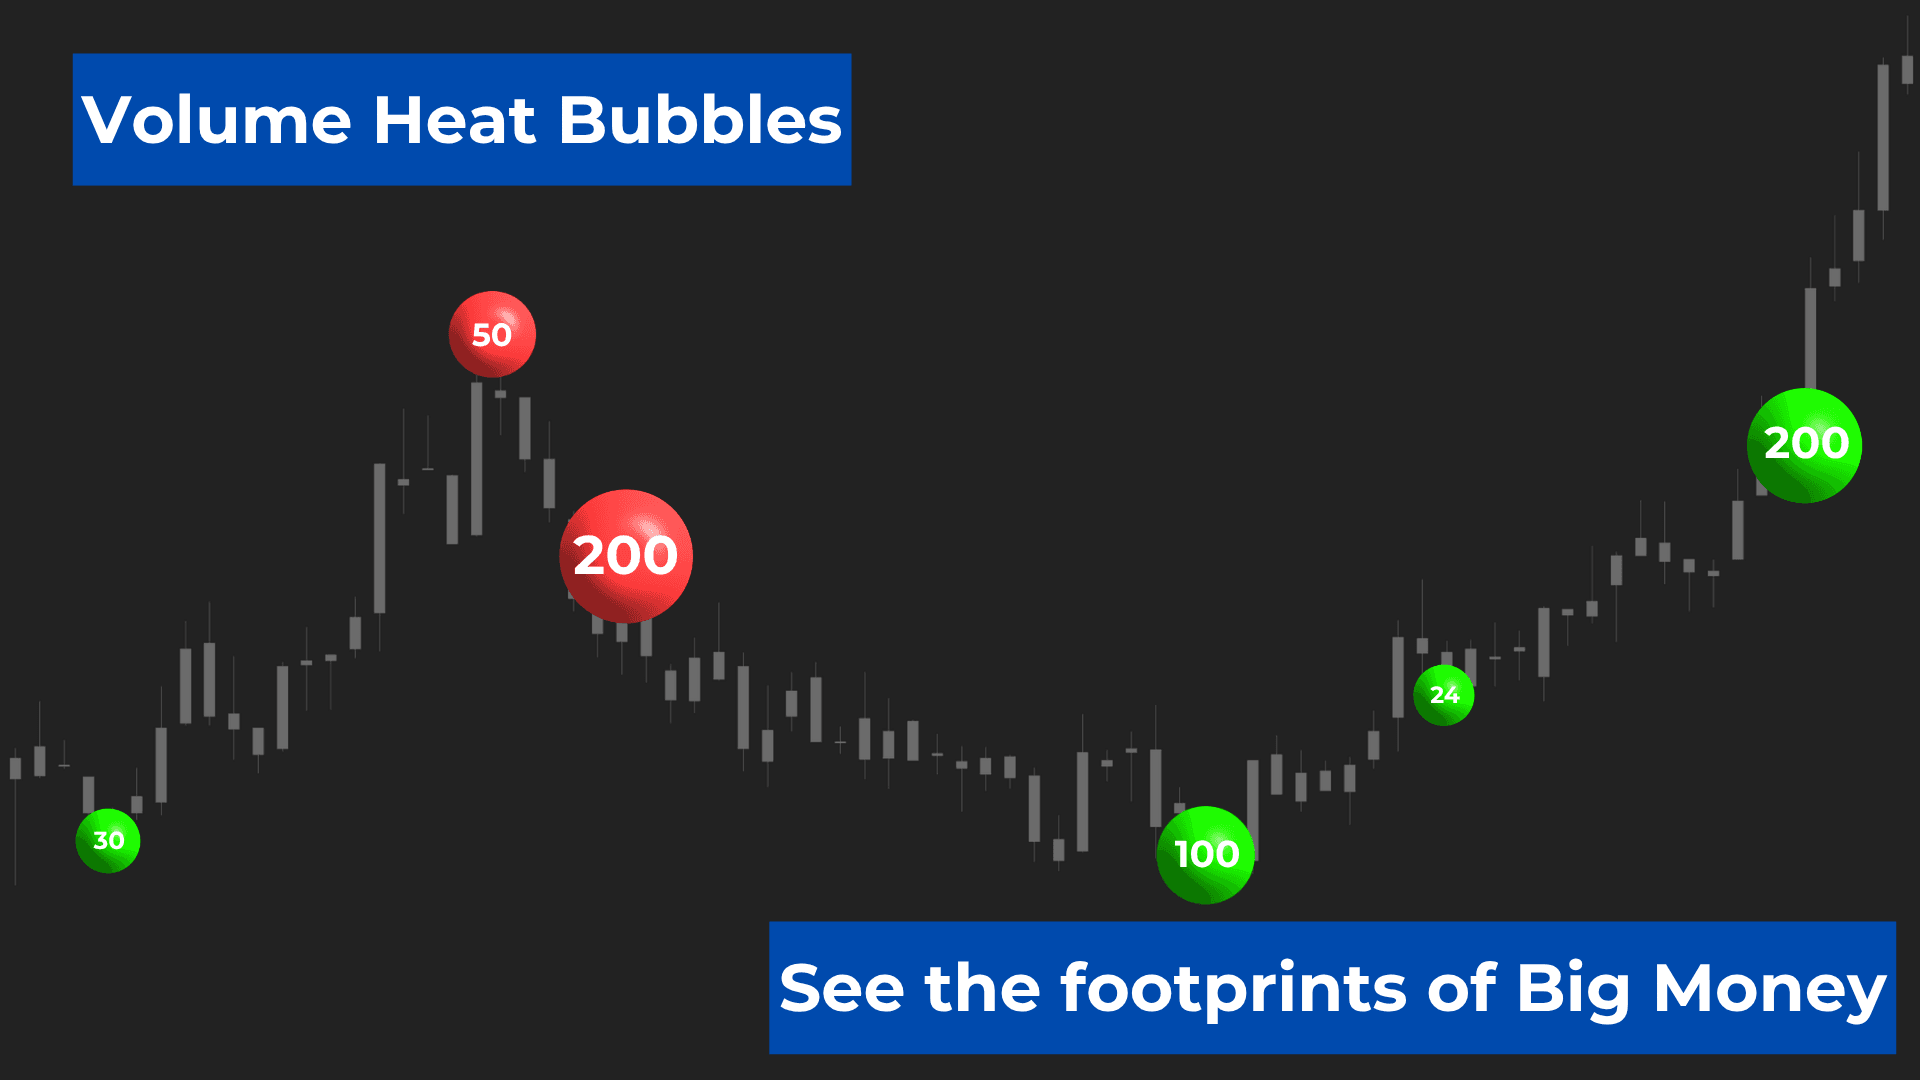
Volume Heat Bubbles are the core visual component of BigTrade Sweep.
Each bubble highlights a price area where unusually large buying or selling activity entered the market within a short period of time.
Instead of requiring you to interpret thousands of changing values within a Footprint chart, BigTrade Sweep displays that information directly on your chart in a clean and intuitive format.
Key features
Green bubbles highlight aggressive buying lifting the offer.
Red bubbles highlight aggressive selling hitting the bid.
Bubble clusters reveal key zones – when multiple bubbles form around the same area, they often identify zones where participation has become highly concentrated.
These areas frequently become important locations for liquidity interactions, market reactions, and potential trading opportunities.
Understanding market response: C & T signals
Large volume alone does not tell the entire story.
What often matters most is how the market responds after that volume enters.
BigTrade Sweep monitors post-volume price behavior and classifies the outcome into 2 distinct signal types.
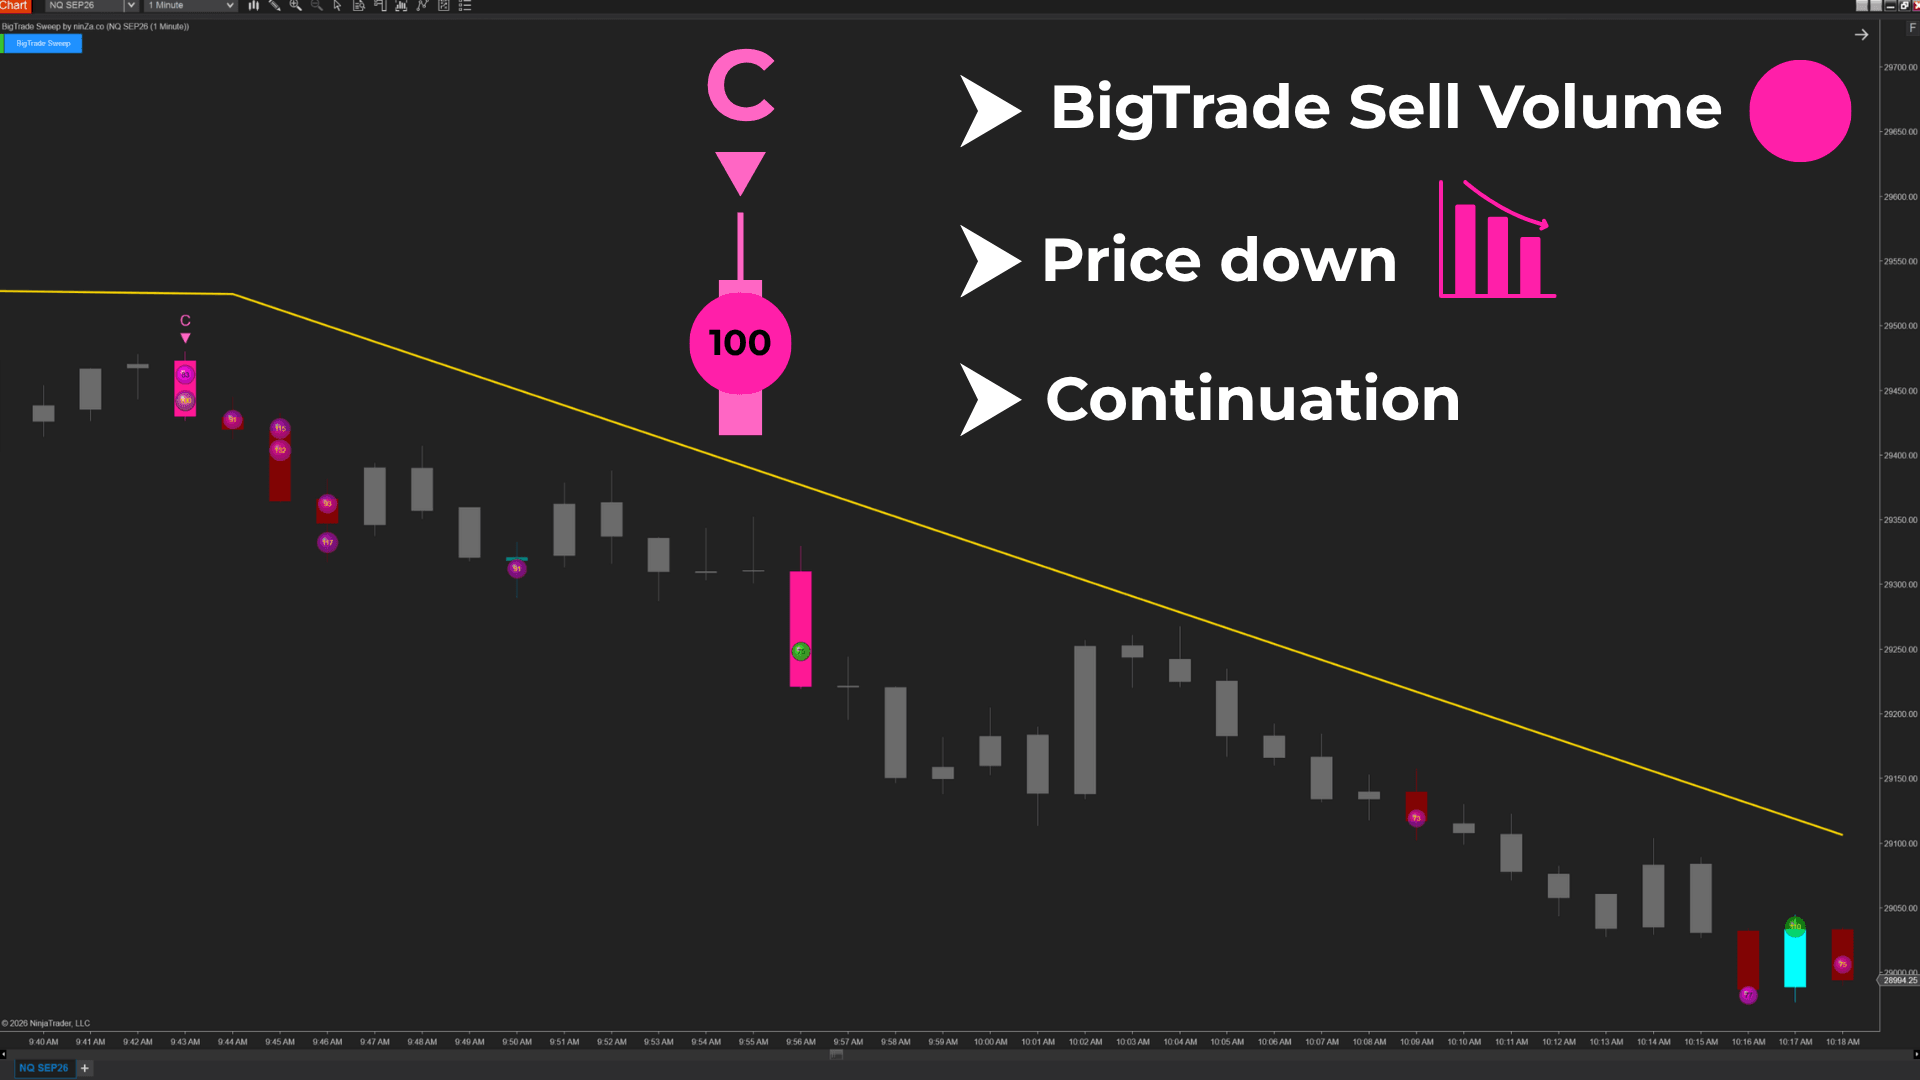
C signal (Continuation)
A C signal appears when aggressive buying or selling enters the market and price continues moving in the same direction.
This suggests the initiating side remains active and directional pressure continues to be accepted by the market.
C signals can help you identify situations where order flow and price movement remain aligned.
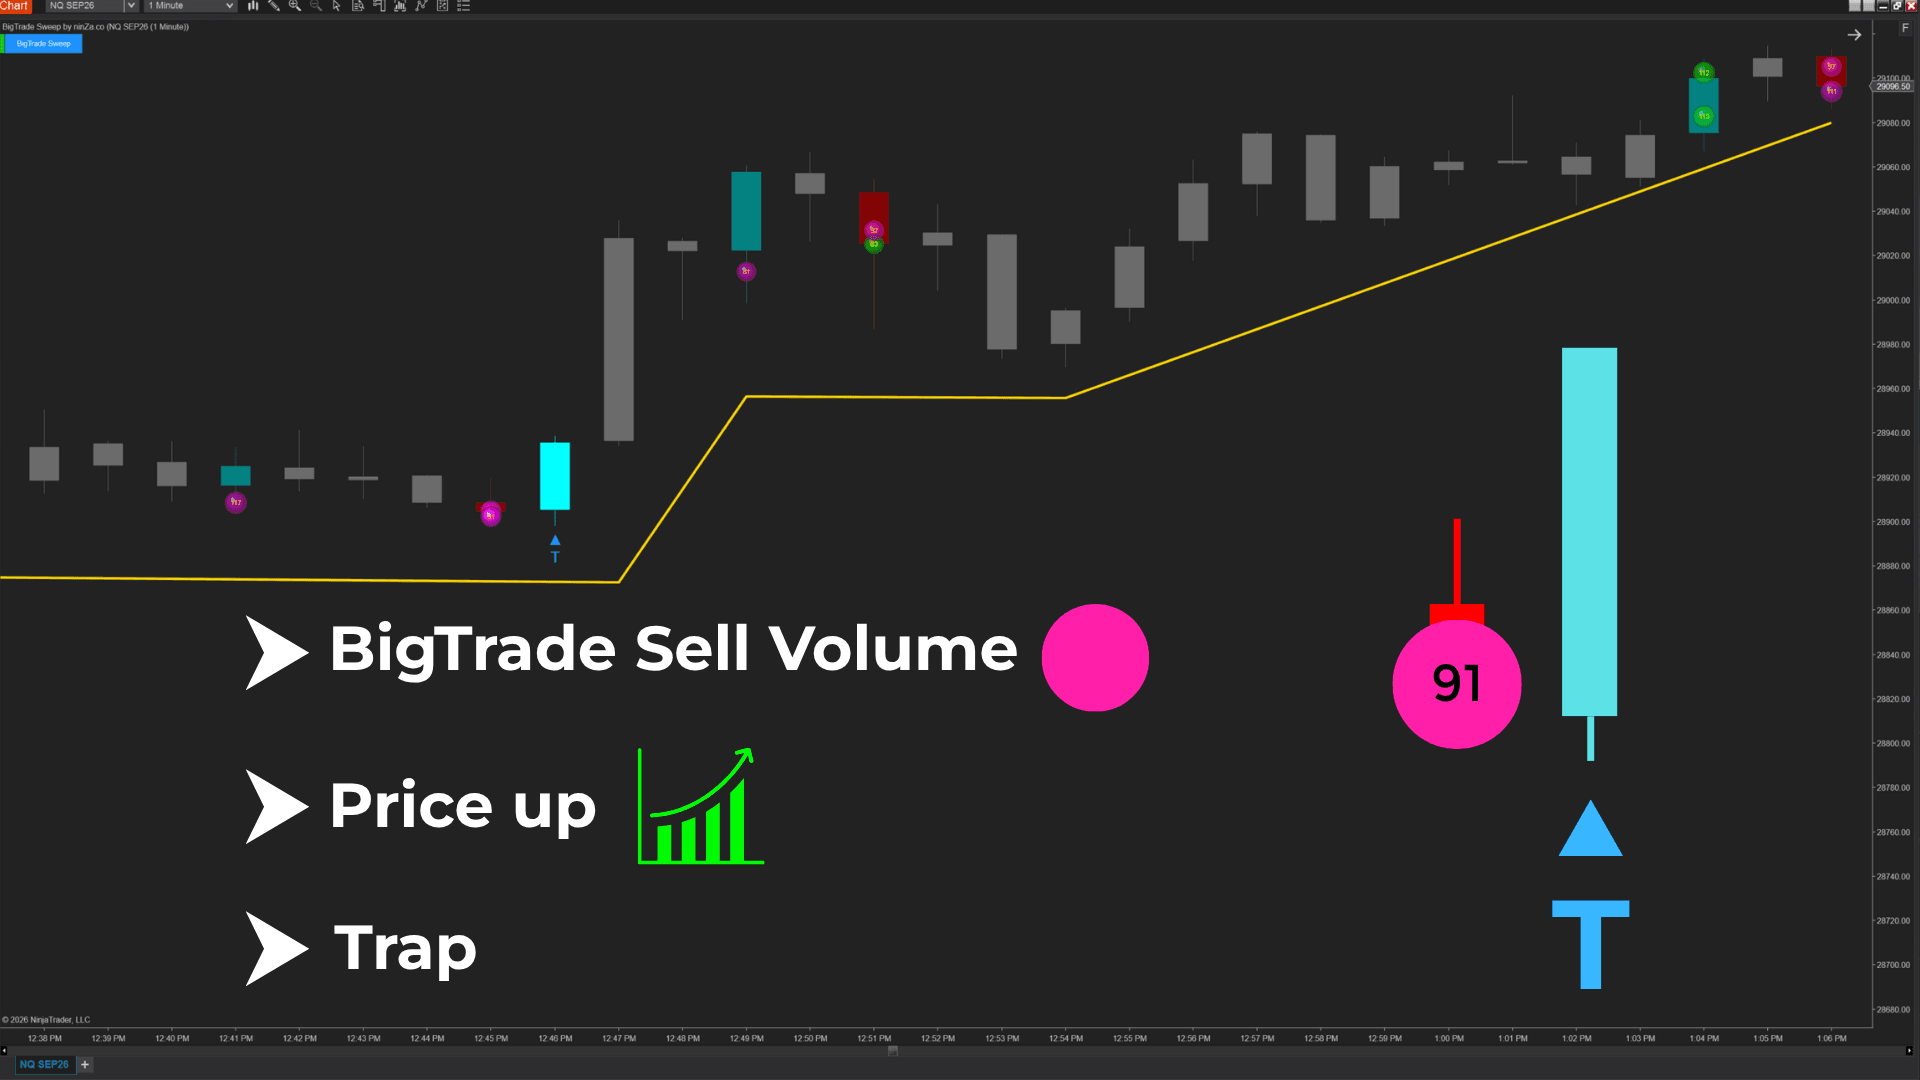
T signal (Trap)
A T signal appears when aggressive volume initially pushes price in one direction but fails to gain acceptance.
Instead, the move is absorbed, rejected, and followed by a reversal.
This often occurs during failed breakouts, exhaustion moves, or liquidity grabs where late participants become trapped on the wrong side of the market.
T signals can help identify potential absorption and trap conditions that may not be immediately apparent from price action alone.
Compatible with multiple chart types
BigTrade Sweep processes raw execution data independently of chart style, making it adaptable to a wide range of trading approaches.
You can use the indicator on:
Minute charts
Tick charts
Renko charts
Range charts
Other commonly used chart formats
Whether your focus is order flow, momentum, market structure, or discretionary price action, BigTrade Sweep can fit into your existing workflow without requiring major changes to your chart setup.
What BigTrade Sweep helps you identify
Areas of unusually high participation
Aggressive buying and selling activity
Volume concentration at specific price levels
Potential continuation following heavy participation
Potential absorption and trap scenarios
Key liquidity zones that may influence future price movement
BigTrade Sweep helps you understand where significant activity entered the market and how price responded afterward, providing additional context for more informed trading decisions.
Watch the indicator in action. Step-by-step guides, live trading, and feature overviews.
Software Changelog
03 Aug 2026:Some graphics functions were improved.
30 Jun 2026:The indicator was released (built new).
16 Jun 2026:A minor issue where some parameters did not have NinjaScript support was fixed.
Policies
Software license
Every purchase includes a perpetual software license, granting you the right to use the software indefinitely on the number of computers permitted by your license.
Installation & Onboarding
Every purchase includes guided installation assistance. Purchases with Premium Services also include white-glove software setup and onboarding, along with personalized trading setup and workflow optimization.
Software updates & upgrades
Software updates & upgrades are provided at no additional cost. For products with a modular structure, this coverage applies to the core product, while optional expansion modules may be offered separately. Read the full policy
Customer service
Every purchase includes lifetime support via email & chat, delivered by our renowned Customer Care team – widely recognized throughout the trading community for its world-class service. As your NINZA product collection expands, Premium Path unlocks a growing range of enhanced Customer Care benefits & privileges, available through dedicated channels. Explore Premium Path
Remote assistance
Every purchase includes up to 3 complimentary remote assistance sessions, available within 30 days of purchase – with each session lasting up to 30 minutes. Purchases with Premium Services include up to 6 sessions within 60 days of purchase, with priority scheduling and longer session durations.
Product exchange
Customers may request up to 3 product exchanges within 30 days of purchase, at little or no additional cost when exchanging for a comparable product. Read the full policy
Returns & refunds
Due to the ease with which software products can be stored and copied, no returns will be accepted and no refunds will be issued. ALL SALES ARE FINAL & NON-REFUNDABLE.
Community Perspectives
From individual traders to pros and institutional trading teams... Trusted worldwide! Read traders' thoughts
4.9
Based on 800+ authentic reviews
M.
Indicators Improved My Charts. Hannah's Help And Great Customer Service. Will Buy Again.
I have been using the ninZa.co indicators for several months now and am very happy with what a valuable addition they have been to my charts. I recently decided to add one of the recently released indicators from ninZa.co. But after using for a few days, it wasn’t quite what I had been looking for. I contacted ninZa.co and had the pleasure of working with Hannah for an exchange to a different one of the many available indicators. At the time, the indicator I wanted to purchase to replace the one I had recently bought was on sale. Hannah put through an exchange and without my having to ask, gave me the advantage of the sale price. She also included a pdf that provided education about the indicator I chose to switch to. Any time I have had contact with one of the associates from ninZa.co, I have received excellent customer service, and will not hesitate to purchase from them again.
Bartosz
Grace Goes Above And Beyond: A Customer Support Experience That Exceeds Expectations!
Thank You, Grace! Your support is extraordinary I wish all companies have such great support. Keep going I’m 200% satisfied.
Kari L.
ConnorsRSI Pro With Grace's Outstanding Customer Service
Thank you very much for your excellent customer service, Grace! You are doing an excellent job making customers' lives much easier.
T.
An Exemplary Customer Experience At NinZa.Co: Unveiling The Power Of Cumulative Delta
I'm a new customer with ninZa.co and i was needing help today in making a purchase. I made a request on your chat platform and Hannah came to my rescue. She helped me find the what I needed and even offered me a discount. Everything went very smoothly from that point. I made the purchase and she even provided me some documentation on the indicator. I am very pleased with her assistance. Thanks again Hannah for your excellent customer service !!
Mike W.
Smart Ruler
I use ninZa.co's Smart Ruler every day !!! It is on all charts and helps me a great deal. Smart Ruler is one great tool for NinjaTrader !!!!!!!
A. B.
The indicator is working perfectly
The indicator is working perfectly. You guys are the best - Purchased Smart Zoom + Supply/Demand Discovery
Sandeep Rao
Awesome Indicator And Pi Rocks
This is my story, I ordered the Day Range indicator for NIFTY India. To my dismay, it didn't work well as it calculated ranges in ticks. I asked Larry Pi if there was a workaround, and he created a new version with all the choices for range unit: points, ticks, pips. He was with me all through the process, with very short turnaround cycles. So don't hesitate at all to pick what you want! You won't regret.
J.
Grateful For Excellent Support From Hannah!
Hi Hannah, Thank you for your great support. You got back to me right away, provided links to solve the problem, and they worked great! All is well that ends well, and your kind and more than adequate support ended very well! Thanks.
David P. From Connecticut
- Purchased Supply/Demand Discovery + TDI Pro + Solar Wind + Intraday Adaptive S/R + Ruby River + Market Profile (Daily) + Day Range
Just got your new Supply/Demand Discovery and it is truly a great improvement over everything else on the market. It will take me days to determine the best values for the variables for my different charts, but it will be worth the effort.
Research Domains
Full spectrum of trading intelligence across diverse domains. Explore all domains
Support & Resistance
Find where price may turn or break
Identify key price areas where buying and selling pressure tend to react. Help traders recognize important levels for potential reversals, trend continuation, or breakouts, and plan trades around these key areas.
Analyze changes in price volatility to assess market conditions. Help traders identify consolidation and expansion phases while evaluating the potential for significant price movements.



_1787026707358.svg)