

Andrew Thomas
Position Sentinel is awesome! Very helpful. Love it.
Position Sentinel is awesome! Very helpful. Love it.


Part of a broad trading intelligence ecosystem comprising 300+ research projects and products.
Trusted by
60,000+ traders
worldwide
Reflected in
700+ verified
5-star reviews
Backed by
12 years of
research & innovation
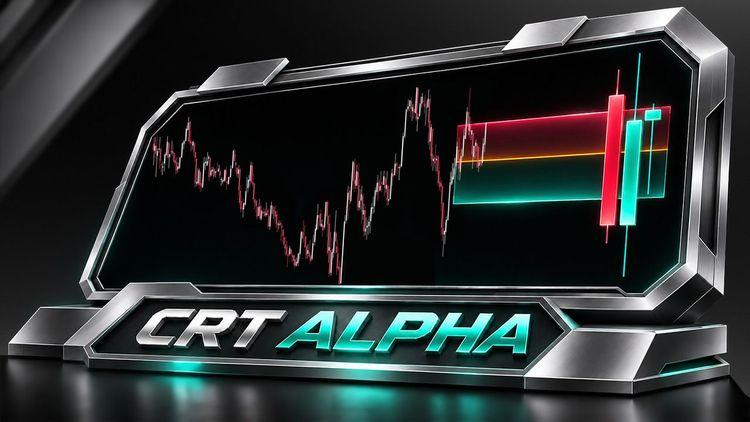
CRT Alpha takes Candle Range Theory beyond basic liquidity sweep detection. The indicator automatically identifies 4 actionable CRT trading setups – Sweep, FVG, Return, and Break – while combining multi-timeframe candle visualization with 10 key SMC/ICT price levels and integrated market analysis tools.
This comprehensive approach brings CRT setups, market structure, and liquidity analysis together in one indicator, giving you broader market context to evaluate potential trading opportunities.
Candle Range Theory (CRT) has gained increasing attention among traders for its practical approach to market analysis. By focusing on clearly defined candle ranges and price behavior around key levels, CRT offers several advantages:
As CRT gains popularity, more traders are exploring its approach to identifying potential trading opportunities. However, basic CRT indicators still require traders to perform much of the analysis manually:
CRT Alpha fills these gaps by automating key parts of CRT analysis and bringing the necessary market context into one place.
CRT Alpha displays higher-timeframe (HTF) candle structure directly on the lower-timeframe (LTF) chart, allowing traders to monitor key price levels and candle behavior without constantly switching between timeframes.
HTF candle visualization
It displays 3 compact HTF candles on the LTF chart, making it easier to track the formation and development of the current Candle Range and its surrounding price action.
Dynamic price levels
It automatically plots key levels from the HTF candles, including Candle Range High (CRH), Candle Range Low (CRL), Open, Close, and the 50% Midline. These levels provide clear reference points for evaluating price movements within and around the Candle Range.
HTF candle qualification
It applies a minimum candle body requirement of 50% of the total candle range. This filter excludes weak-bodied candles, such as Dojis, and focuses CRT analysis on more decisive HTF price movements.
Synchronized candle colors
It synchronizes LTF candle colors within the defined ranges of Setup 1 and Setup 2, making the relevant price action easier to recognize and follow.
CRT Alpha takes CRT analysis beyond basic liquidity sweep setups by automatically identifying 4 distinct trading scenarios: Sweep, FVG, Return, and Break.
These setups capture different ways price interacts with the higher-timeframe Candle Range, giving you more ways to evaluate potential trading opportunities.
Sweep Setup identifies potential reversal opportunities when price moves beyond a higher-timeframe Candle Range boundary but fails to hold outside it.
The setup follows these conditions:
This sequence helps traders distinguish potential liquidity sweeps from breakouts that establish price beyond the original range.
The FVG signal uses Fair Value Gaps (FVGs) to identify potential entry opportunities within the CRT process. CRT Alpha detects FVGs formed during HTF Candle 2 and Candle 3, then monitors how price reacts when it returns to these zones.
A signal is generated when price touches a detected FVG and subsequently closes away from it. This reaction provides an additional entry confirmation based on LTF price behavior.
Return Setup identifies potential reversals when an HTF candle closes outside the original Candle Range but shows a different directional bias from the preceding candle.
The setup requires 2 conditions:
After these conditions are met, CRT Alpha waits for price to retrace to a predefined percentage level before generating the setup signal. This allows you to monitor potential return moves after an initial breakout attempt.
Break Setup focuses on potential continuation opportunities when price breaks beyond the HTF Candle Range in the same direction as the preceding candle.
The setup follows 2 conditions:
The BOS confirmation provides additional evidence of directional continuation before traders consider a potential entry.
CRT Alpha identifies multi-candle Swing Highs & Swing Lows to map significant turning points in price action. It also detects Break of Structure (BOS) and Change of Character (CHoCH), using different line styles to distinguish between the 2 events.
These signals help you follow structural breaks and recognize potential changes in market direction.
CRT Alpha brings together 10 key market levels across three areas of analysis: Order Blocks, Liquidity, and other important price references. These levels give you additional context for identifying potential reaction zones, liquidity targets, and significant areas on the chart.
The indicator automatically detects Order Blocks and assigns each one a score from 0 to 3 based on three criteria:
The indicator also plots the 50% Mean Threshold within each Order Block and identifies mitigated zones. This additional information helps you evaluate the characteristics and current status of each Order Block.
The indicator identifies Equal Highs (EQH) and Equal Lows (EQL), highlighting price areas where liquidity may accumulate. It applies an ATR-based tolerance to determine how close swing points must be to qualify as equal highs or lows.
It also marks untapped liquidity areas, helping you track potential liquidity targets that price has yet to reach.
Beyond Order Blocks and liquidity references, CRT Alpha plots important price levels from previous trading periods, daily activity, and psychological price zones. These include:
Together, these references help you assess where current price action stands relative to previous market extremes, session activity, and important psychological levels.
By bringing CRT setups, multi-timeframe analysis, and SMC/ICT tools together, CRT Alpha gives you a more complete view of market conditions and a broader basis for evaluating trading opportunities:
Watch the indicator in action. Step-by-step guides, live trading, and feature overviews.
Every purchase includes a perpetual software license, granting you the right to use the software indefinitely on the number of computers permitted by your license.
Every purchase includes guided installation assistance.
Purchases with Premium Services also include white-glove software setup and onboarding, along with personalized trading setup and workflow optimization.
Software updates & upgrades are provided at no additional cost.
For products with a modular structure, this coverage applies to the core product, while optional expansion modules may be offered separately.
Read the full policy
Every purchase includes lifetime support via email & chat, delivered by our renowned Customer Care team – widely recognized throughout the trading community for its world-class service.
As your NINZA product collection expands, Premium Path unlocks a growing range of enhanced Customer Care benefits & privileges, available through dedicated channels.
Explore Premium Path
Every purchase includes up to 3 complimentary remote assistance sessions, available within 30 days of purchase – with each session lasting up to 30 minutes.
Purchases with Premium Services include up to 6 sessions within 60 days of purchase, with priority scheduling and longer session durations.
Customers may request up to 3 product exchanges within 30 days of purchase, at little or no additional cost when exchanging for a comparable product.
Read the full policy
Due to the ease with which software products can be stored and copied, no returns will be accepted and no refunds will be issued.
ALL SALES ARE FINAL & NON-REFUNDABLE.
From individual traders to pros and institutional trading teams...
Trusted worldwide! Read traders' thoughts
Based on 800+ authentic reviews
Andrew Thomas
Al Sisemore
Christopher Heathman
Samuel Grossman
Abhijit Banerjee
Ben
Steffie
Lance S.
Jim
Analyze smart money activity and liquidity to identify concentrated liquidity and areas vulnerable to liquidity sweeps. Recognize price movements that may reflect institutional activity.

Analyze buying and selling pressure to identify where supply or demand dominates. Assess potential price reactions and help traders identify higher-probability trading opportunities.

_1787026707358.svg)
NINZA is an official member of NinjaTrader Ecosystem together with 600+ industry-leading professionals that provide traders with quality trading products & services.




even more payment methods
Quick Links
Instructions
Support
Resources & Information
© Copyright 2026 All Rights Reserved



Because software products may be copied and stored easily, we will NOT issue refunds of any kind. ALL SALES ARE FINAL & NON-REFUNDABLE!
Futures, foreign currency, and options trading contains substantial risk and is not for every investor. An investor could potentially lose all or more than the initial investment. Risk capital is money that can be lost without jeopardizing one's financial security or lifestyle. Only risk capital should be used for trading and only those with sufficient risk capital should consider trading. Past performance is not necessarily indicative of future results.
Hypothetical performance results have many inherent limitations, some of which are described below. No representation is being made that any account will or is likely to achieve profits or losses similar to those shown; in fact, there are frequently sharp differences between hypothetical performance results and the actual results subsequently achieved by any particular trading program. One of the limitations of hypothetical performance results is that they are generally prepared with the benefit of hindsight. In addition, hypothetical trading does not involve financial risk, and no hypothetical trading record can completely account for the impact of financial risk of actual trading. For example, the ability to withstand losses or to adhere to a particular trading program in spite of trading losses are material points which can also adversely affect actual trading results. There are numerous other factors related to the markets in general or to the implementation of any specific trading program which cannot be fully accounted for in the preparation of hypothetical performance results and all which can adversely affect trading results.
NinjaTrader® is a registered trademark of NinjaTrader Group, LLC. No NinjaTrader company has any affiliation with the owner, developer, or provider of the products or services described herein, or any interest, ownership or otherwise, in any such product or service, or endorses, recommends or approves any such product or service.