01. Beyond range visualization
Visualize HTF candle structures directly on your LTF chart. CRT Alpha automatically tracks CRH and CRL, displays key price references, and synchronizes candle colors to make HTF context easier to follow.

Automatically identify 4 actionable CRT trading scenarios beyond liquidity sweeps and enhance your market analysis through a comprehensive suite of integrated SMC/ICT tools - all in a single indicator.
Candle Range Theory (CRT) has rapidly gained attention among traders today because it addresses some of the biggest pain points traders face in live markets:
Cutting through SMC/ICT chart clutter
With so many Order Blocks, Supply/Demand zones, and Fair Value Gaps on the chart, SMC/ICT traders can struggle to distinguish reliable trading areas from weaker ones. CRT provides a clearer, more consistent way to read price action.
Capitalizing on price's tendency to target candle Highs and Lows
Previous candle Highs and Lows are key liquidity levels where Stop Loss and Buy/Sell Stop orders tend to accumulate. CRT turns price's tendency to target these levels into a clear, visual framework for trading.
Bringing objectivity to market structure
Instead of relying on manually drawn trendlines and subjective support/resistance zones, CRT uses precise Higher Timeframe candle Highs and Lows as objective reference points.
Identifying Liquidity Hunts
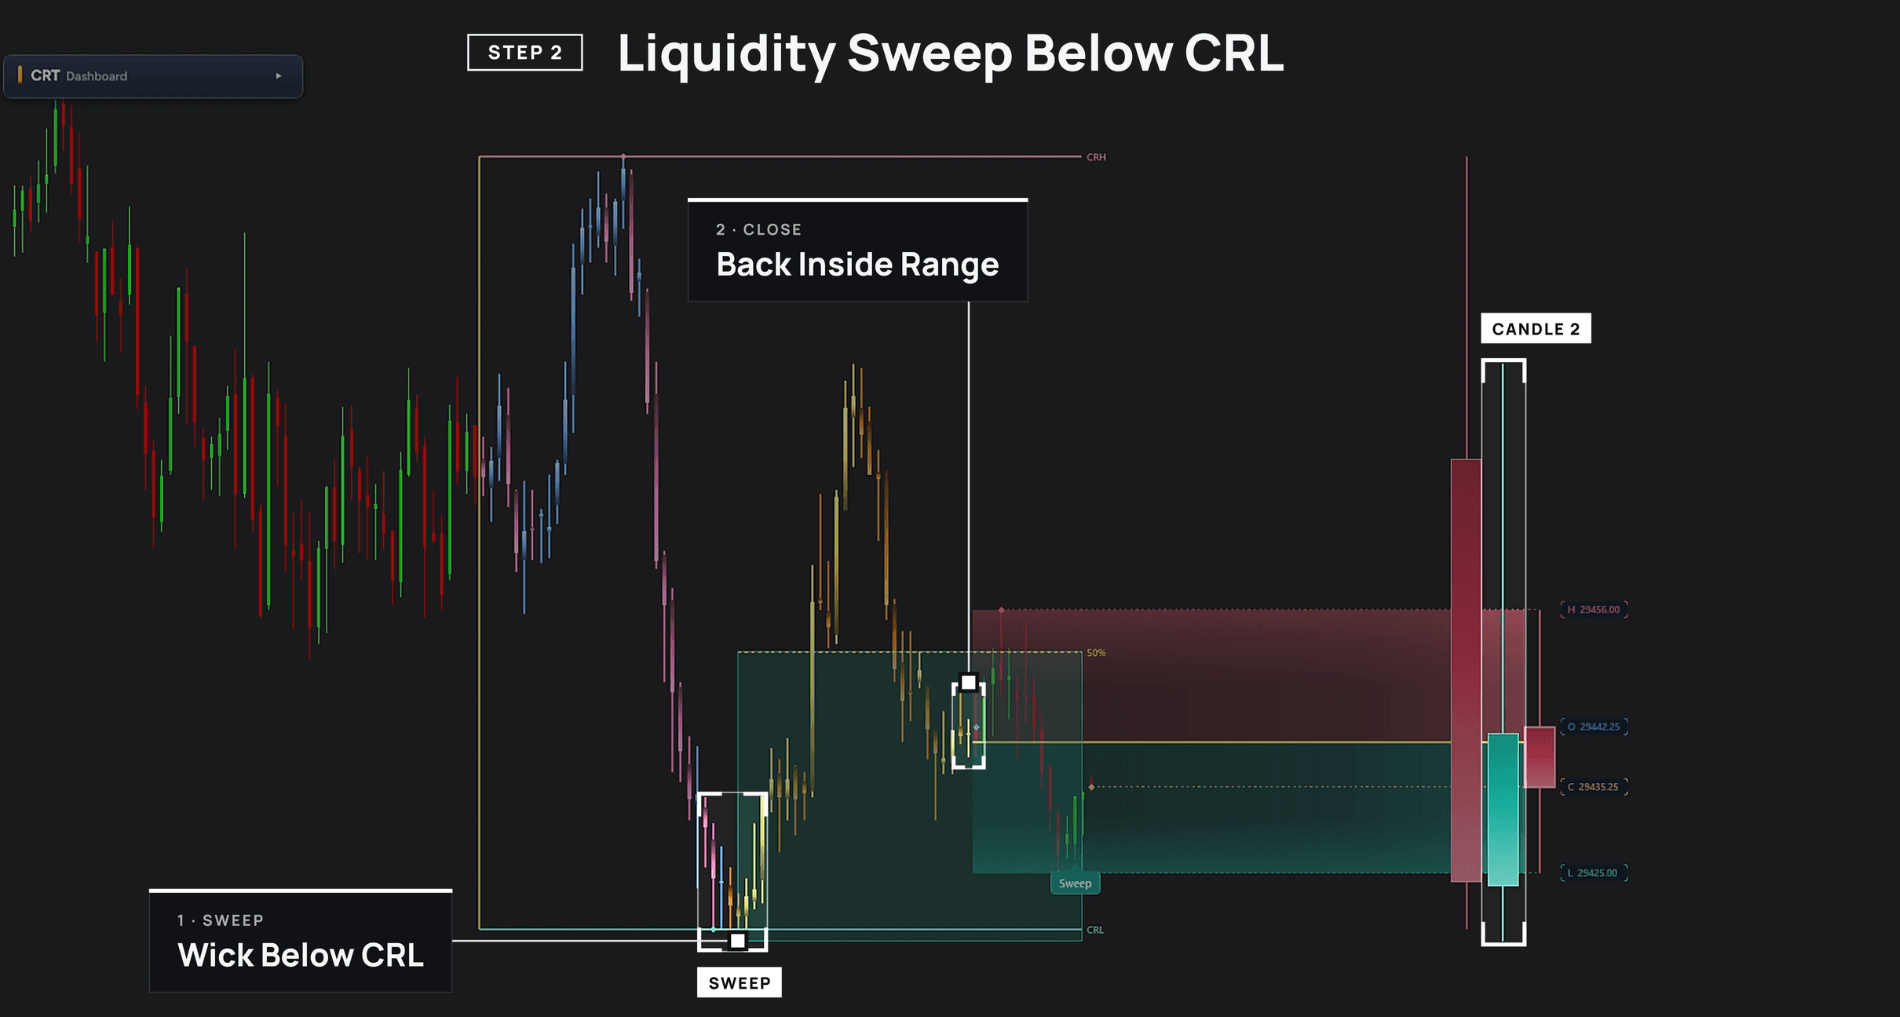
When price sweeps a previous candle's High or Low and closes back inside the range, it can signal a liquidity hunt. CRT helps traders recognize this shift and identify potential entries with favorable R:R.
Understanding CRT doesn't necessarily mean you can apply it consistently.
In live markets, you still need to identify reference candles, track CRH and CRL, distinguish Sweeps from Breakouts, look for LTF confirmation, and combine SMC/ICT concepts to evaluate potential setups.
CRT Alpha bridges this gap.
More than a basic CRT indicator, CRT Alpha combines automated setup detection, multi-timeframe visualization, and integrated SMC/ICT tools in one comprehensive solution.
CRT Alpha is more than a basic CRT indicator
Visualize HTF candle structures directly on your LTF chart. CRT Alpha automatically tracks CRH and CRL, displays key price references, and synchronizes candle colors to make HTF context easier to follow.
Go beyond identifying liquidity sweeps. CRT Alpha automatically detects 4 CRT-based trade setups, each with its own conditions and confirmation logic, covering different potential market scenarios.
Combine CRT analysis with integrated SMC/ICT tools to examine Market Structure, Order Blocks, Liquidity, and Key Levels - bringing multiple layers of market information together in one indicator.
With multi-timeframe market visualization, automated CRT setup detection, and integrated SMC/ICT tools, you can gain a clearer view of market structure, evaluate trading opportunities, and make more informed decisions.
01
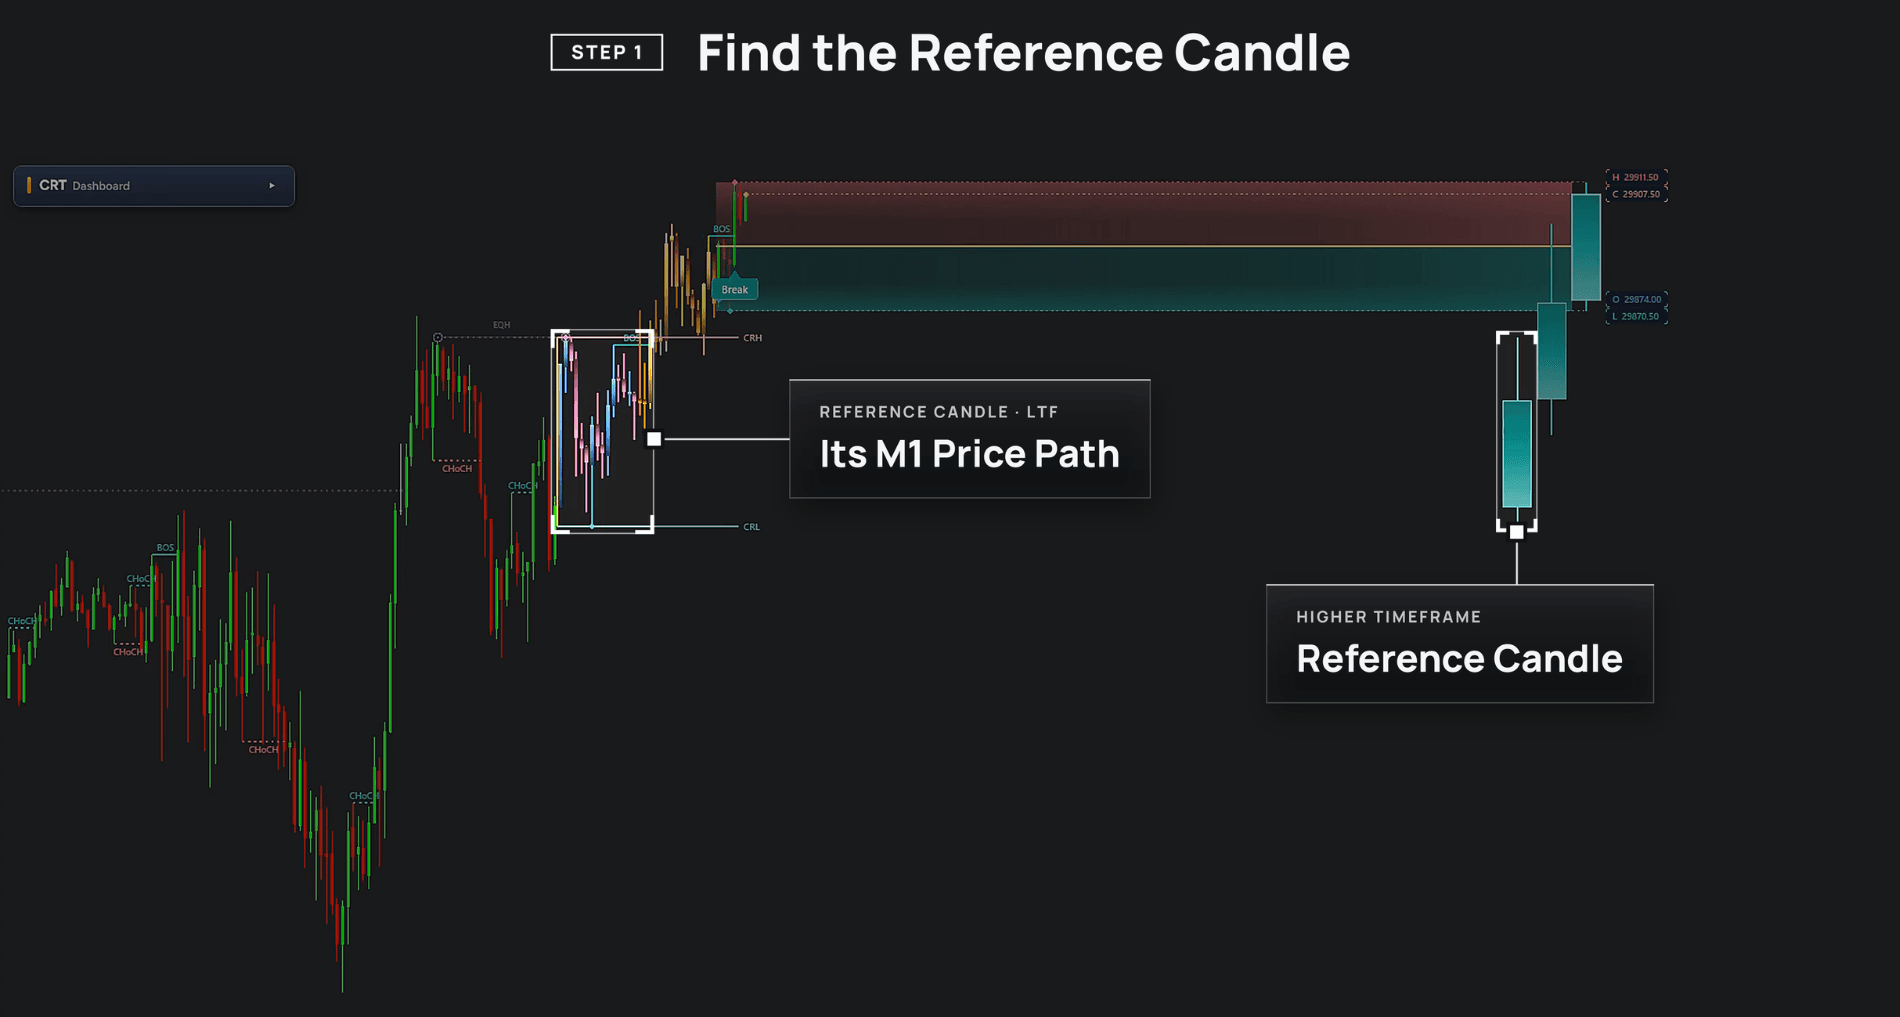
When you need to read HTF candle behavior without manually tracking every range.
Identify qualified CRT candles
Apply a minimum HTF candle body requirement of 50% of its total range to identify candles with stronger directional structure, filtering out Doji and weak-bodied candles.
Read HTF structure directly on your LTF chart
View 3 compact HTF candles alongside dynamic CRH, CRL, Open, Close, and Midline (50%) levels, keeping key HTF reference points visible without switching timeframes.
Recognize setup candle structures at a glance
Automatically synchronize LTF candle colors within Setup 1 and Setup 2 ranges, making each setup's candle structure easier to distinguish directly on your chart.
02
When you need a systematic way to identify and evaluate different CRT trading scenarios beyond basic liquidity sweeps.
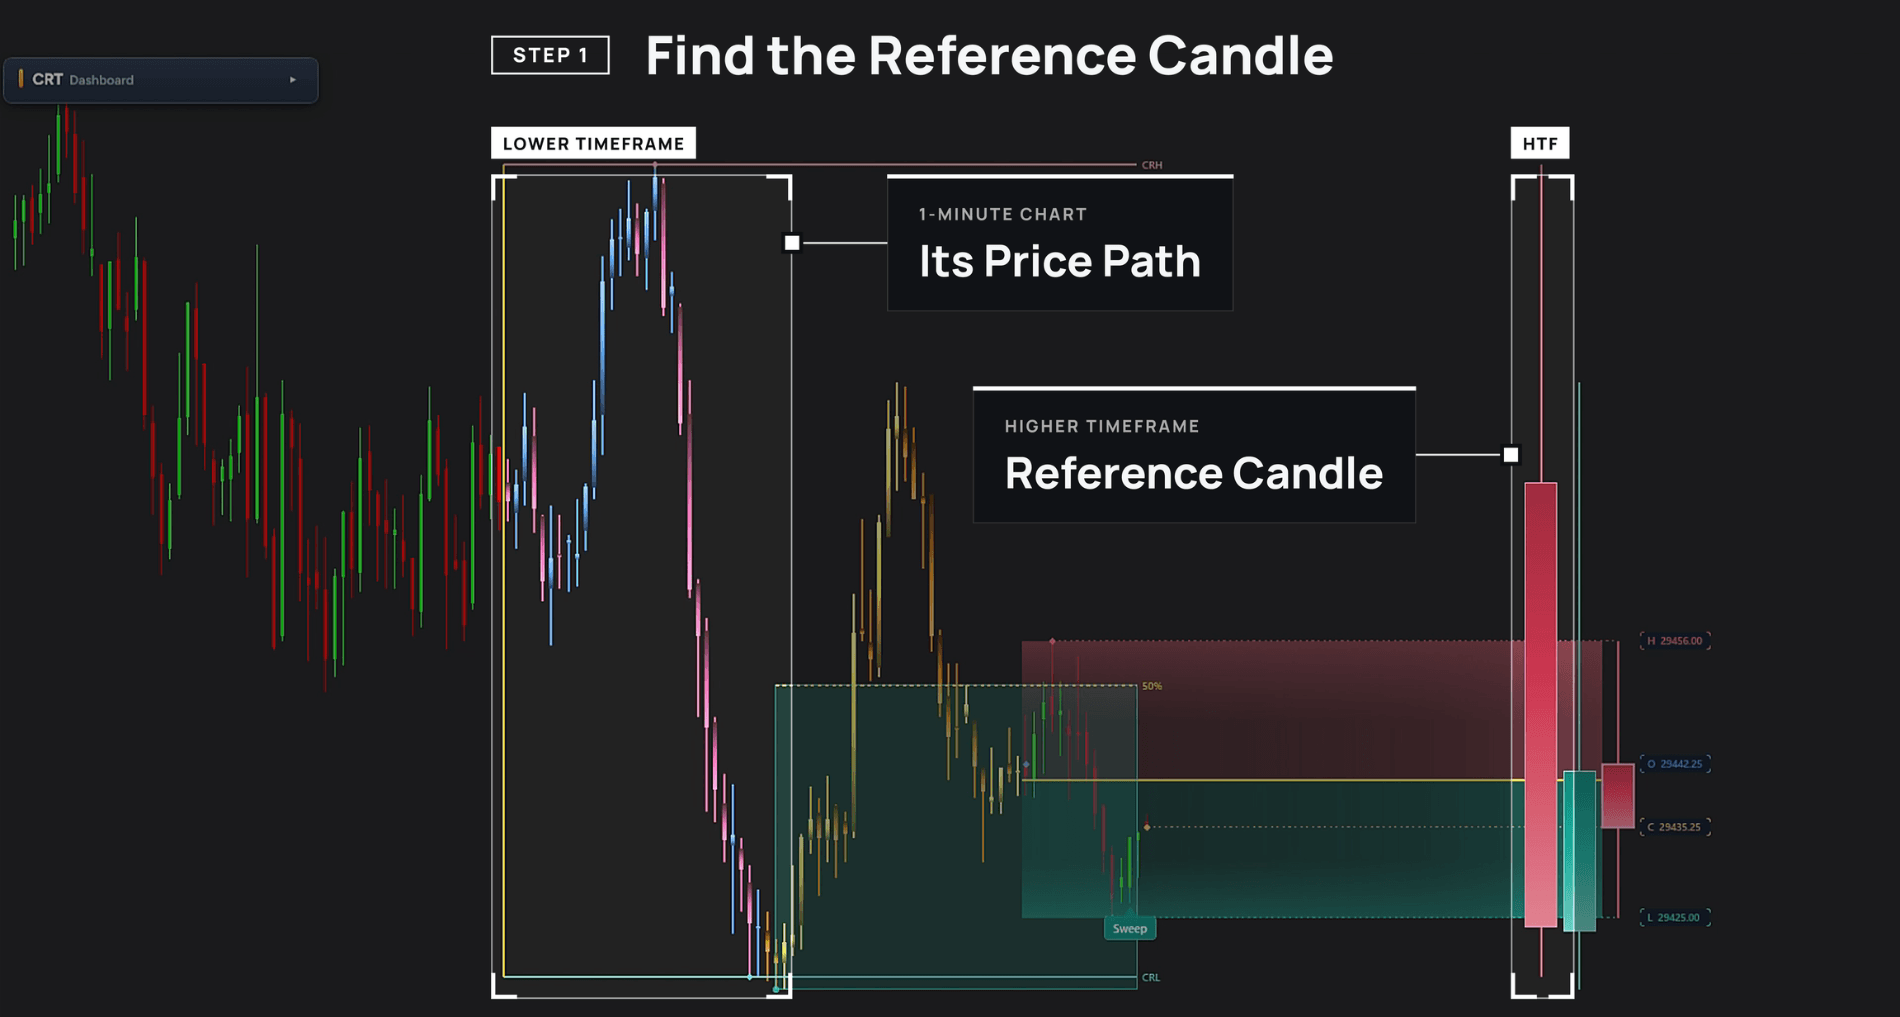
Sweep setup - Potential reversal
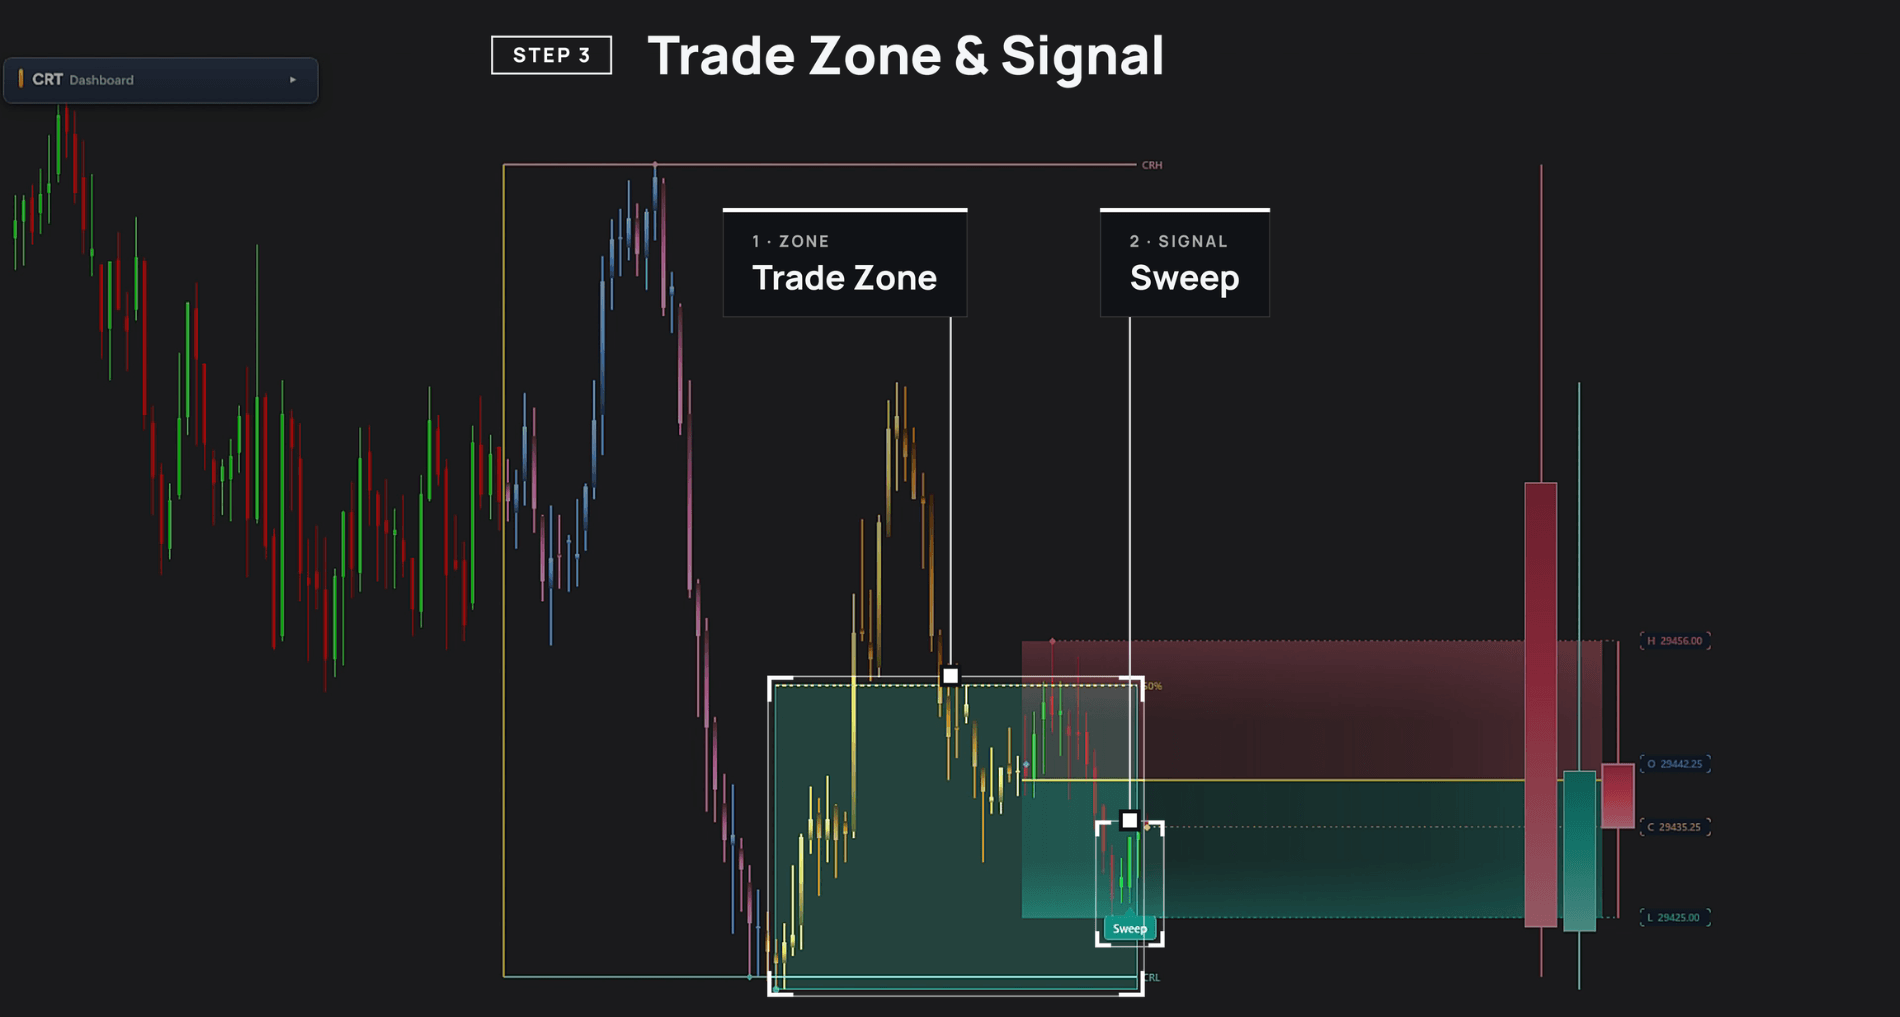
Detect when Candle 2 sweeps beyond CRH or CRL but closes back inside the range. The setup is confirmed when LTF price tests the Premium or Discount zone.
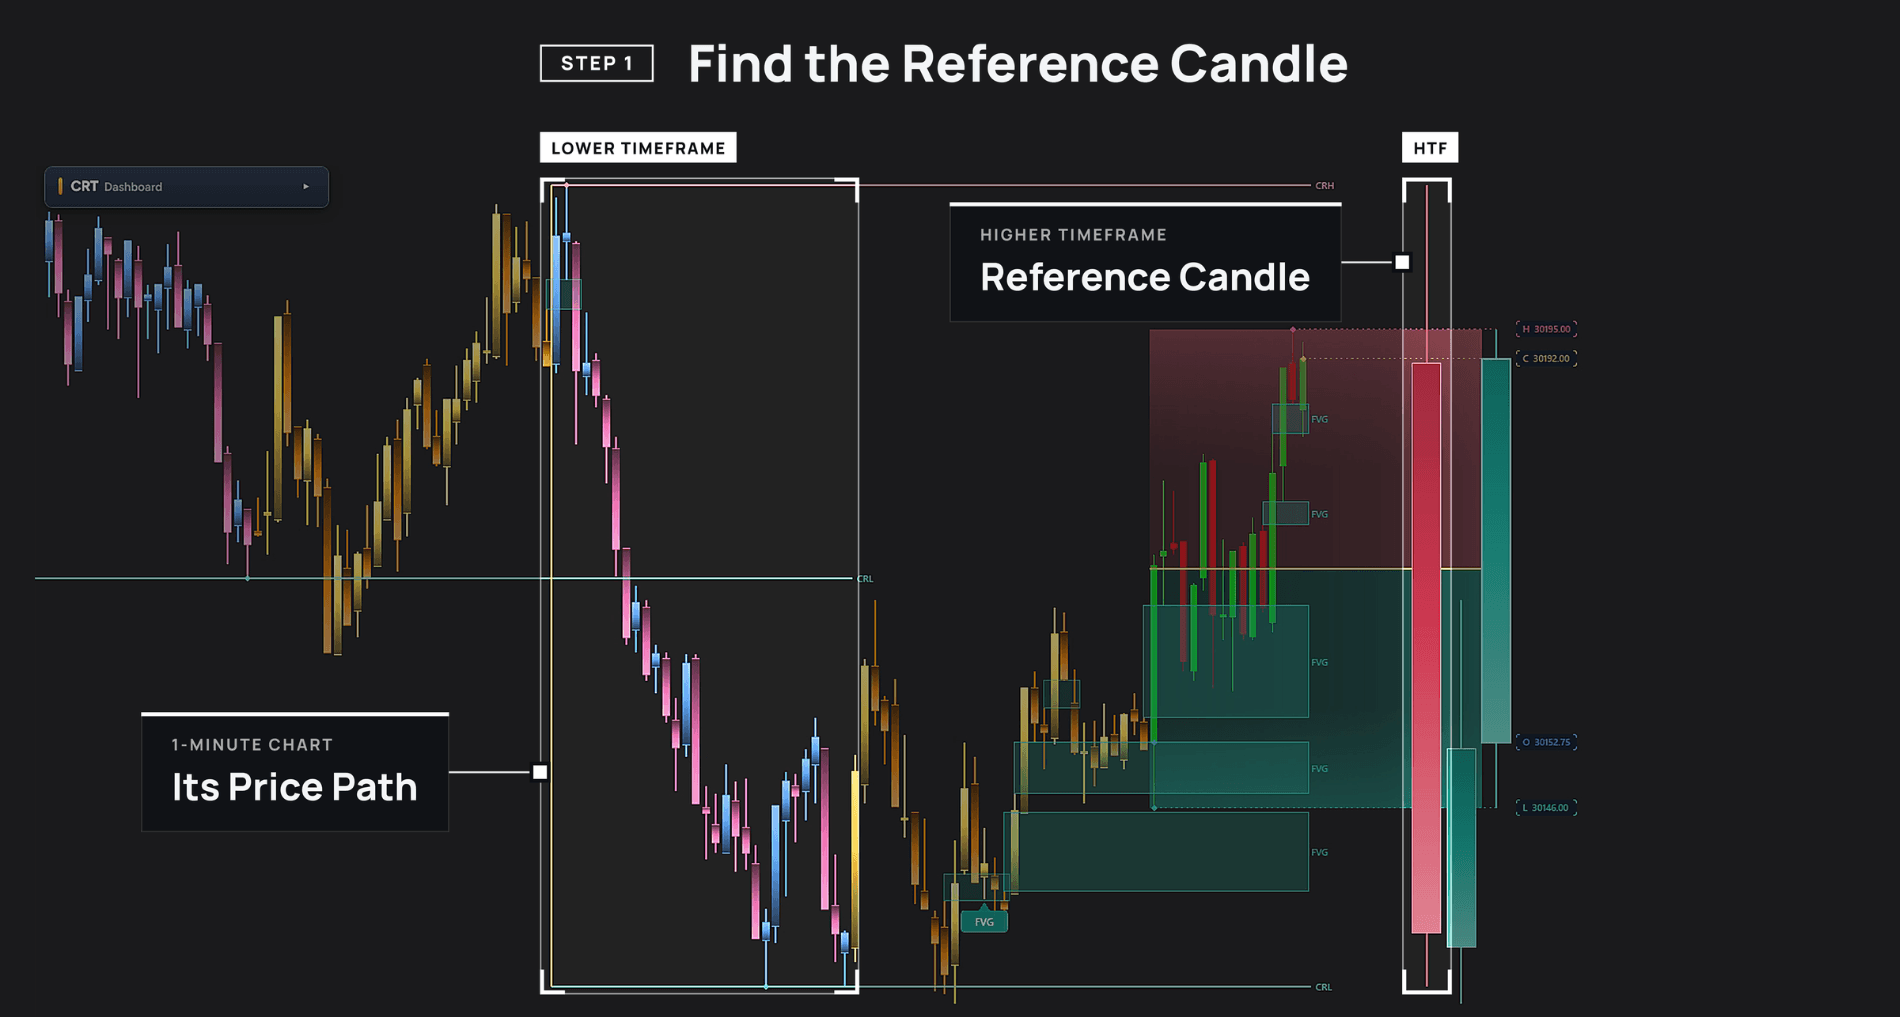
FVG signal - FVG-based entry confirmation
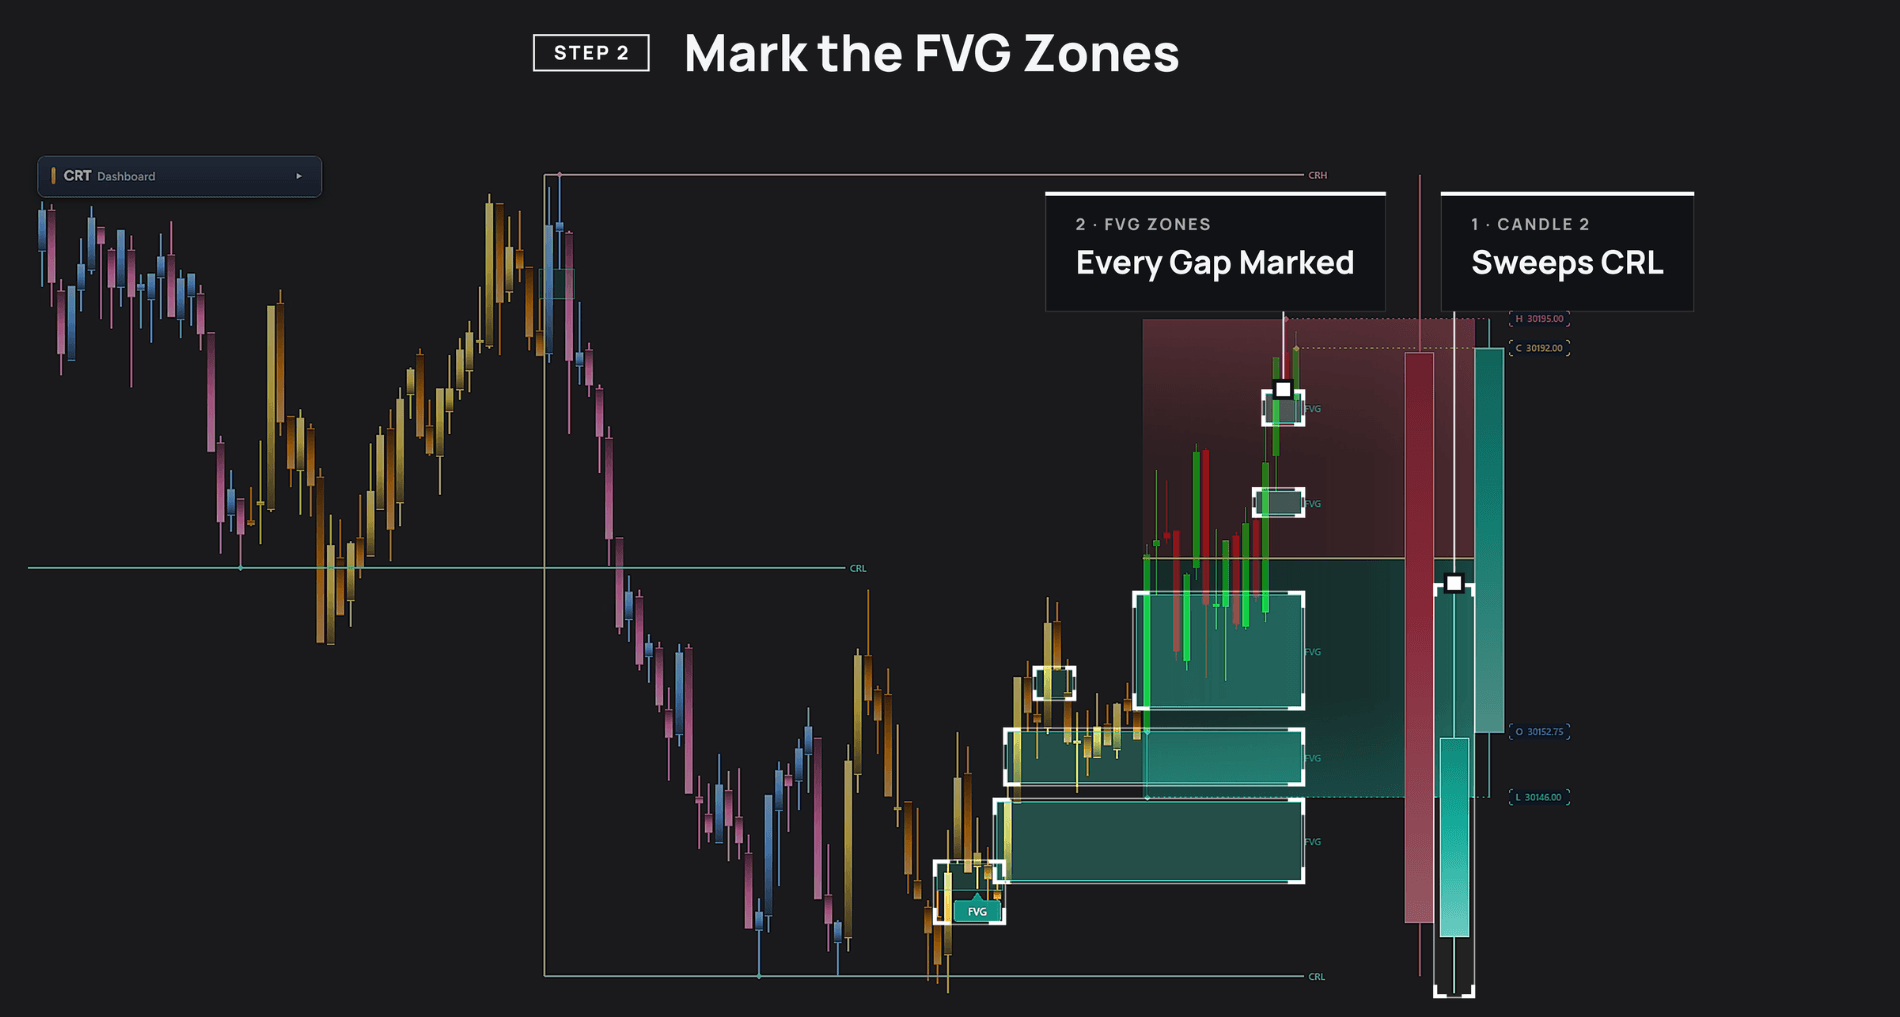
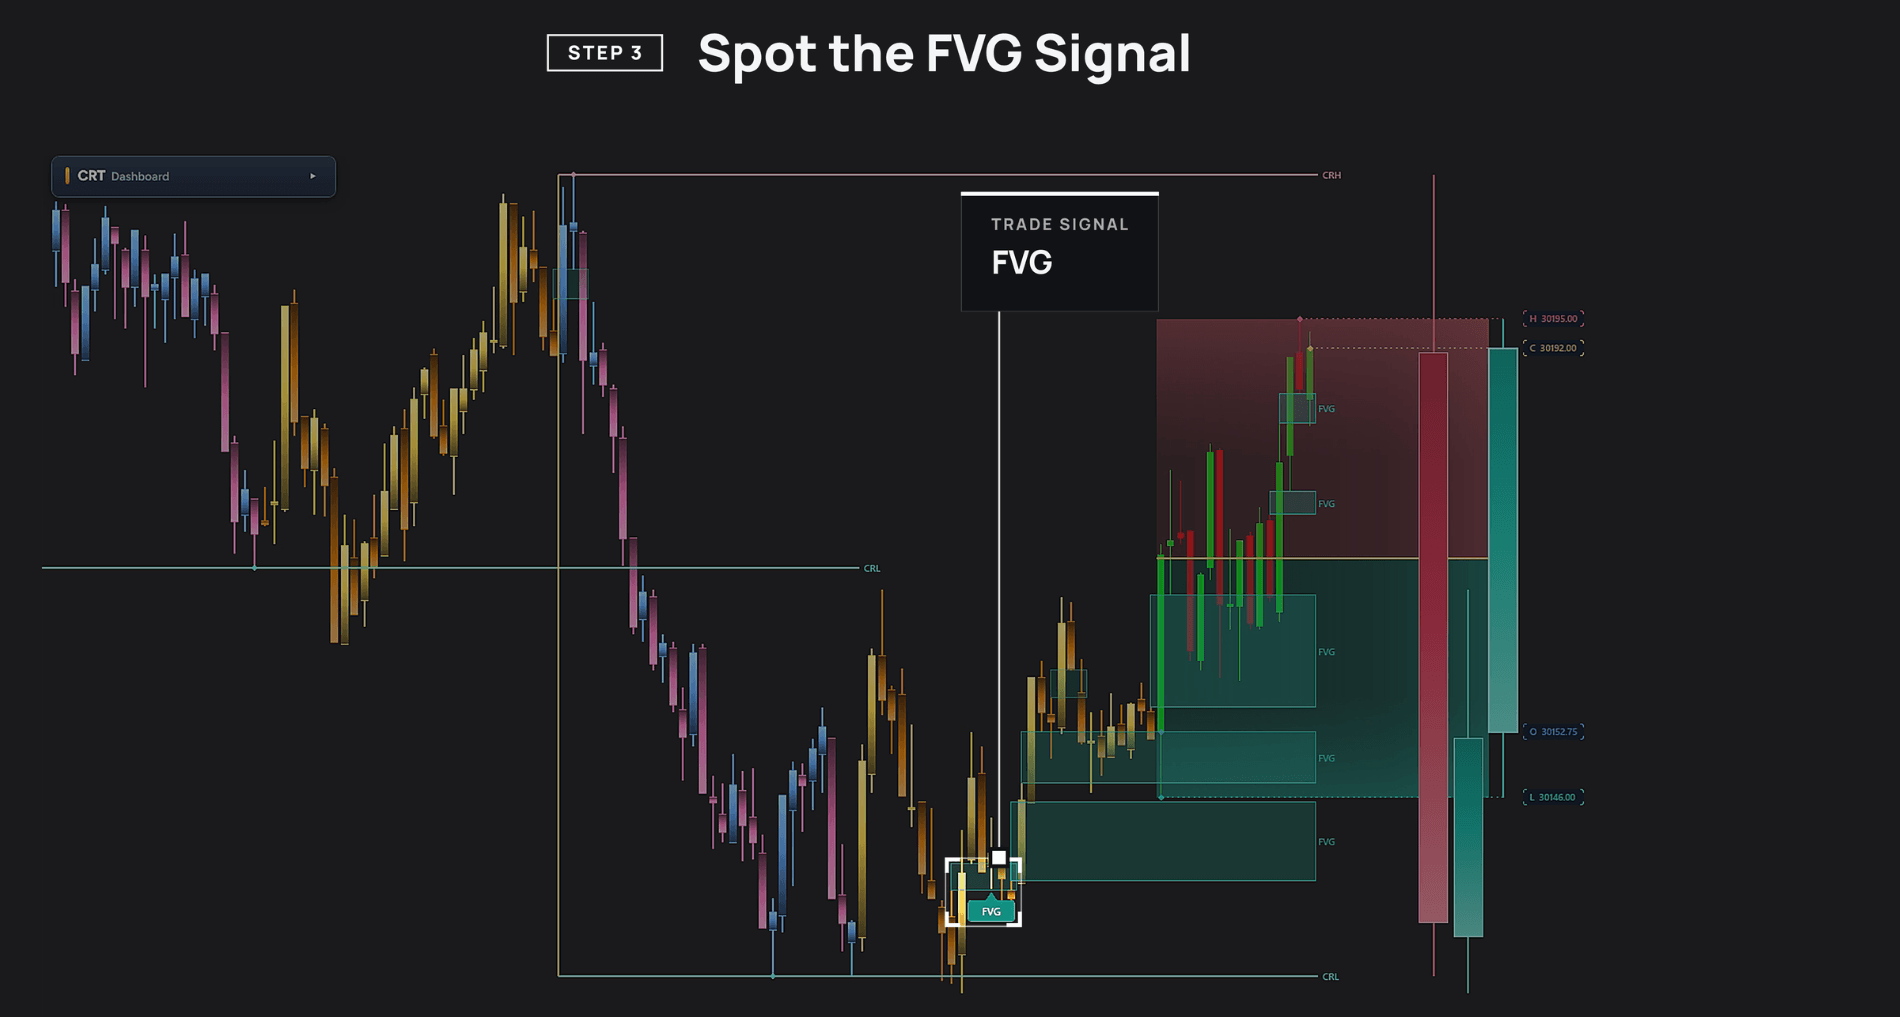
Automatically detect Fair Value Gaps formed during HTF Candle 2 and Candle 3. A signal is triggered when price touches an FVG and closes away from it.
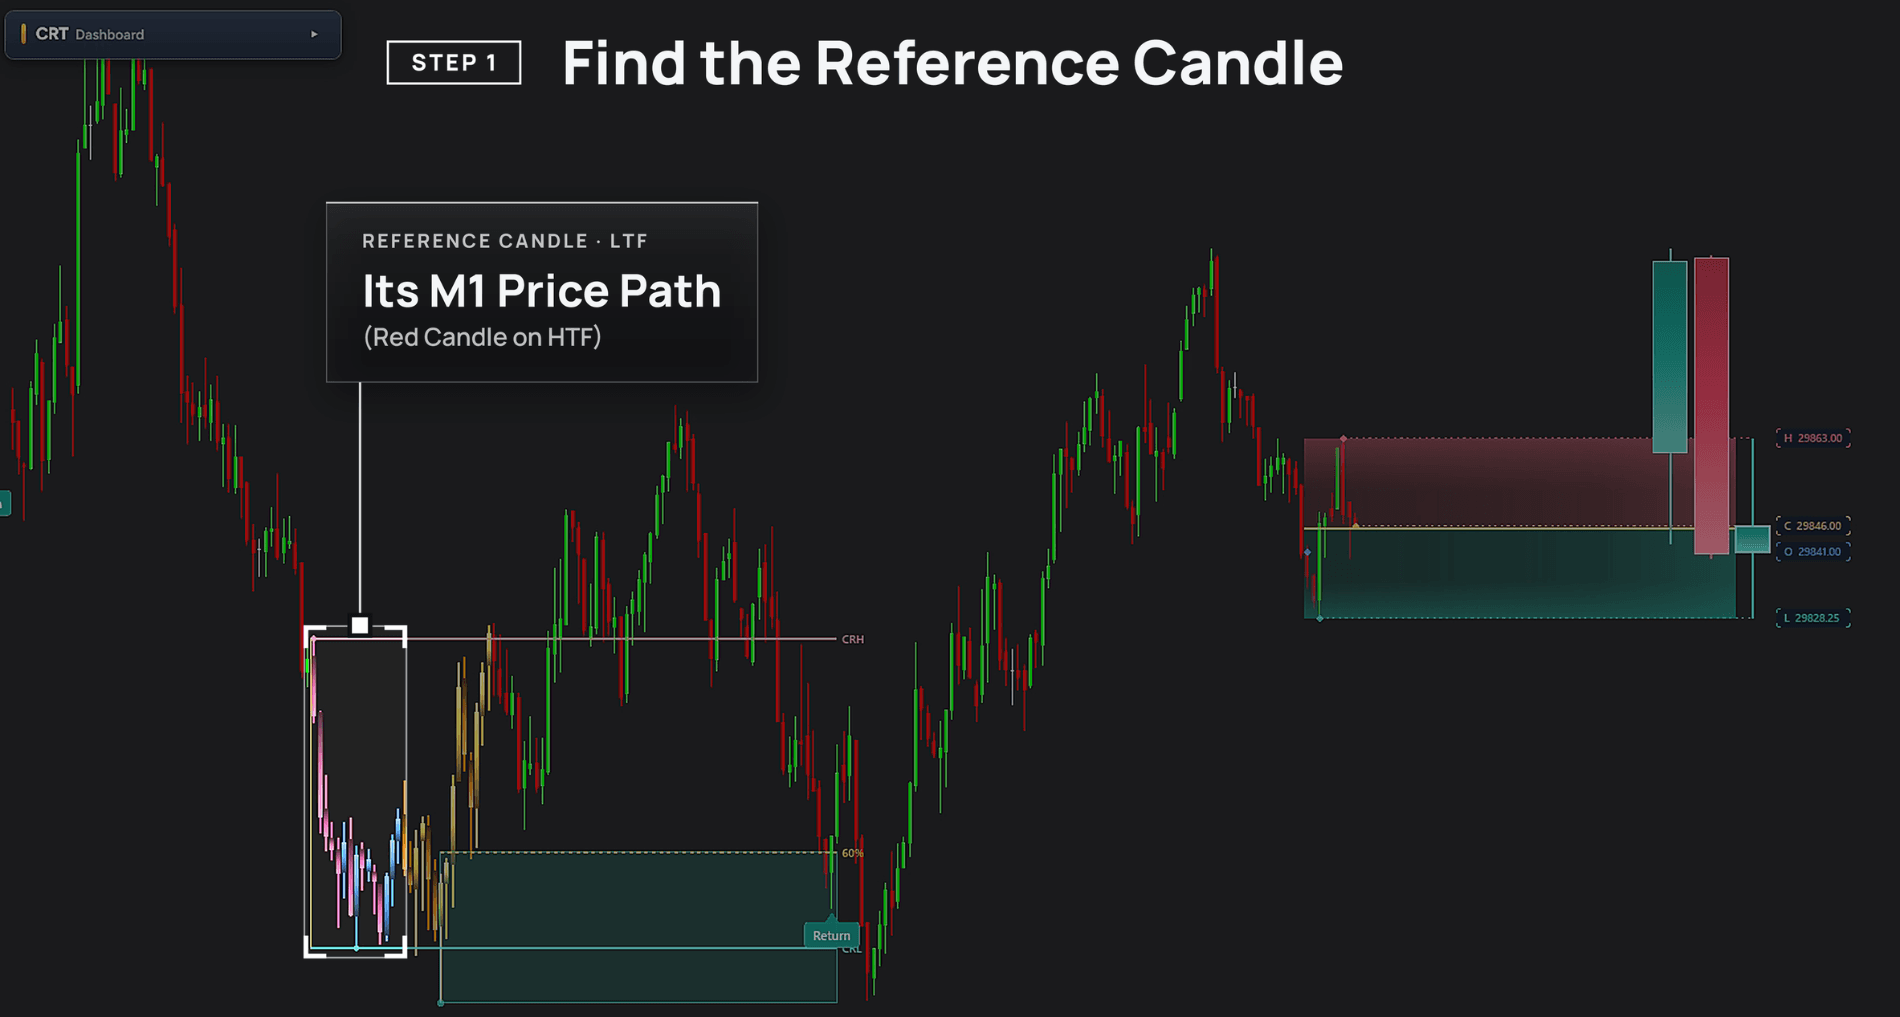
Return setup - Potential reversal after a failed breakout
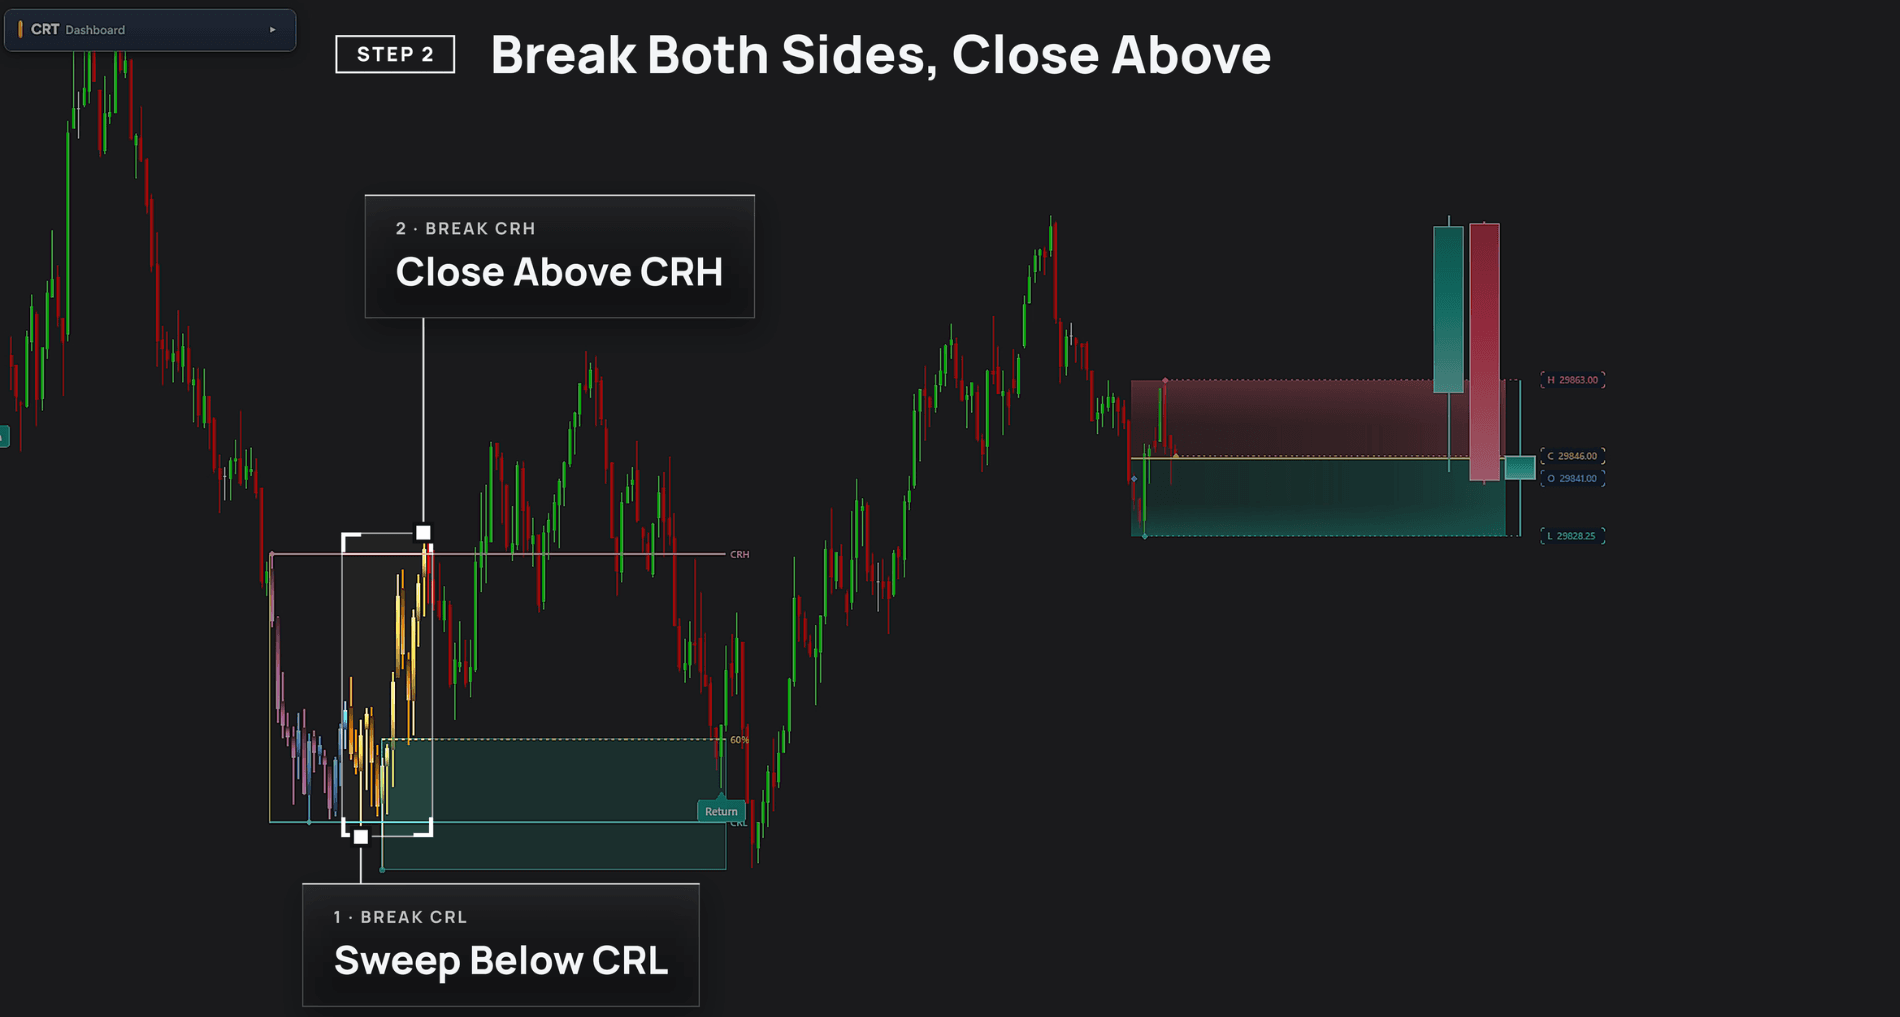
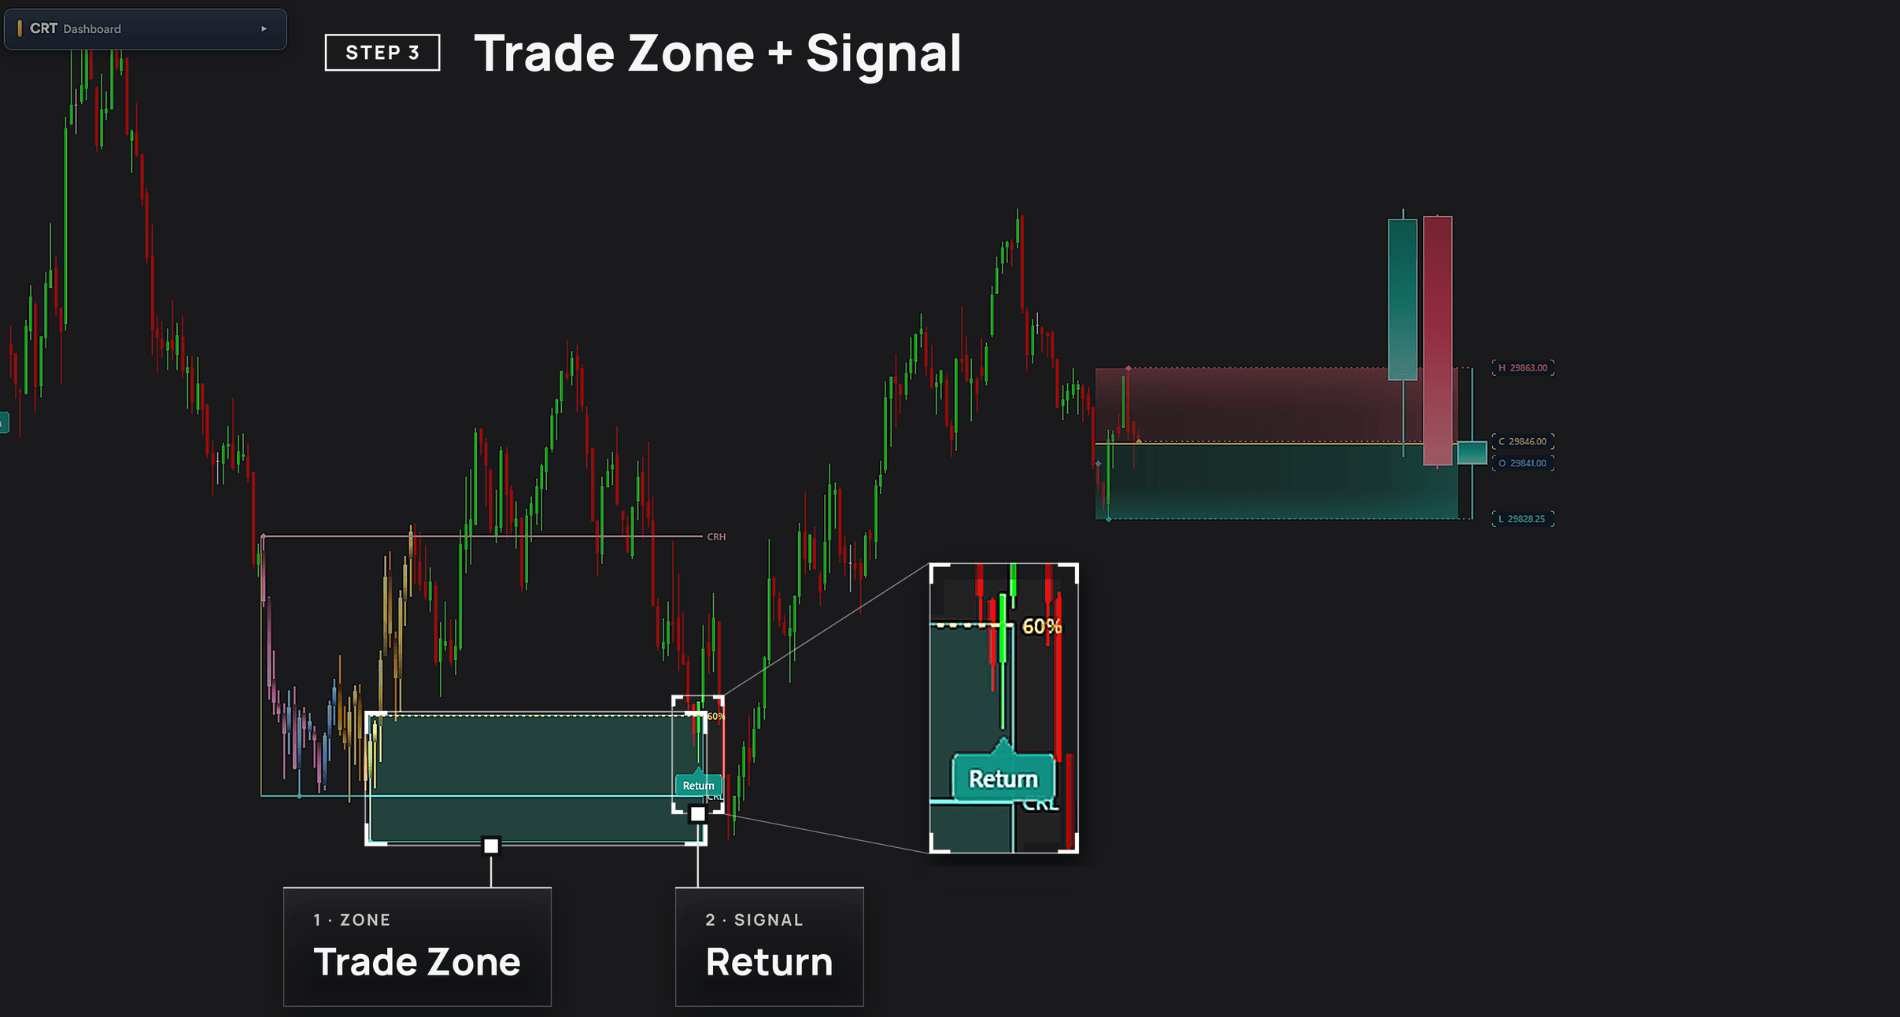
Identify when Candle 2 closes beyond the HTF range with a candle color opposite to Candle 1. The setup then waits for price to retrace to a predefined percentage level before signaling a potential reversal opportunity.
Break Setup - Potential trend continuation
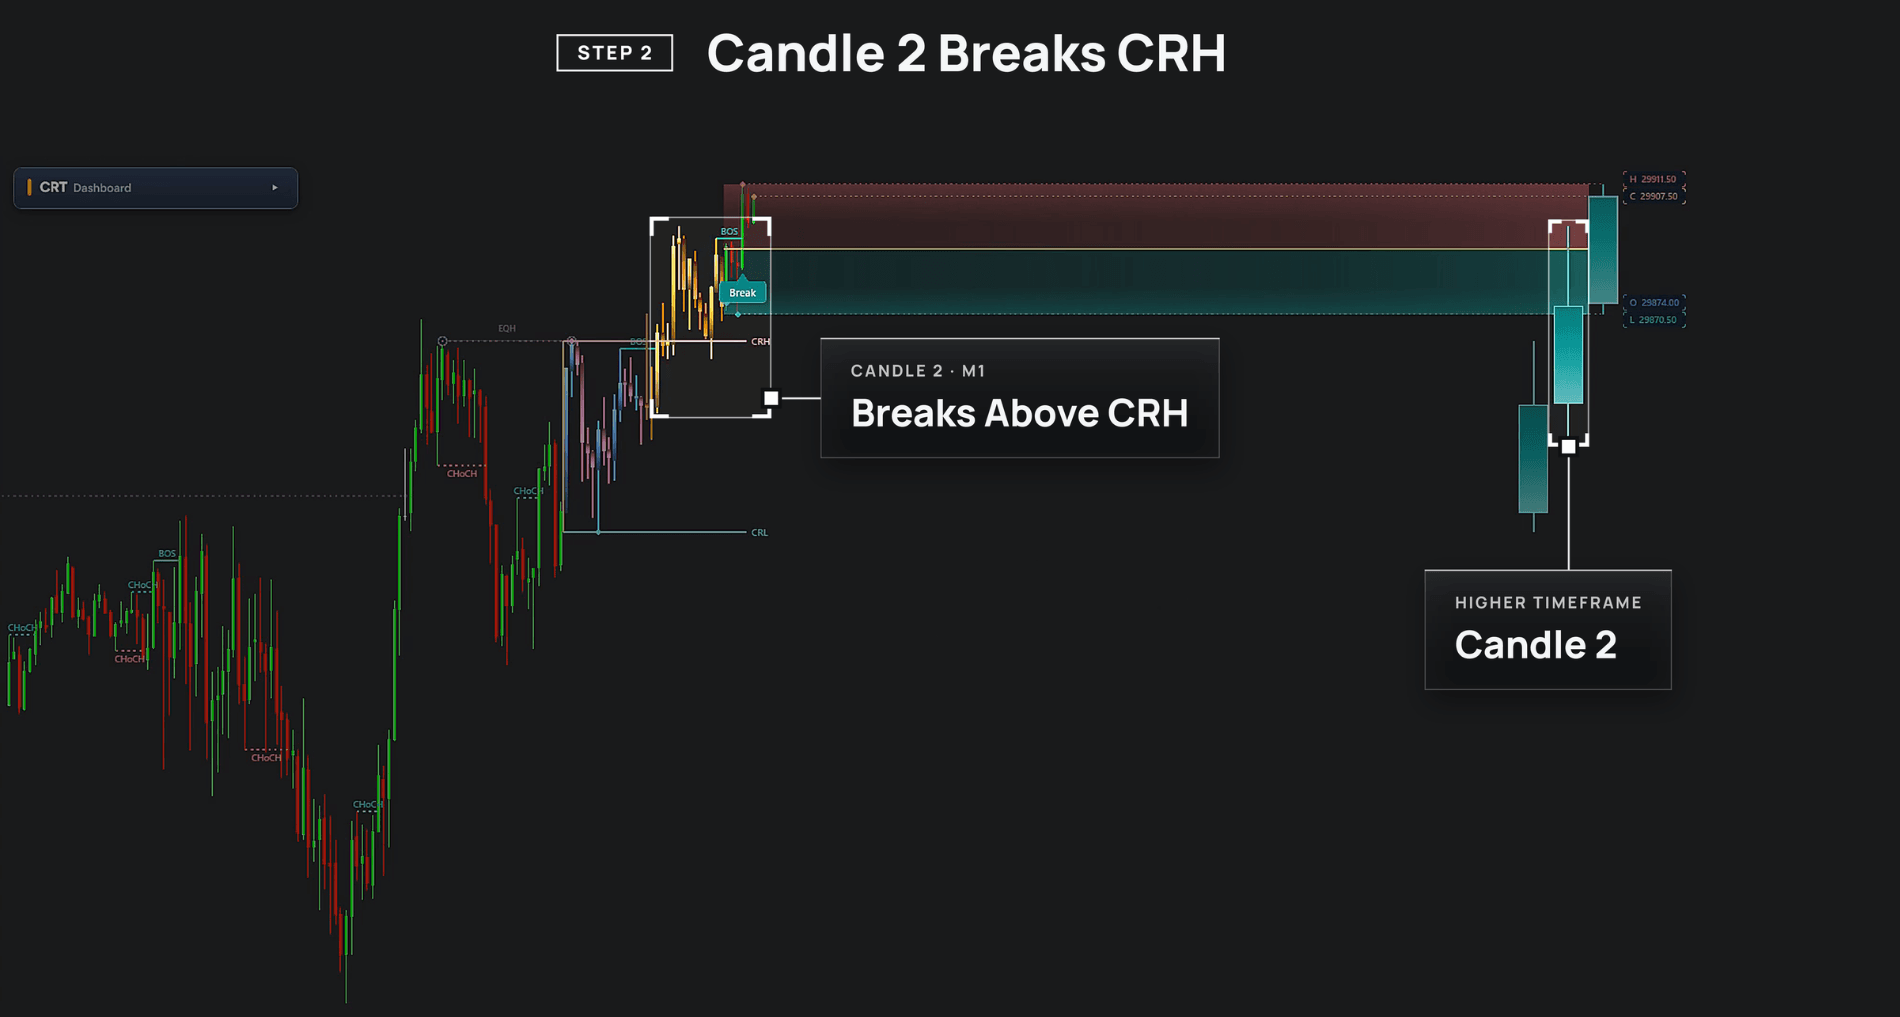
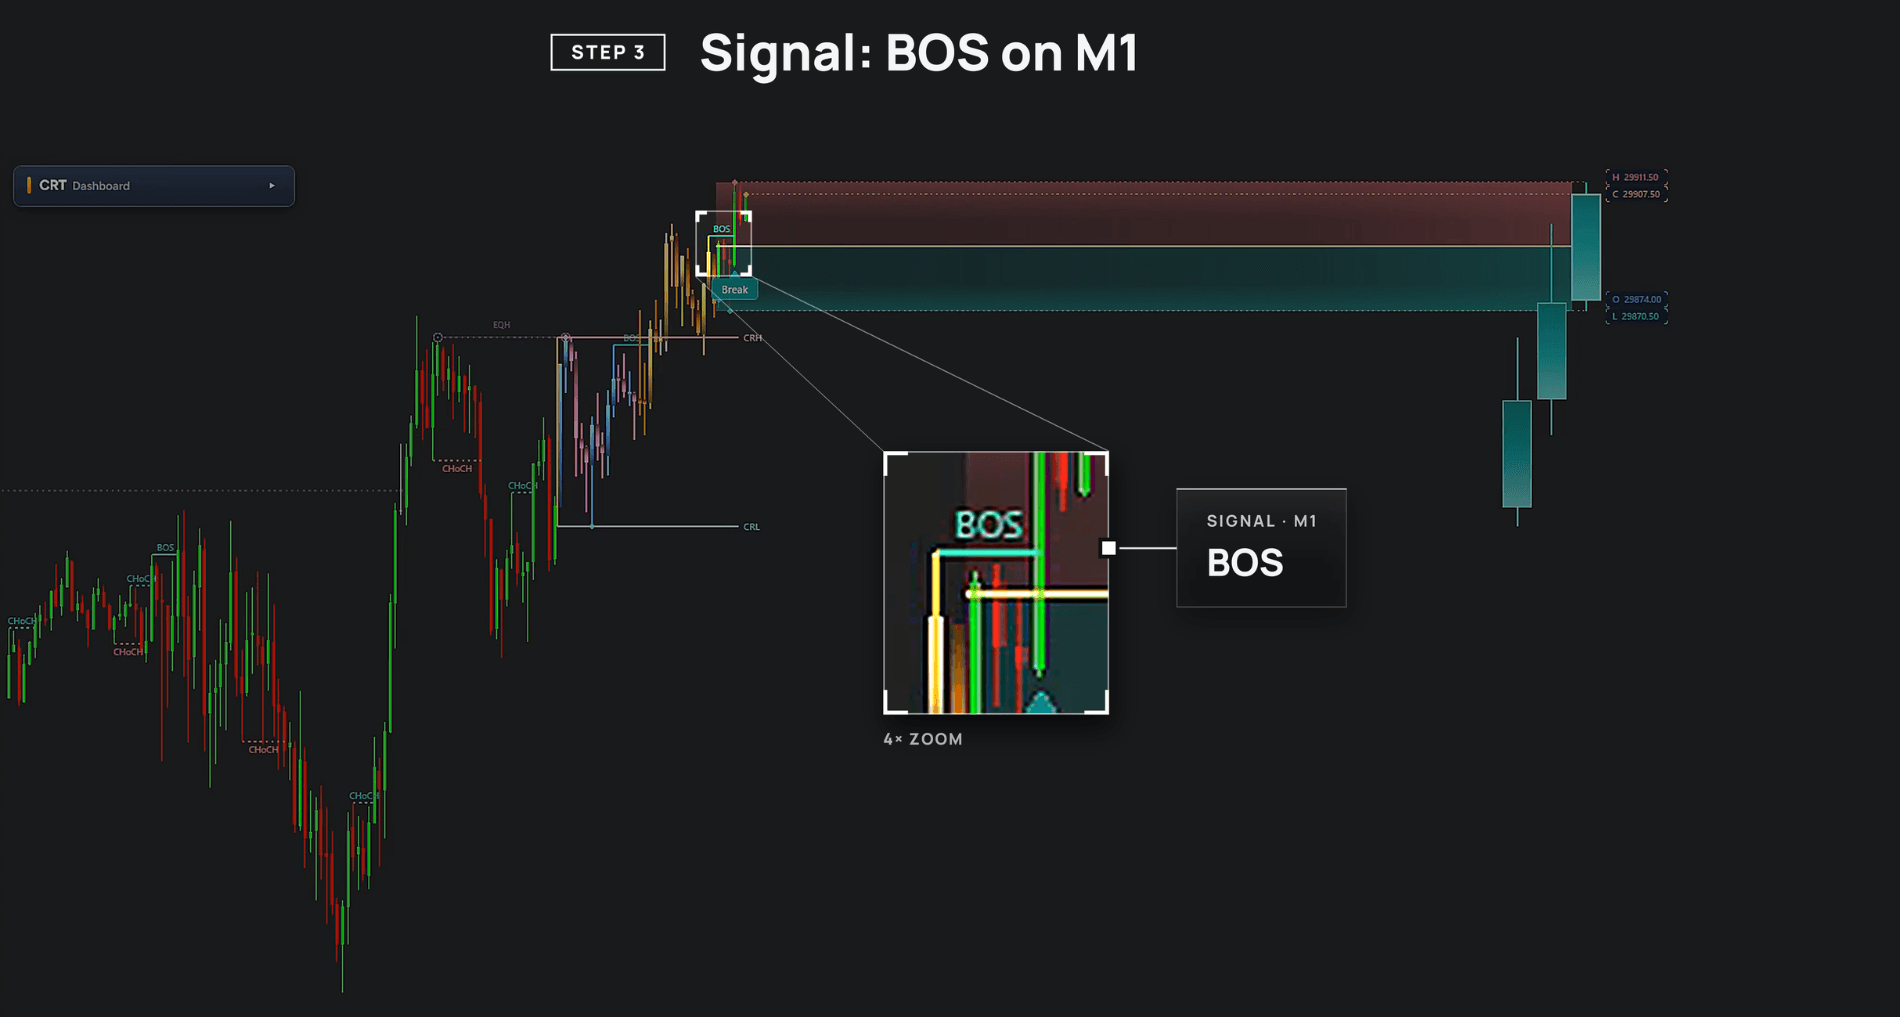
Detect when Candle 2 closes beyond CRH or CRL in the same direction as Candle 1. CRT Alpha then waits for a lower timeframe Break of Structure (BOS) to confirm a potential continuation entry.
03
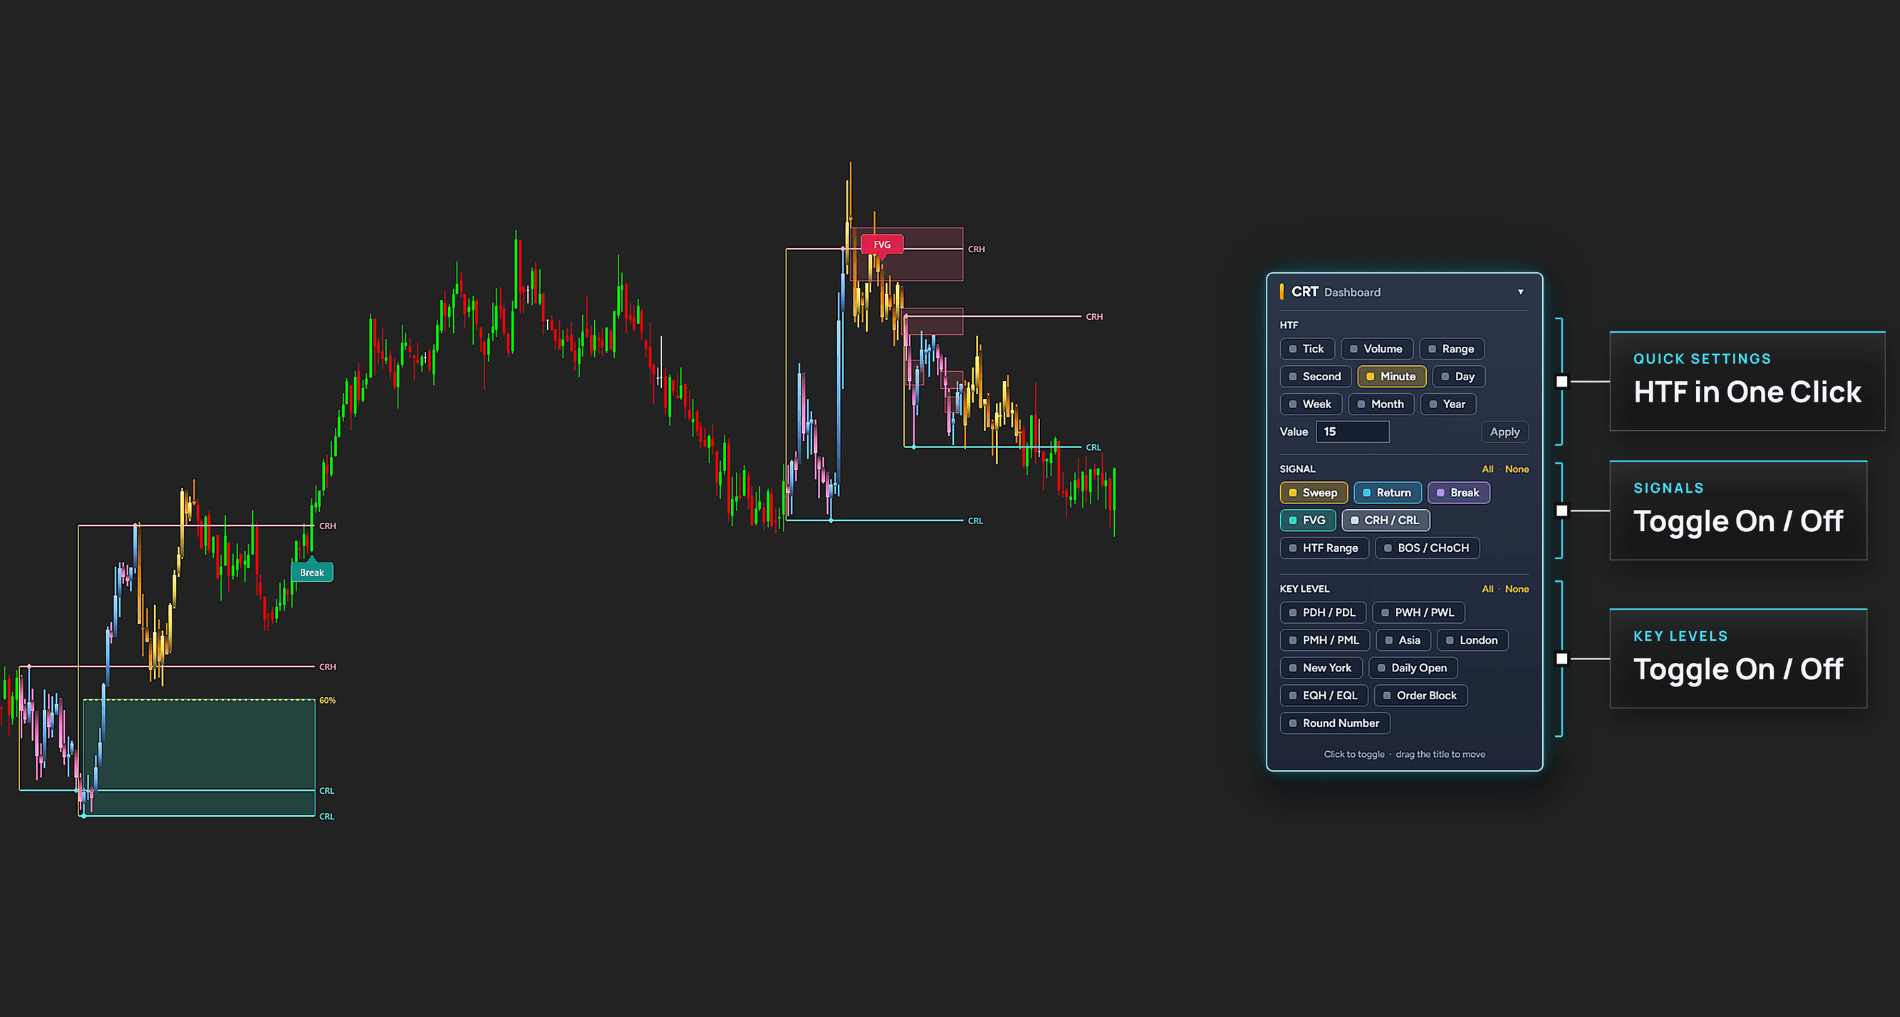
When you need more market context to assess potential CRT setups, understand structural shifts, and identify relevant price levels without manually tracking multiple SMC/ICT tools.
Track market structure shifts
Automatically identify multi-candle Swing Highs and Swing Lows, then distinguish between Break of Structure (BOS) and Change of Character (CHoCH) through different line styles.
Evaluate Order Block quality
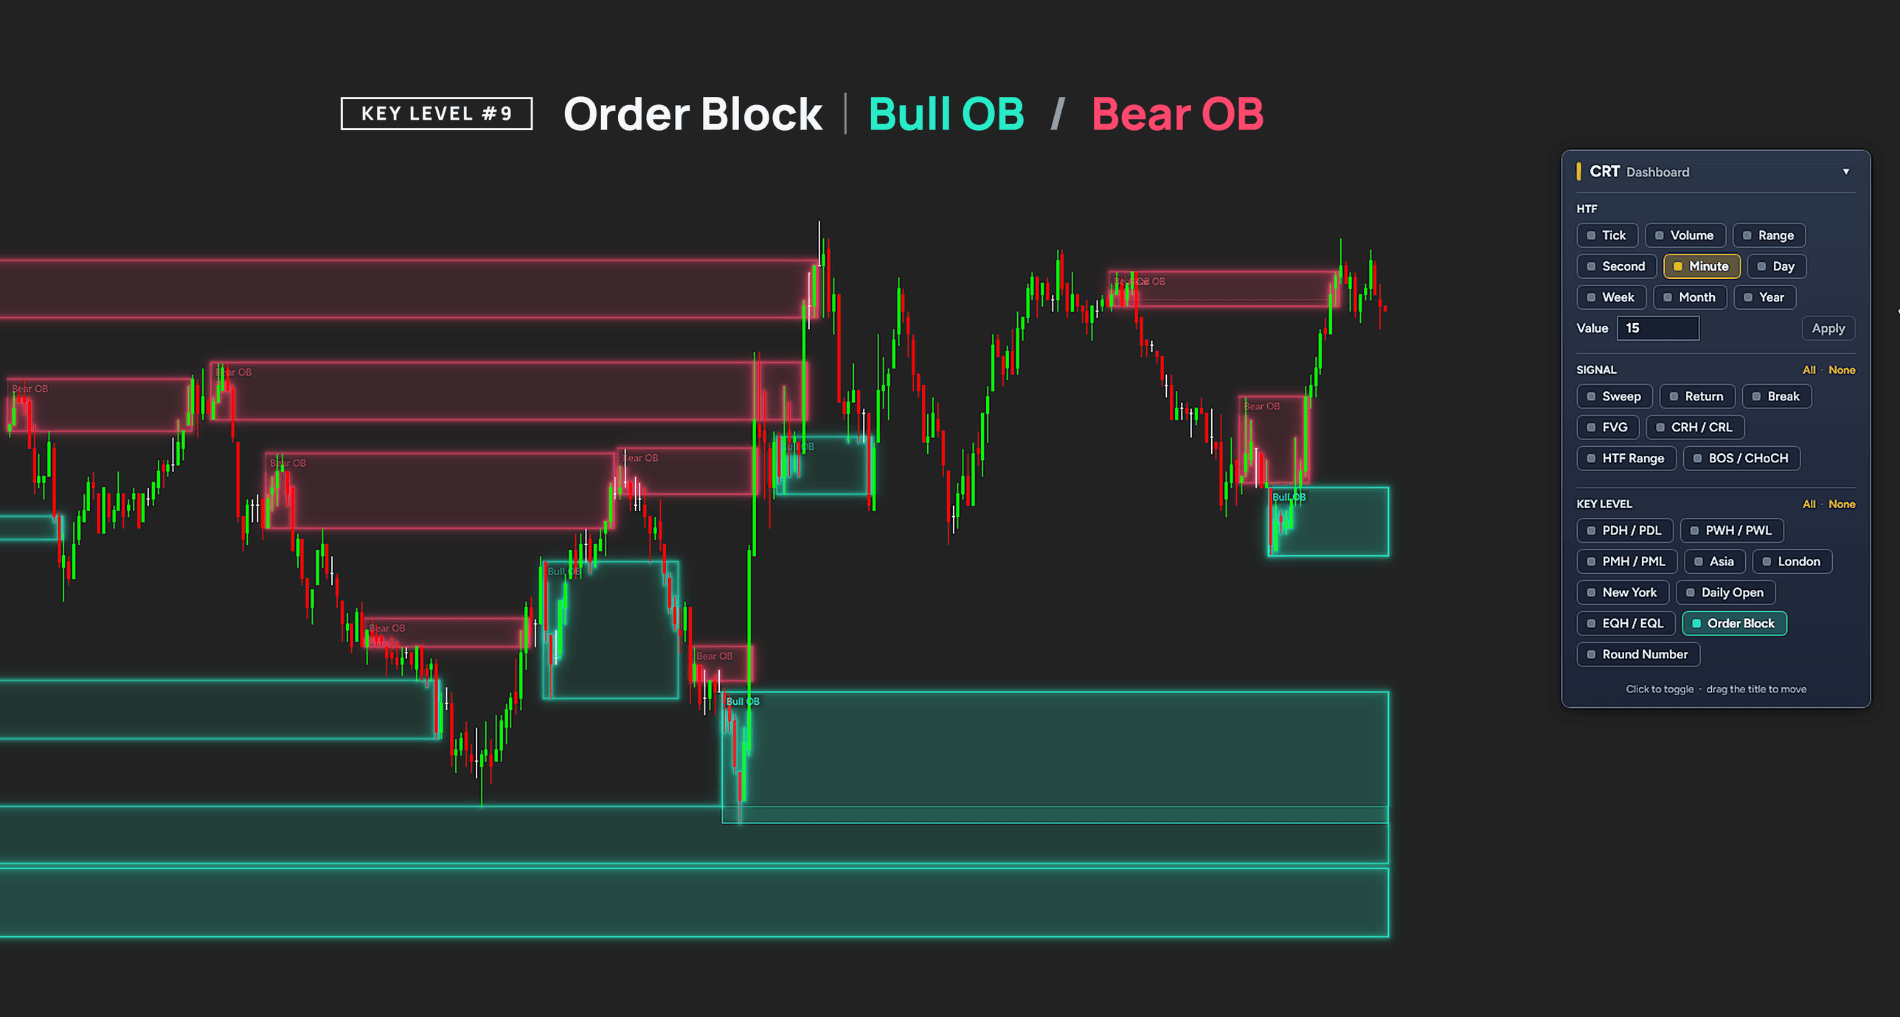
Use an automated OB scoring system (0-3) to evaluate Order Blocks based on 3 criteria: prior liquidity sweep, strong displacement body, and volume spike.
Display the 50% Mean Threshold and mark mitigated Order Blocks, helping traders assess their structure and mitigation status at a glance.
Identify potential liquidity pools
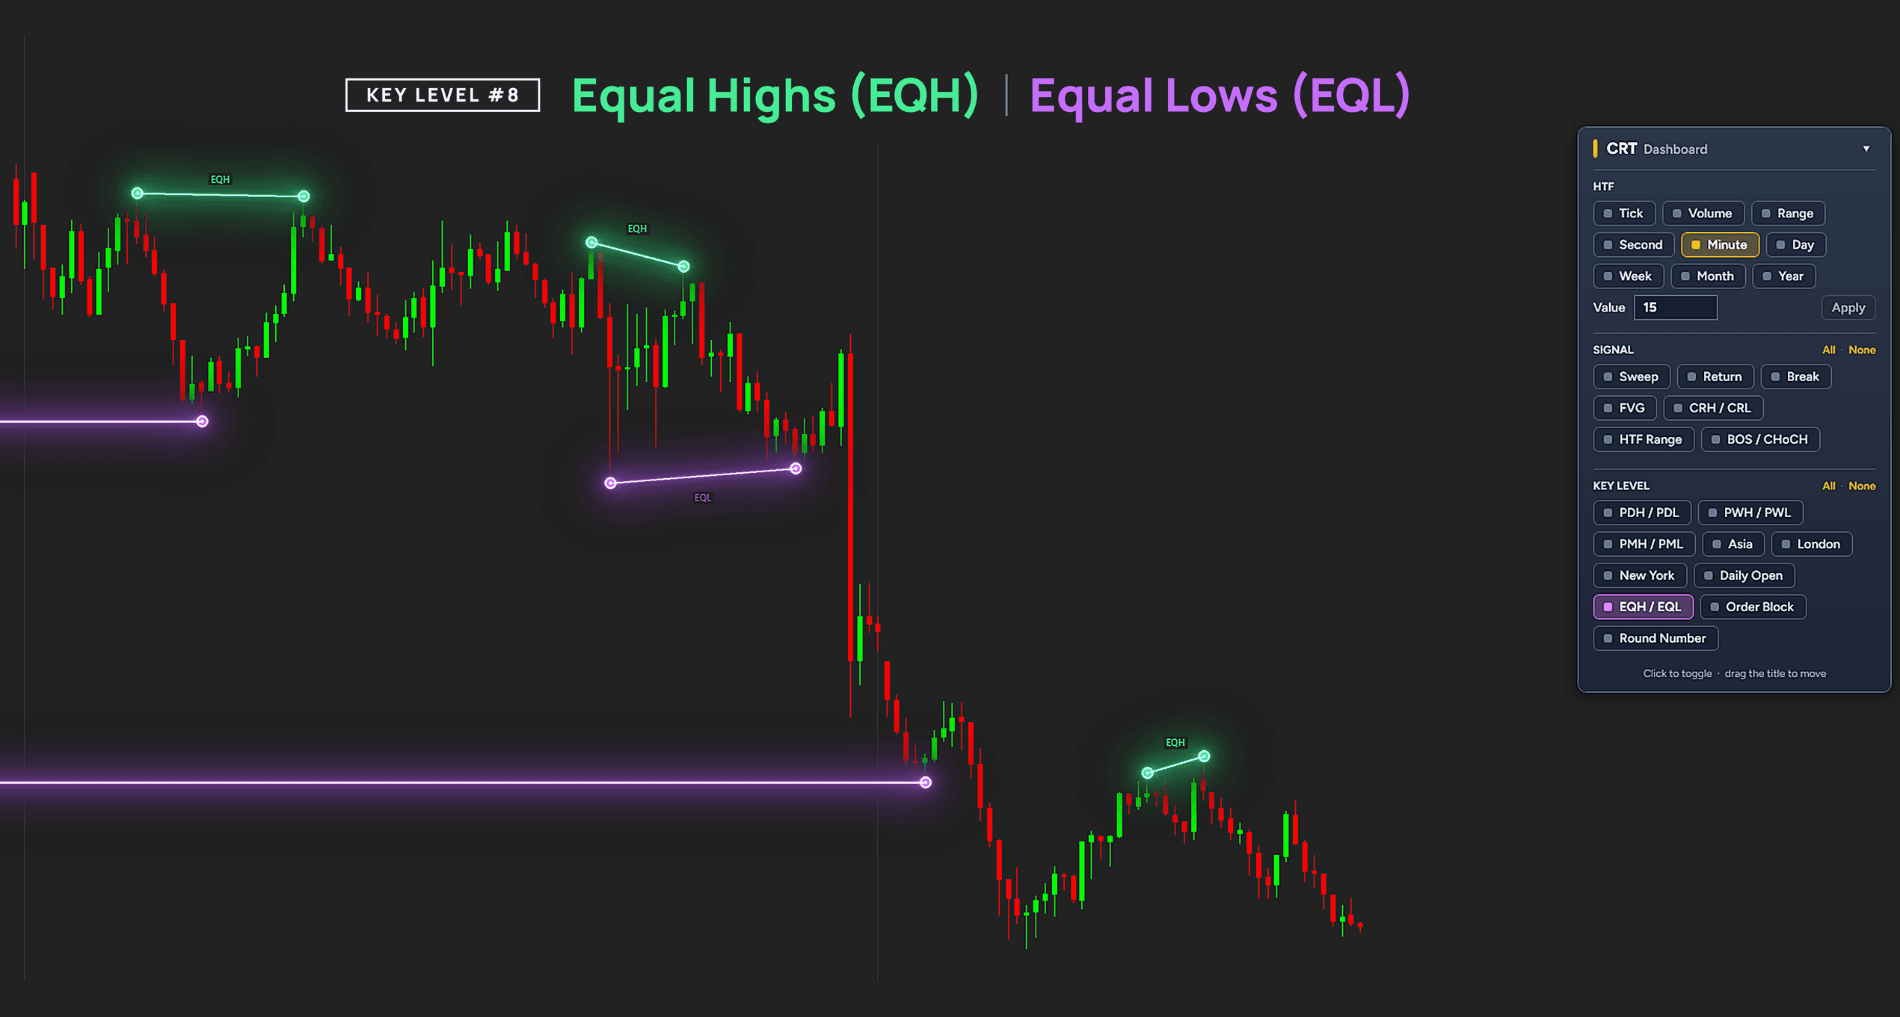
Automatically detect and connect Equal Highs (EQH) and Equal Lows (EQL) using ATR-based tolerance.
Highlight potential untapped liquidity areas to help traders monitor where price may react.
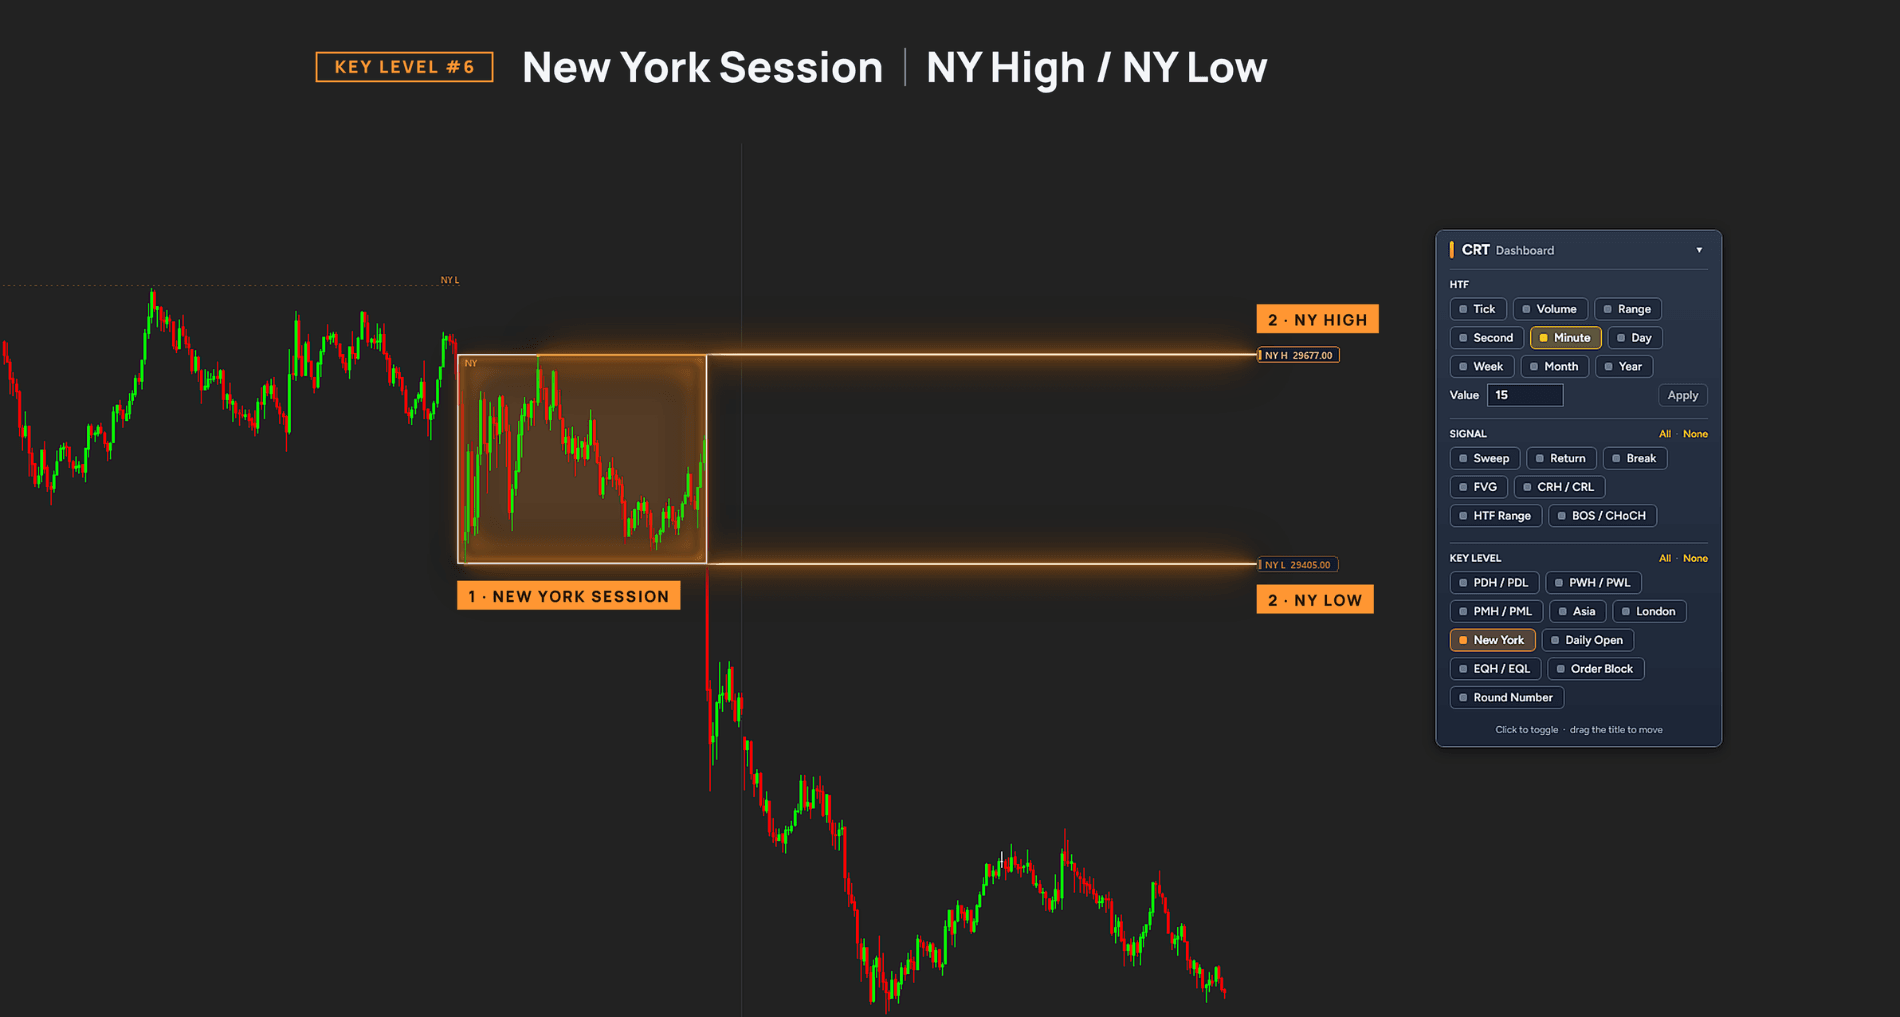
Monitor key market levels
Keep important price references visible on your chart, including:
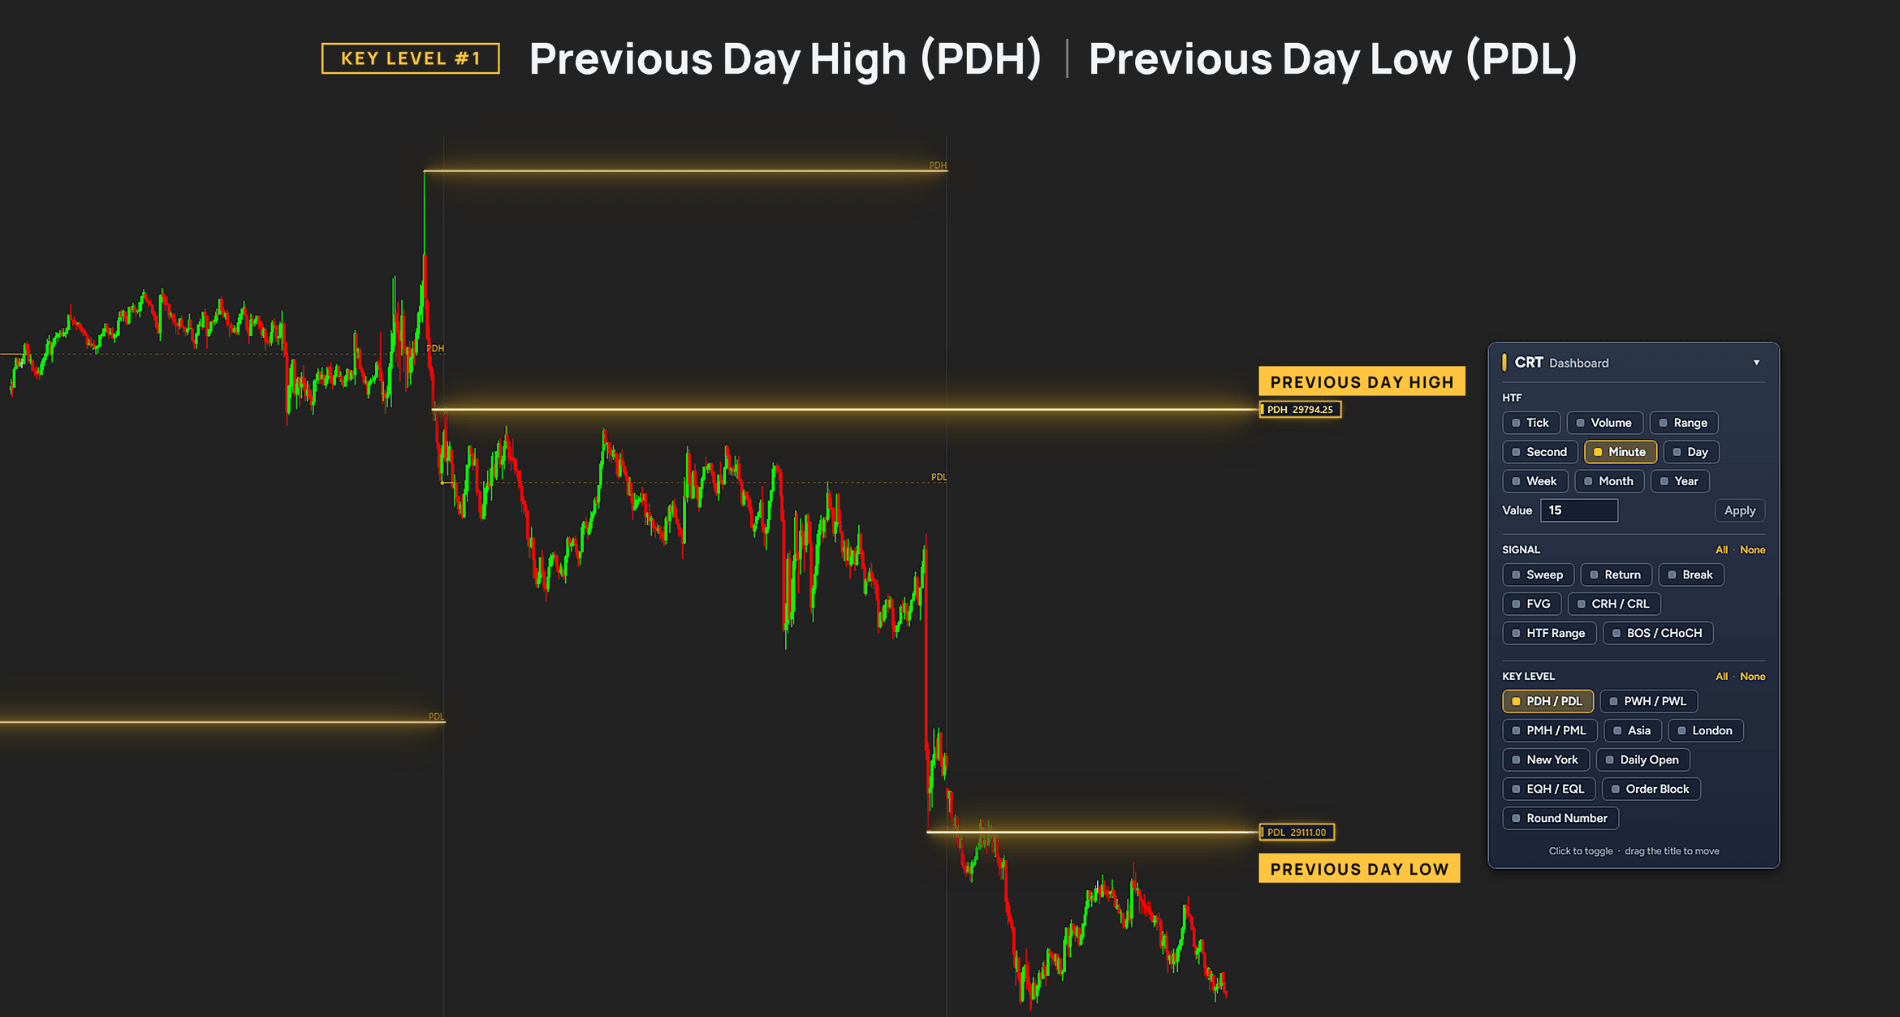
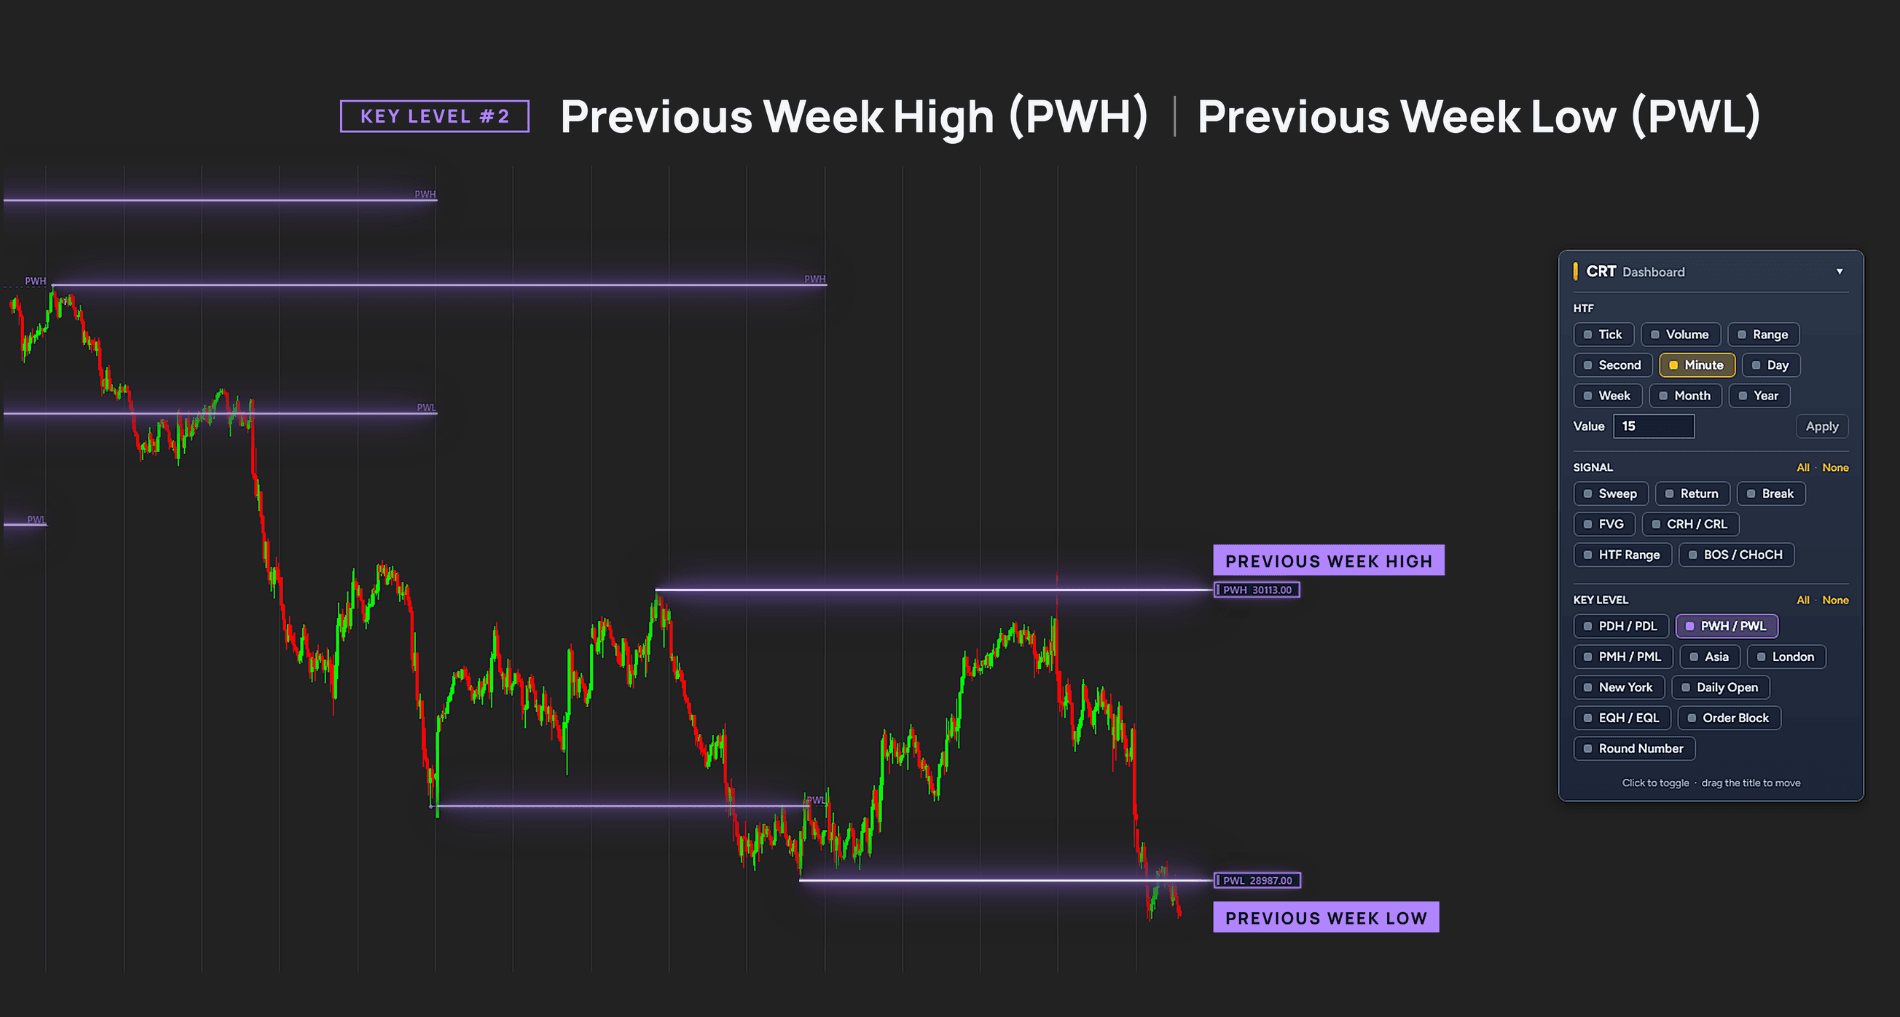
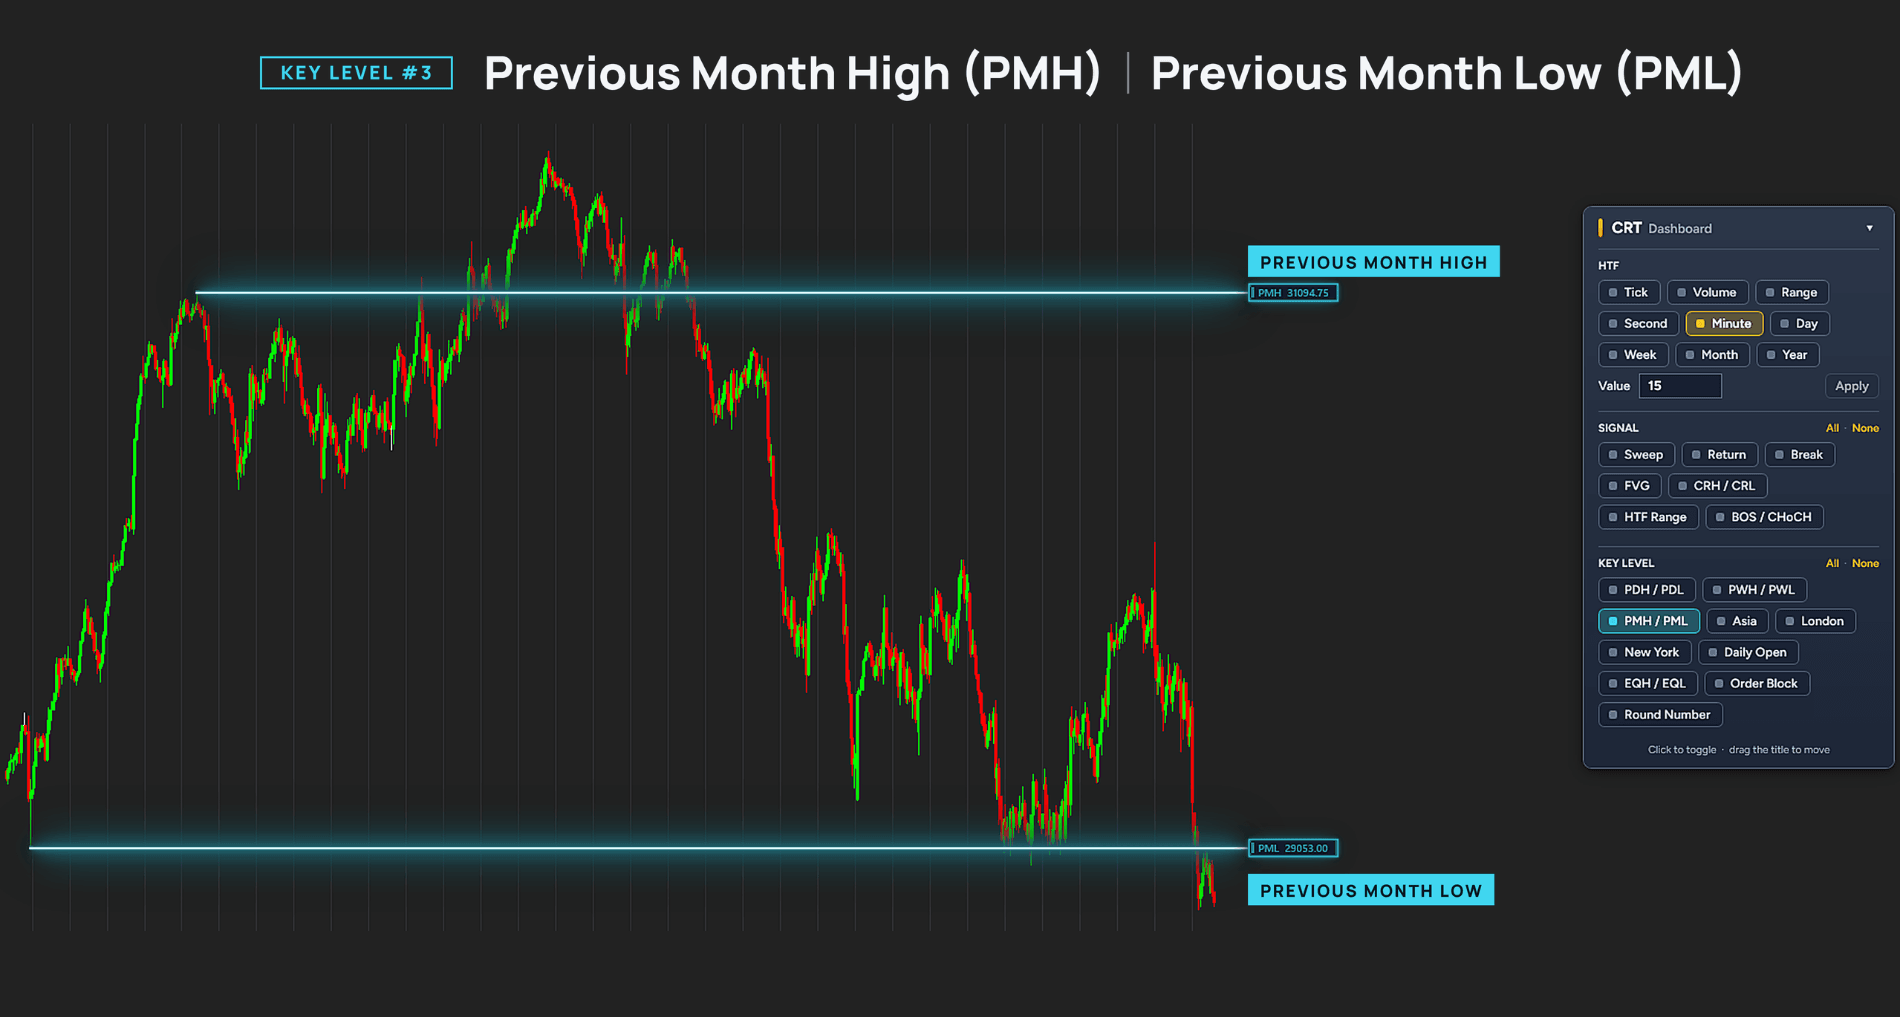
Previous period Highs & Lows: PDH/PDL, PWH/PWL, PMH/PML.
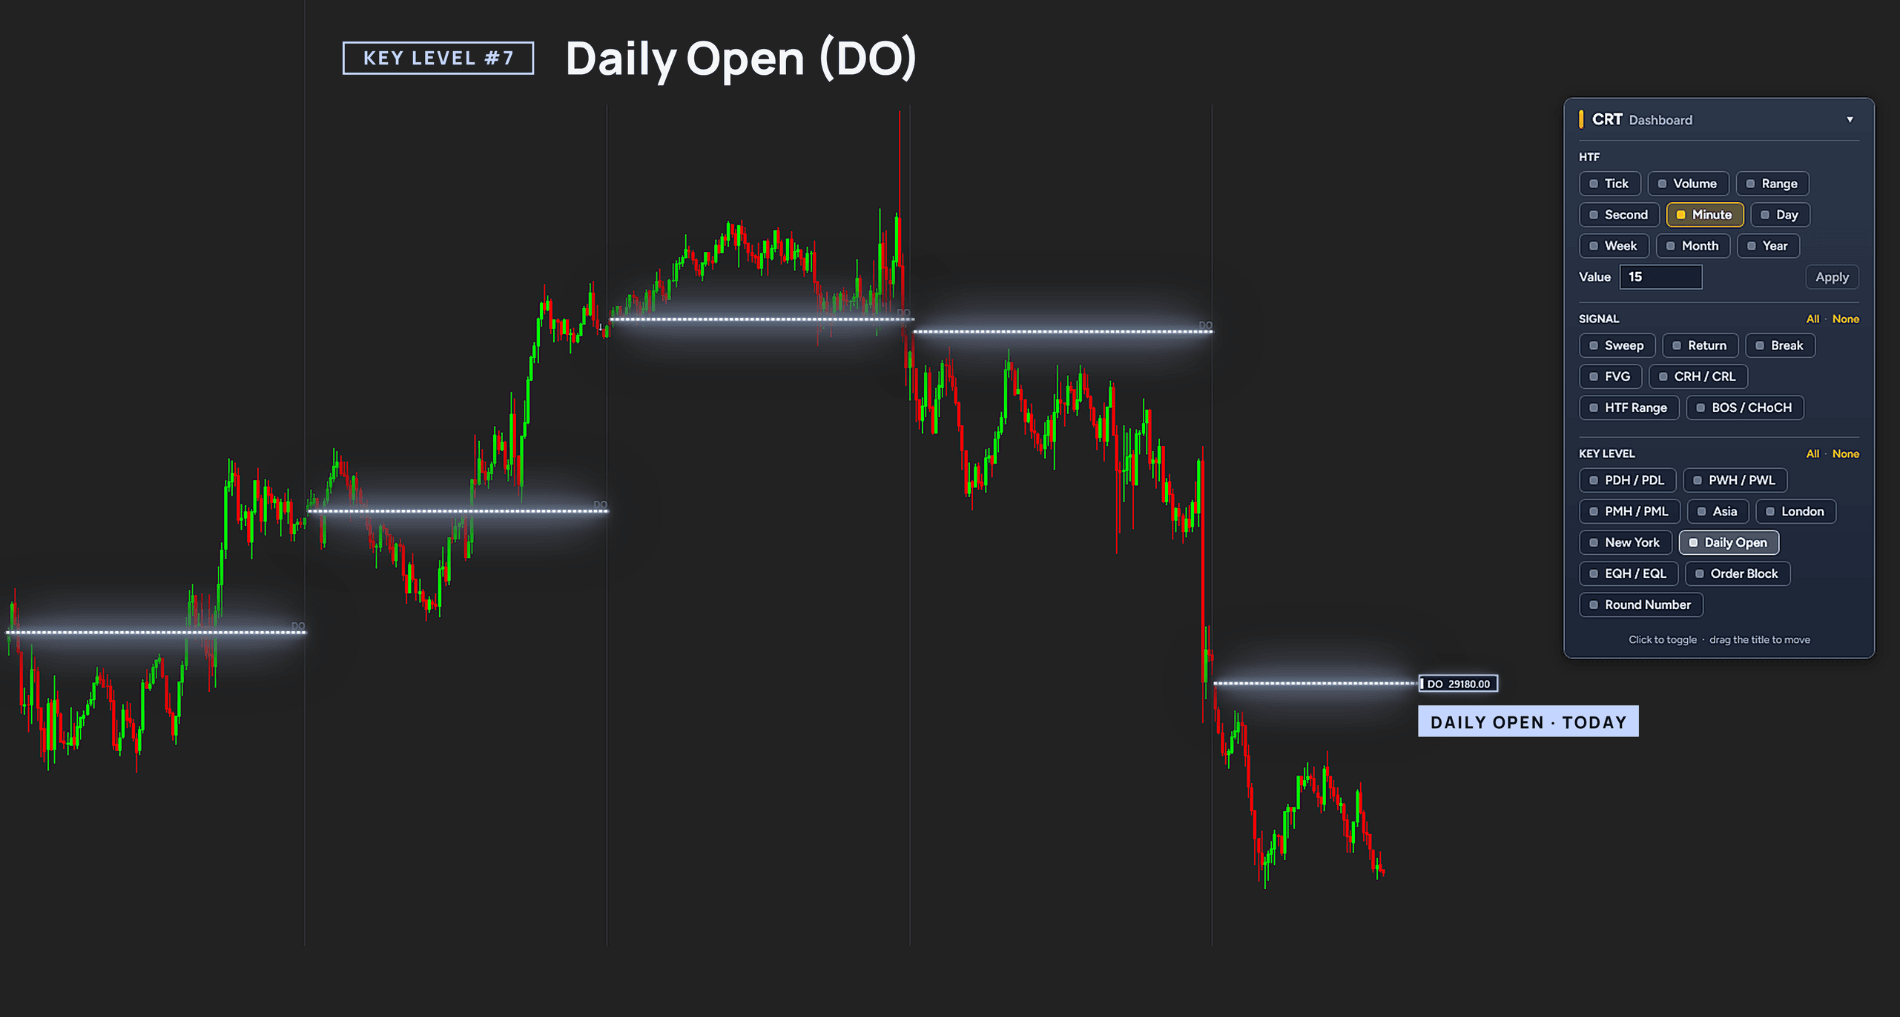
Daily Open: The current day's opening price.
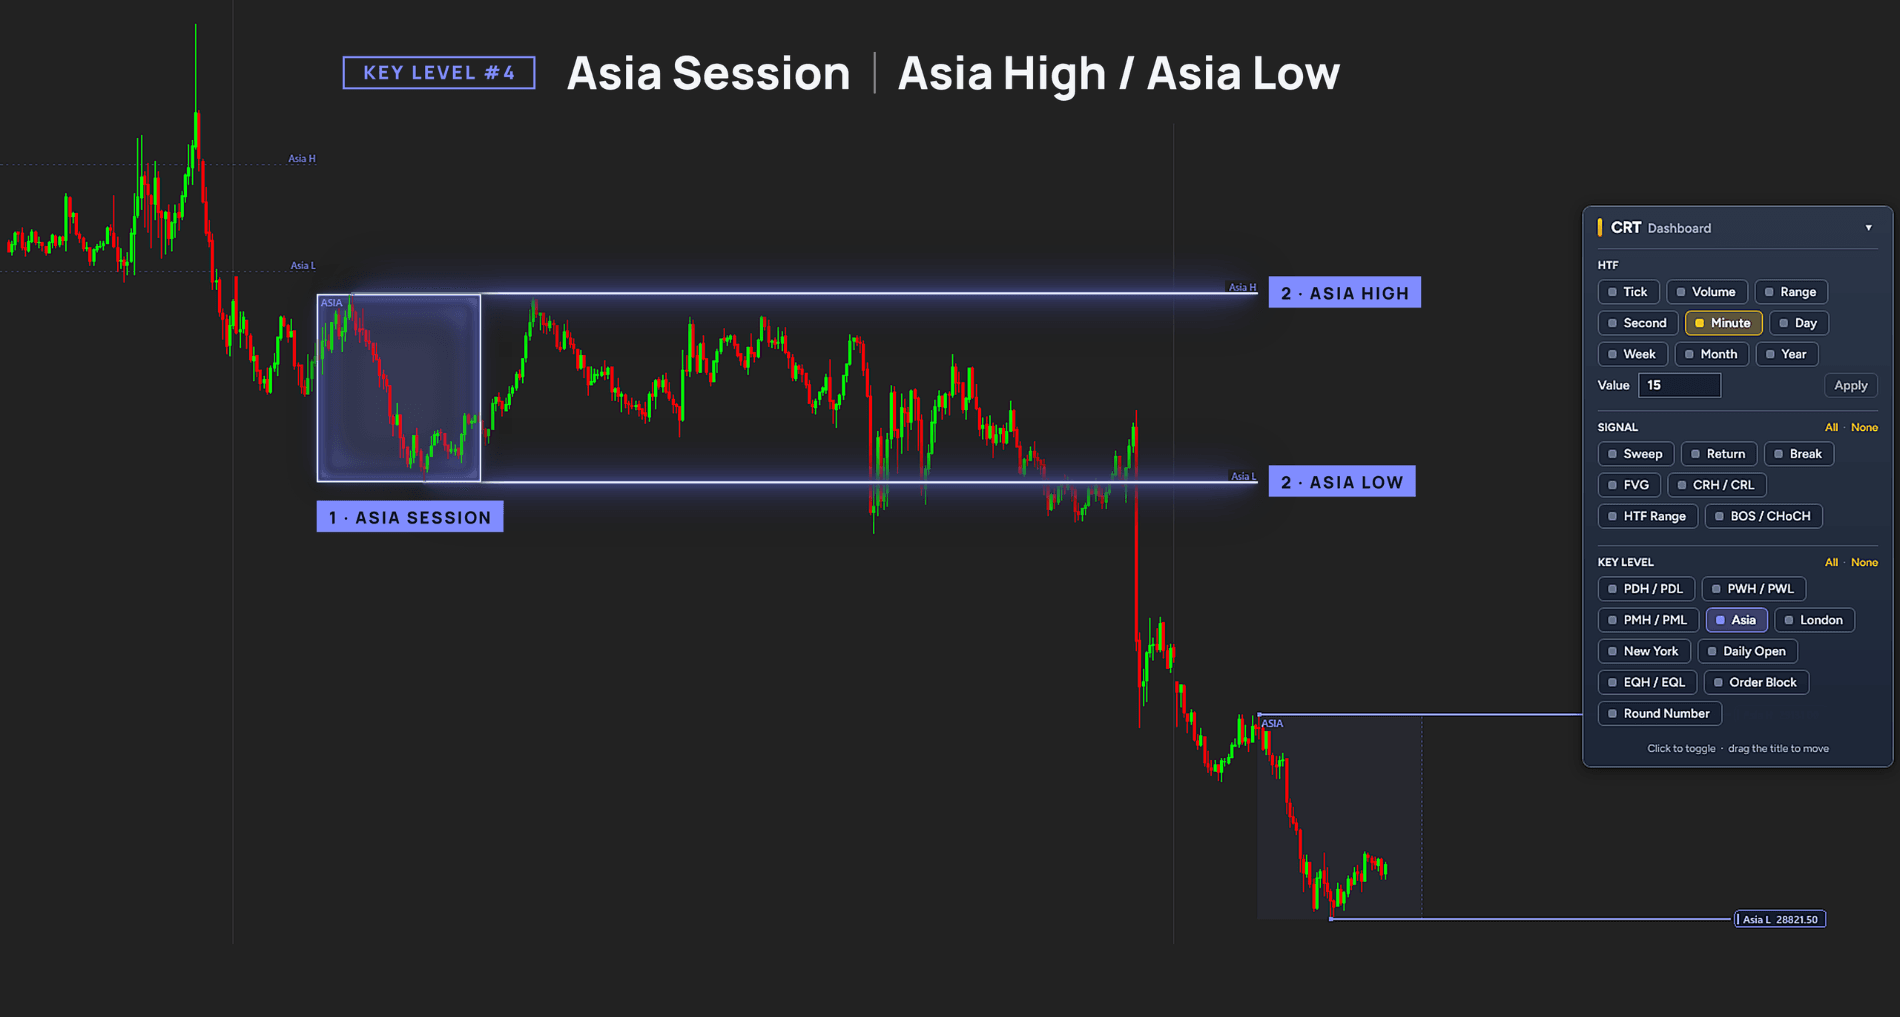
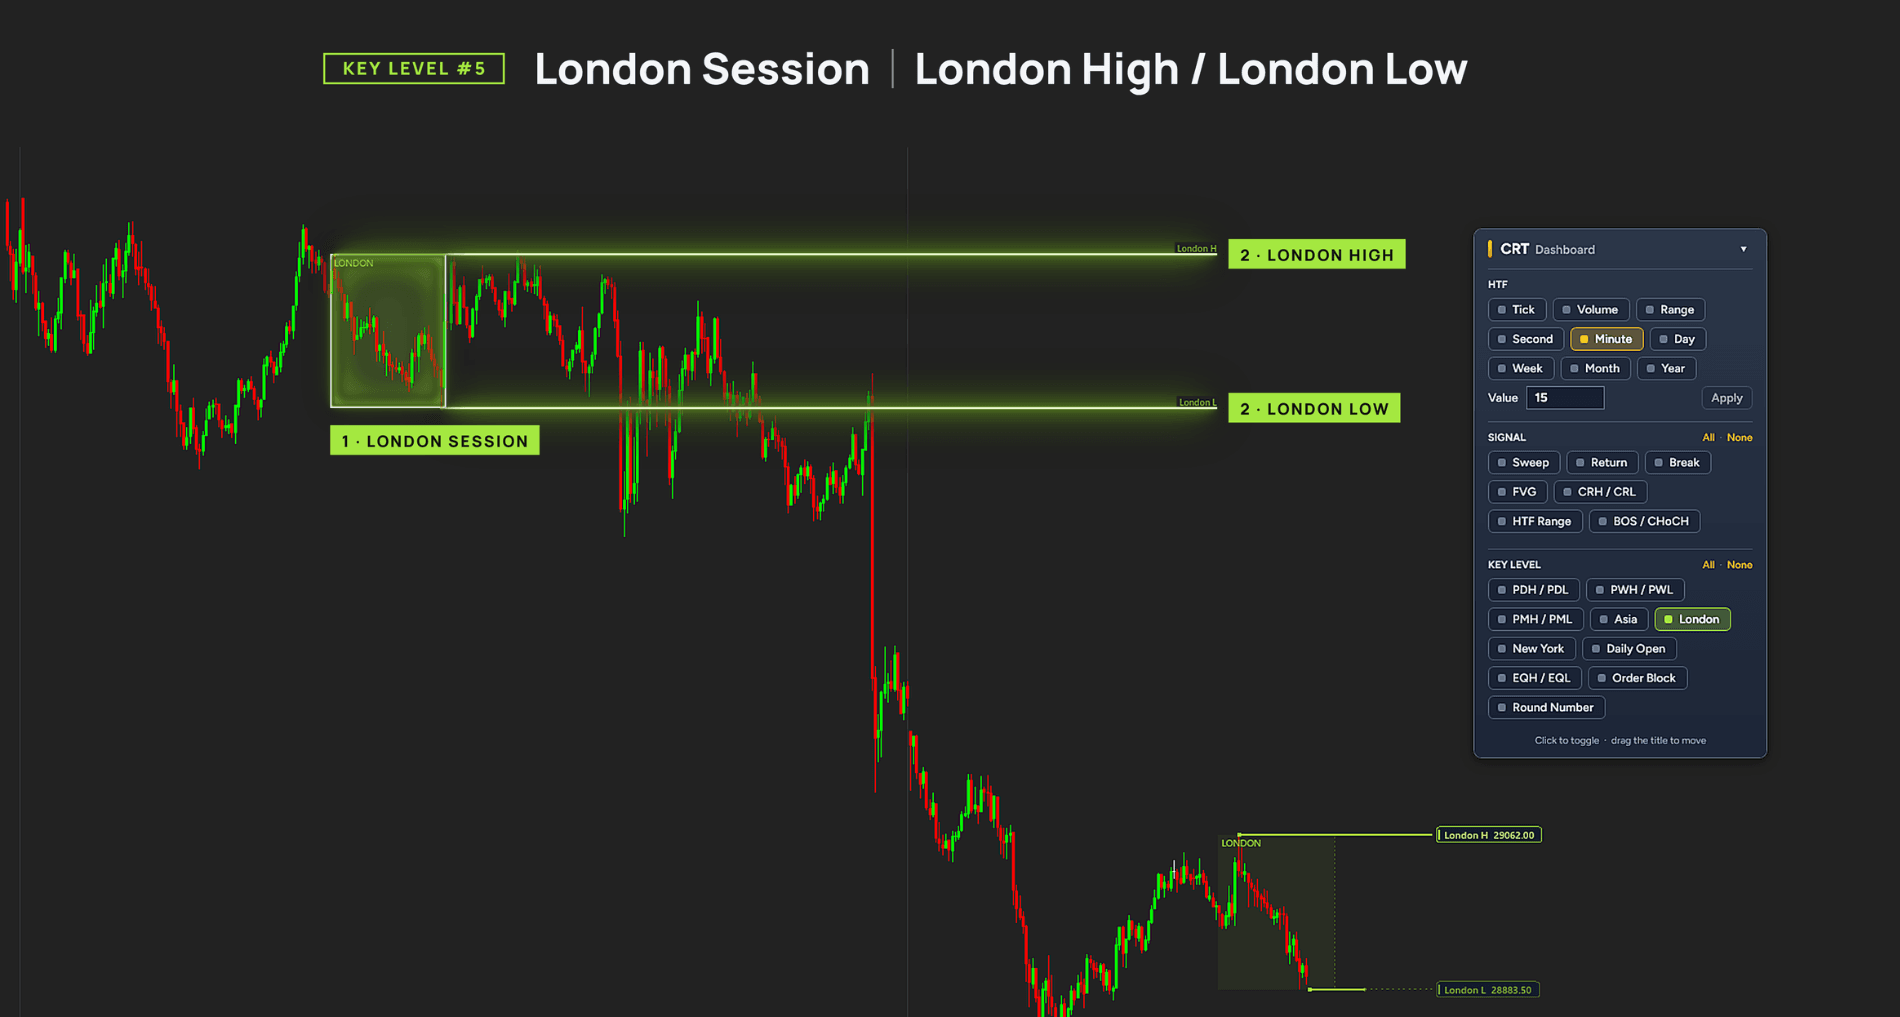
Trading Sessions: Asia, London, and New York.
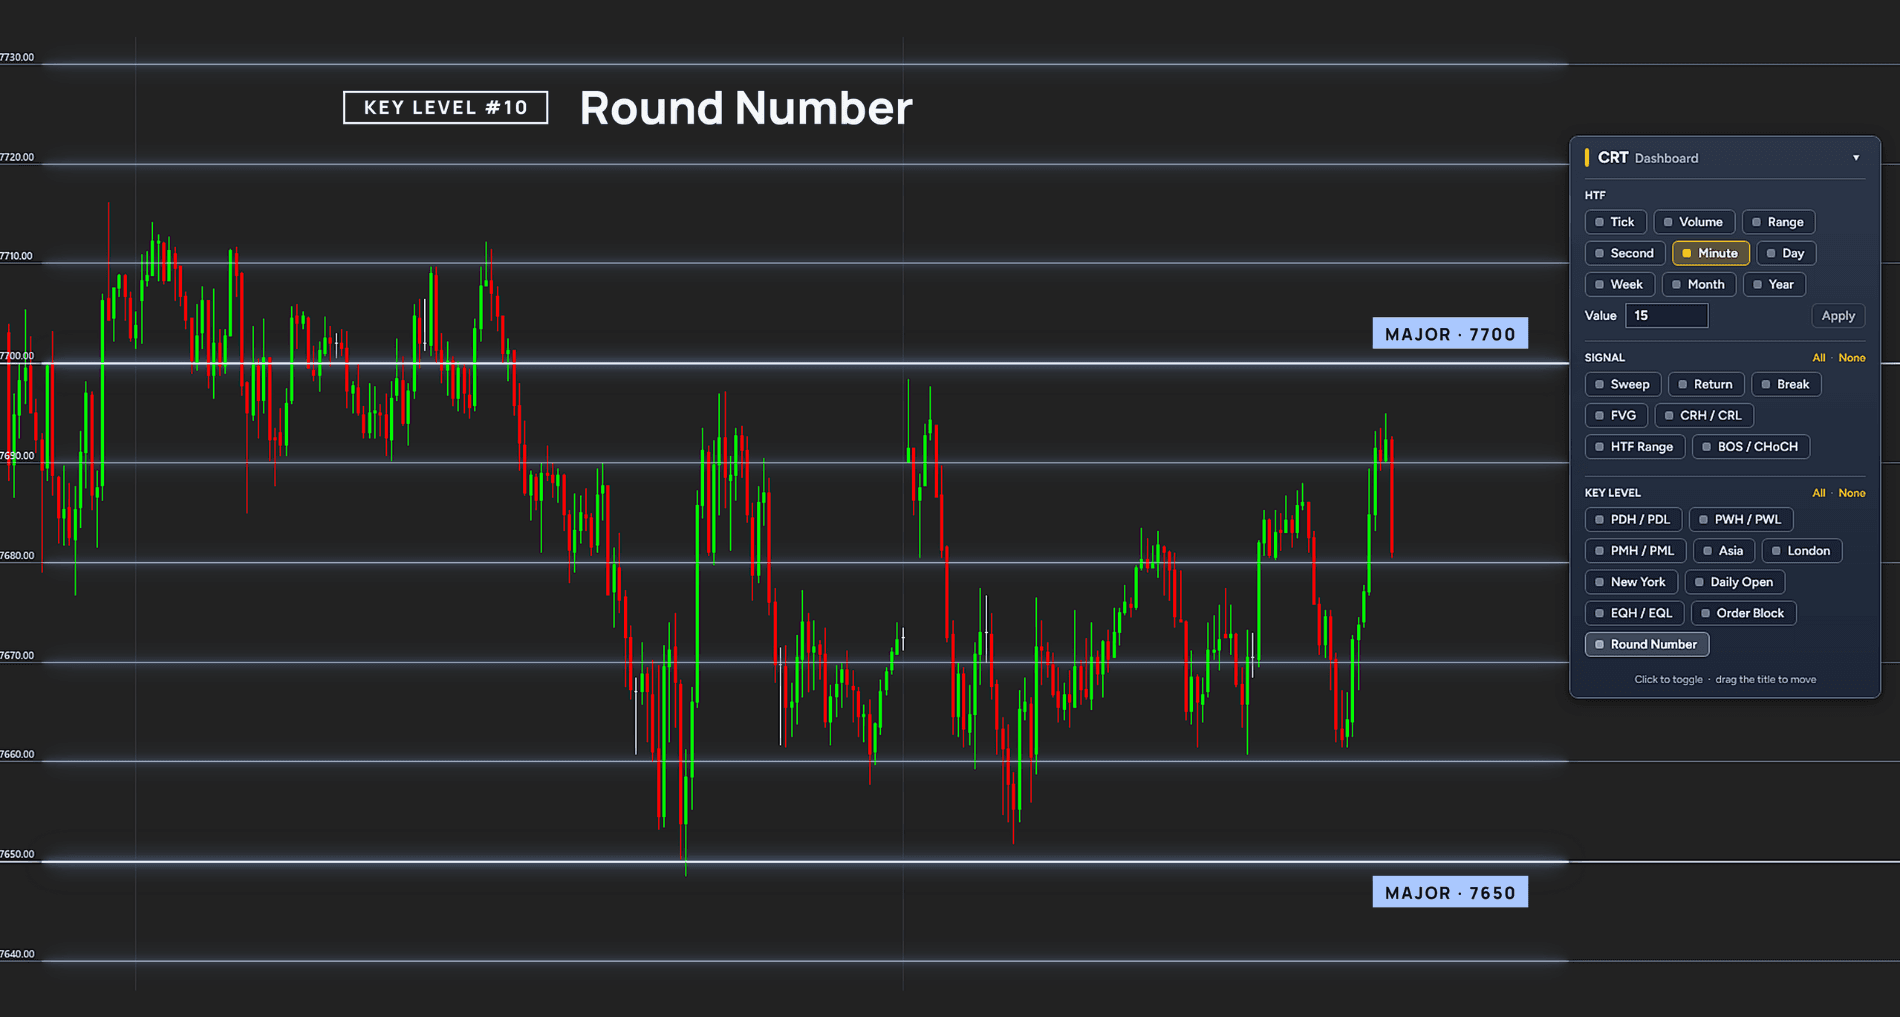
Round Numbers: Psychological price levels that traders often monitor.
Use CRT Alpha's automated HTF candle tracking to assess whether the market favors Long or Short opportunities, helping you avoid trading against the broader market direction.
Let CRT Alpha identify potential Sweeps and Breakouts so you can better recognize reversal and continuation opportunities instead of chasing breakouts at highs or panic-selling near lows.
Track HTF candle development and CRT setups to stay patient during liquidity sweeps and position yourself to capture stronger directional moves as price enters the Expansion phase.
Keep HTF candle structure and key market levels in view to put short-term price fluctuations into a broader context, helping you avoid reacting to every market movement.
Use opposite range boundaries and untapped Equal Highs/Lows as profit targets, with stop-loss levels placed beyond the sweep wick.
Combine CRT analysis with integrated SMC/ICT tools to evaluate market structure, Order Blocks, Fair Value Gaps, and liquidity levels - giving you more context to assess potential trading opportunities.
Explore 3 popular trading approaches through real chart examples. Learn how SMC, ICT, and CRT differ, where they overlap, and how they can complement each other in your market analysis.
In this video, James Buchman explores CRT trade setups, entry confirmation, and higher-timeframe analysis. A live market demonstration shows how he evaluates a sudden shift from bullish momentum to a bearish sell-off.
Explore CRT Alpha across real trading sessions, including liquidity sweeps, breakout confirmation, FVGs, and market structure analysis.
Live CRT buy setups based on candle range low sweeps and failed breakdowns, with 15-minute context, support and resistance, and risk management.
A live bearish CRT trade with liquidity sweeps, FVG, CHoCH, BOS, and risk management.
2 live CRT trades using breakout strength, market structure, measured moves, and stop adjustments. The session ends with 354 ticks across 2 trades.
A live CRT sell trade with Order Block confluence, FVG, sweep, CHoCH/BOS confirmation, and risk management. The session ends with 600 ticks across 2 contracts.
Watch 2 CRT sell setups using Order Blocks, FVGs, sweeps, and BOS confirmation, with scaling entries, 2 profit targets, stop-loss placement, and position sizing. The first trade closes in profit.
In this video, we walk through 18 live trades using CRT Alpha's Sweep signals, explore entry filtering with Renko reversal bricks, and discuss how market conditions influence trading decisions.
CRT Alpha helps you identify potential trading opportunities. Pair it with powerful automation systems to turn your market analysis into a more systematic trading workflow.
From CRT signals to disciplined trade execution
Combine CRT Alpha's market insights with rule-based automation to execute trades, manage positions, and control risk more consistently.
Best for: Traders who want to automate execution and risk management around their CRT trading approach.
Turn CRT insights into multi-layer trading strategies
Combine CRT Alpha's market analysis with a flexible no-code strategy builder to develop and automate more sophisticated trading logic.
Best for: Traders who want to build and automate advanced, multi-condition CRT trading strategies without coding.
Not at all. In fact, CRT Alpha can make learning CRT much more straightforward.
Learning CRT on your own means identifying reference candles, drawing CRH/CRL levels, and figuring out whether price is sweeping or breaking out.
CRT Alpha handles all of this directly on your chart, displaying HTF candles, CRH, CRL, the 50% midpoint, and setup-based candle coloring. Everything becomes more visual and easier to follow, so you can understand CRT faster by observing how price behaves in live markets.
You also have 30 days to make sure CRT Alpha is right for you, with the option to exchange it for another indicator.
Yes. CRT Alpha offers 4 types of setups: Sweep, FVG, Return, and Break, covering a range of market conditions, from potential reversals and failed breakouts to trend continuation.
It also works effectively across all bar types, giving you the flexibility to choose the bar type and timeframe that best fit your trading approach, whether you scalp, day trade, or swing trade.
Plus, CRT Alpha comes with a detailed user manual, video tutorials, and live trading videos that walk you through the indicator's features and demonstrate how to apply it in real market conditions.
You absolutely can, and many traders start that way.
But in live markets, manual CRT analysis means constantly tracking reference candles, marking CRH/CRL, filtering out weak-bodied candles, distinguishing Sweeps from Breakouts, waiting for lower-timeframe confirmation, and checking the SMC/ICT context, all while price keeps moving.
That’s where mistakes, missed setups, and hesitation can creep in. CRT Alpha automates the monitoring and detection process, bringing greater consistency to how you identify CRT setups.
And you won't be left to figure things out on your own.
Our customer care team is ready to assist you via email or a remote session whenever needed, with a response to your support request within 24 hours.
That's true. There are many free CRT tools available, and they can be useful for basic chart analysis.
But most free CRT indicators stop at drawing candle ranges and marking Sweeps. CRT Alpha goes further by detecting four distinct setups, each with its own confirmation logic.
It also applies a minimum 50% candle-body requirement, scores Order Blocks from 0 to 3, detects EQH/EQL using ATR-based tolerance, and tracks BOS/CHoCH, trading sessions, and key price levels, all within one integrated workflow.
Choosing CRT Alpha doesn't mean you're locked into that choice. You have 30 days to exchange it for another indicator if you find a better fit.
2 of our newest November releases. 2 essential aspects of trading. One complete collection.

Automatically identifies 4 actionable CRT trading scenarios and integrates powerful SMC/ICT tools to help you recognize setups and better understand market structure.
Automates stop trailing, one-click break-even, and high-risk reversal alerts, so you can stay focused on price action instead of constantly managing your stops.
Get Sideways Filter as an exclusive bonus to help identify noisy market conditions before evaluating reversals.
Better market analysis. Smarter risk management. One collection.
As one of NINZA's newest releases, CRT Alpha arrives during Black November, our largest event of the year.
CRT Alpha and selected combinations are available below standard pricing, with an additional 20% reduction applied automatically.
The investments below already reflect both reductions.
A complete CRT analysis environment
Your Black November investment: $240
Identify supply and demand zones to complement CRT analysis
Your Black November investment: $360
Automate trade execution, exits, and risk controls
Your Black November investment: $760
Build and automate multi-layer strategies without coding
Your Black November investment: $800
Evaluate CRT Alpha with your preferred markets, timeframes, and analytical approach.
If you find that it is not the right fit, NINZA's 30-day product exchange program allows eligible customers to switch to another qualifying product at no additional cost or for a small fee, depending on the exchange terms.

CRT provides a framework for understanding price around higher timeframe candle ranges.
CRT Alpha makes that framework easier to apply, combining automated range tracking, 4 defined setups, and integrated SMC/ICT analysis in one place.
Understand the range. Recognize the setup. Evaluate the confirmation.
Make CRT analysis a more structured part of your trading workflow.
_1787026707358.svg)
NINZA is an official member of NinjaTrader Ecosystem together with 600+ industry-leading professionals that provide traders with quality trading products & services.




even more payment methods
Quick Links
Instructions
Support
Resources & Information
© Copyright 2026 All Rights Reserved



Because software products may be copied and stored easily, we will NOT issue refunds of any kind. ALL SALES ARE FINAL & NON-REFUNDABLE!
Futures, foreign currency, and options trading contains substantial risk and is not for every investor. An investor could potentially lose all or more than the initial investment. Risk capital is money that can be lost without jeopardizing one's financial security or lifestyle. Only risk capital should be used for trading and only those with sufficient risk capital should consider trading. Past performance is not necessarily indicative of future results.
Hypothetical performance results have many inherent limitations, some of which are described below. No representation is being made that any account will or is likely to achieve profits or losses similar to those shown; in fact, there are frequently sharp differences between hypothetical performance results and the actual results subsequently achieved by any particular trading program. One of the limitations of hypothetical performance results is that they are generally prepared with the benefit of hindsight. In addition, hypothetical trading does not involve financial risk, and no hypothetical trading record can completely account for the impact of financial risk of actual trading. For example, the ability to withstand losses or to adhere to a particular trading program in spite of trading losses are material points which can also adversely affect actual trading results. There are numerous other factors related to the markets in general or to the implementation of any specific trading program which cannot be fully accounted for in the preparation of hypothetical performance results and all which can adversely affect trading results.
NinjaTrader® is a registered trademark of NinjaTrader Group, LLC. No NinjaTrader company has any affiliation with the owner, developer, or provider of the products or services described herein, or any interest, ownership or otherwise, in any such product or service, or endorses, recommends or approves any such product or service.