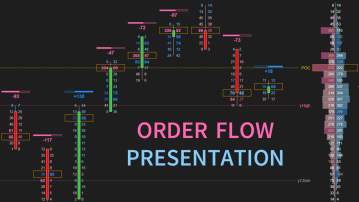
Trading volume quantifies the extent of transactions involving a particular financial asset within a specific timeframe. In the case of stocks, volume is gauged by the number of shares traded, while for futures and options, it reflects the number of contracts changing hands. Traders utilize volume to assess liquidity, integrating changes in volume with technical indicators to inform their trading decisions.
Analyzing volume patterns over time provides insights into the strength of conviction behind upward and downward movements in individual stocks and broader markets. Options traders similarly rely on trading volume as an indicator of an option's current interest. Notably, volume assumes a crucial role in technical analysis, holding a prominent position among key technical indicators.
The Significance of High and Low Volume in Stock Trading
Importance of High Volume: High volume serves as a key indicator of heightened interest in a particular stock, reflecting the active participation of both buyers and sellers. In an uptrend, when volume increases concurrently with the rising trend, it signals a continuation of upward momentum. This suggests a sustained interest from buyers, indicating that the stock is likely to keep ascending. Conversely, in a downtrend, an increase in volume aligning with the downward movement indicates a continuation of the bearish trend. This signifies an increased interest from sellers, suggesting that the stock is likely to keep descending. A practical illustration of this relationship is evident in the daily chart analysis of Reliance Ltd., where rising volumes correspond to changes in stock prices.
Importance of Low Volume: Conversely, low volume implies a lack of enthusiasm or interest in a specific stock. When a stock is advancing, and volume is declining, it signals a reduction in buyer interest, hinting at a potential reversal of the uptrend. Similarly, when a stock is declining, and volume is decreasing, it indicates a waning interest from sellers, suggesting a potential reversal of the downtrend. The table below summarizes the expected outcomes based on the relationship between price and volume:
*Key takeaway:
● When both the price and volume go up, it's a bullish sign, showing strong buying interest.
● If the price goes up but the volume goes down, be cautious as it might mean inexperienced buyers are getting in, and the uptrend could be shaky.
● On the flip side, if prices are dropping with more trading activity (higher volume), it's a bearish sign, suggesting strong selling interest and a likely continued drop.
● When both the price and volume are decreasing, be cautious again, as inexperienced sellers might be at play, possibly causing a turnaround in the downtrend.
Different Kinds of Volume Indicators
1. On-Balance Volume (OBV): On-Balance Volume (OBV) is a cumulative indicator that gauges buying and selling pressure. It adds up volume on up days and subtracts volume on down days. When a stock closes higher than the previous day, all of that day's volume is considered up-volume, and vice versa. The focus is on the direction rather than the value. If both the price and OBV make higher peaks and higher troughs, it signals a likely continuation of an upward trend. Conversely, if both exhibit lower peaks and lower troughs, the downward trend is likely to continue. Divergences, where price and OBV move in opposite directions, can indicate trend reversals.
2. Volume RSI: Volume RSI (Relative Strength Index) is akin to the traditional RSI but incorporates up-volume and down-volume instead of price changes. It oscillates around the 50% centerline in the range from 0 to 100%. Trading signals are derived from crossovers around the 50% line. A reading above 50% is considered bullish, indicating dominant bullish volume, while a reading below 50% is deemed bearish, suggesting bearish volume dominance. Buying is considered when the indicator moves above 50%, and selling is advised when it drops below 50%.
3. Volume Price Trend Indicator: The Volume Price Trend (VPT) indicator determines a stock's price direction and the strength of price change. It consists of a cumulative volume line that adds or subtracts a multiple of the percentage change in a share price’s trend and current volume. Similar to OBV, VPT provides insights into money flow. Interpretations include confirmation of an upward price trend with increased price and volume, confirmation of a downward trend with decreased price and volume, and divergence signals indicating potential reversals.
4. Money Flow Index (MFI): Money Flow Index (MFI) is a comprehensive movement and volume indicator that analyzes both time and price to measure trading pressure. Also known as the volume-weighted Relative Strength Index (RSI), MFI incorporates volume in addition to price. It is calculated using the typical price, raw money flow, money flow ratio, and the MFI formula. Similar to RSI, MFI generates trading signals based on bullish or bearish divergence, crossovers, and overbought or oversold conditions.
Or you can check out robust volume indicators from ninZa.co:


![[Sister Brand] Imbalance Volume Sensor](https://nizaco-media.nyc3.digitaloceanspaces.com/catalog/product/cache/8ff38408075023c595809570dc58e4db/i/m/imbalance_volume_sensor_vesion_1.png)
![[System] SpaceGPS Satellite](https://nizaco-media.nyc3.digitaloceanspaces.com/catalog/product/cache/8ff38408075023c595809570dc58e4db/s/p/spacegps_satellite.png)
![[Package] Deliberate AnaCute Trading](https://nizaco-media.nyc3.digitaloceanspaces.com/catalog/product/cache/8ff38408075023c595809570dc58e4db/_/p/_package_deliberate_anacute.jpg)


