Part of a broad trading intelligence ecosystem comprising 300+ research projects and products.
Trusted by
60,000+ traders
worldwide
Reflected in
700+ verified
5-star reviews
Backed by
12 years of
research & innovation
Evaluate breakout and support/resistance setups in real time using market value and automatic trendline structure
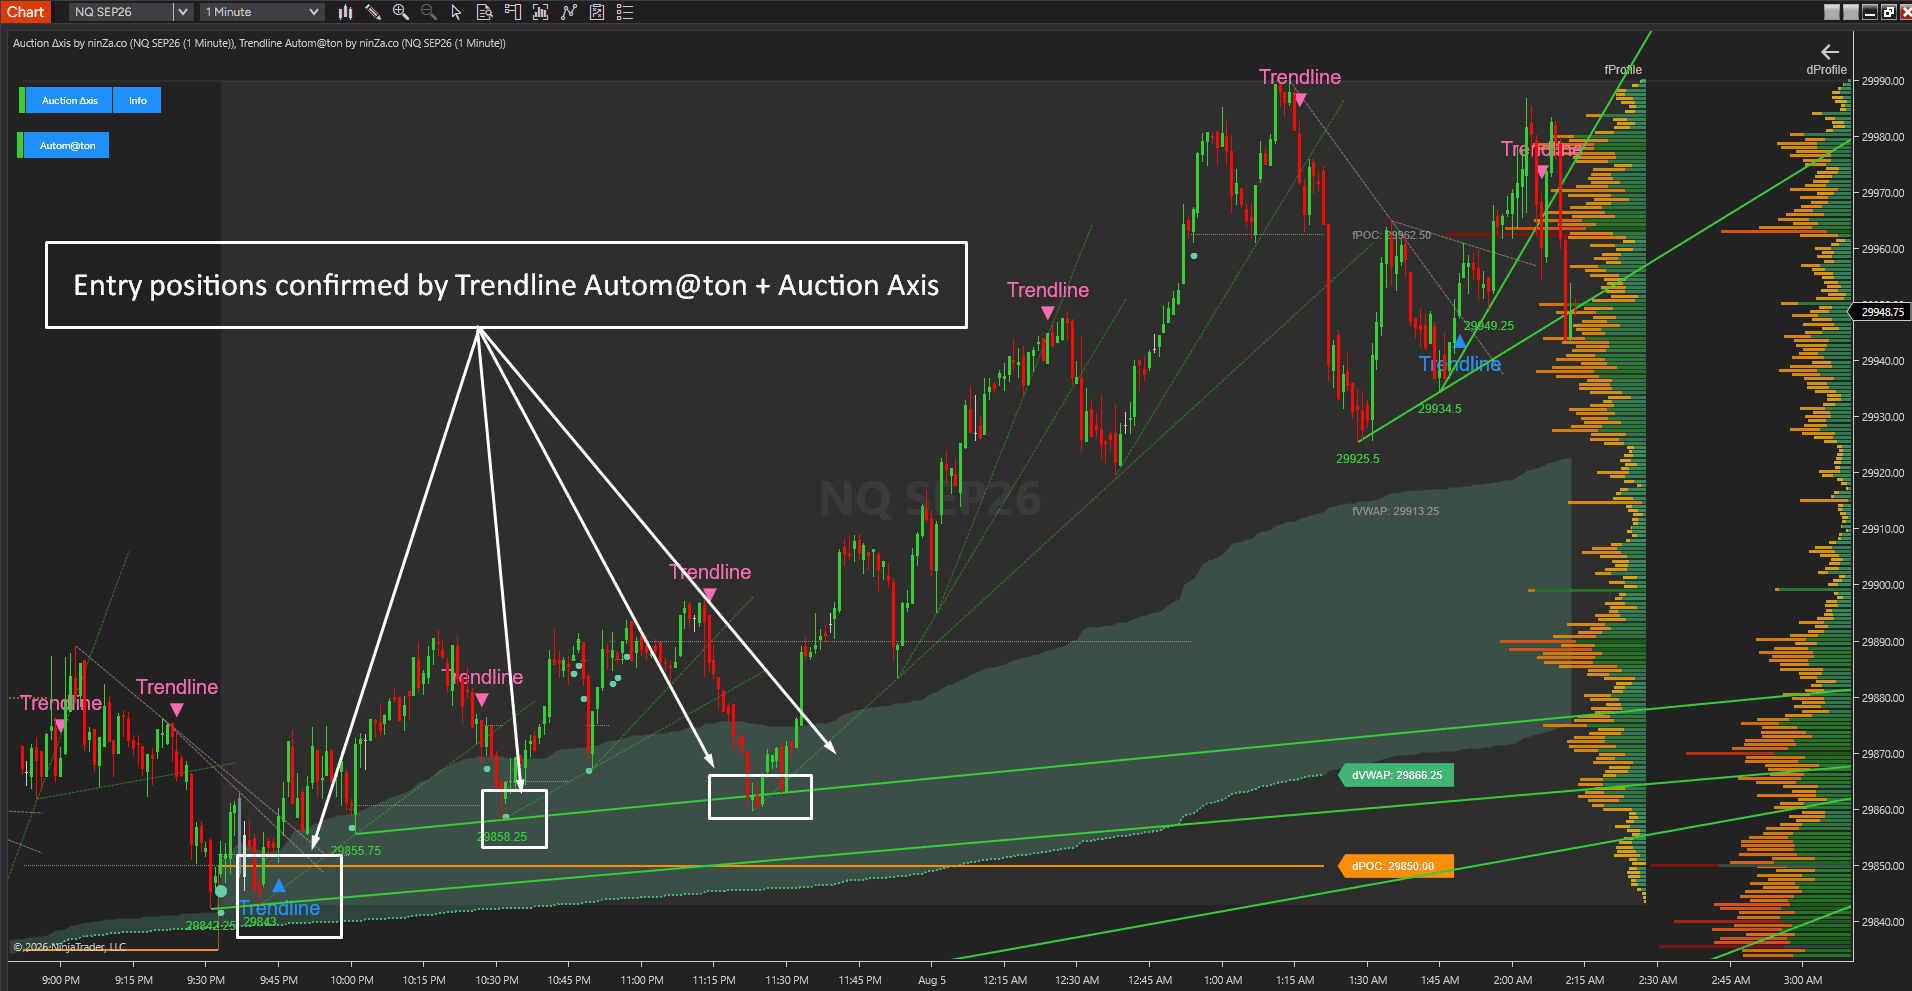
Auction Δxis + Trendline Autom@ton combines a Value-First market framework with automatic trendline analysis, helping intraday traders understand where a setup is forming within market value, where price structure defines support and resistance, and whether a trendline breakout is authentic or a fake move.
Price shows the move, but not the full market context
A breakout can look strong and fail immediately.
A trendline break can appear decisive, then extend right through it as price snaps back.
A support or resistance level can look meaningful on its own, yet shift with every timeframe or indicator setting.
From price alone, these situations can look very similar.
This leaves traders trying to answer several questions while the market is already moving:
Is price reacting from a meaningful market location?
Is value moving higher, lower, or remaining balanced?
Where do the current trendlines define support and resistance?
Is this trendline break authentic, or a fake breakout?
Does the breakout align with where value is trading?
The challenge is not a lack of information. It is the lack of a structured connection between market location, price structure, and confirmed breakout.
A value-to-structure trading framework
Auction Δxis and Trendline Autom@ton form a 2-layer trading intelligence architecture.
Auction Δxis provides the value and location layer. It reveals where market value is developing, where participation is concentrating, and whether price is trading near fair value, at a premium, or at a discount.
Trendline Autom@ton provides the price-structure and breakout layer. It automatically draws trendlines from reliable swing points, highlights support and resistance through trendline concentration, and signals a breakout only when price closes past a trendline – while filtering out fake breakouts as defined by you.
Together, they create a structured workflow for reading the market from value to structure.
A structured value-to-structure workflow
1. Define the market location
Use POC migration, VWAP-based value zones, and volume distribution to understand where price is trading relative to accepted market value.
This helps identify fair value, premium, discount, and Objective Support & Resistance areas derived from actual market participation.
2. Recognize the market condition
Determine whether value is concentrating, migrating, or beginning to expand away from balance.
Price–VWAP–POC alignment can reveal conditions that often develop before significant market movement, while value migration provides another perspective on the underlying trend.
3. Map the price structure
Use Trendline Autom@ton to automatically draw uptrend and downtrend trendlines from reliable swing points.
Because the indicator allows a limitless number of trendlines, a dense concentration of trendlines highlights the nearest and most solid support/resistance zones for potential price movement.
4. Evaluate the breakout
A breakout signal is generated when price crosses a trendline – a bearish candle closing below an upward trendline, or a bullish candle closing above a downward trendline.
Using user-defined false-breakout detection, if the number of candles closing past the trendline is below your specified threshold, it is treated as a fake breakout, and the trendline continues to extend until an authentic breakout occurs.
5. Connect context with structure
Evaluate trendline breakouts and support/resistance zones around fair value, premium, discount, POC levels, and Objective Support & Resistance.
This helps traders avoid treating every breakout or trendline touch as equally meaningful.
What changes when value and structure are read together
Instead of asking only whether a signal has appeared, traders can evaluate:
Where the setup is forming within market value
Whether the market is balanced, concentrating, or expanding
Where trendlines define the nearest support and resistance
Whether a trendline break is authentic or a fake breakout
Whether the breakout aligns with fair value, premium, discount, or Objective Support & Resistance
The result is a more structured way to evaluate breakout, continuation, and failed-breakout conditions.
Auction Δxis highlights
Objective Support & Resistance derived from Day POC, secondary POC, volume, and value distribution
Price–VWAP–POC alignment for identifying value concentration
POC and VWAP-based value migration tracking
Real-time view of fair value, premium, and discount
Automated volume profiles that update as POC develops and consolidates
Trendline Autom@ton highlights
Automatic trendline drawing that adapts to market changes with precision
2 modes for swing point identification: Base on Neighborhood (single timeframe, by range of candle count) and Base on Swing Length (multi-timeframe, by change in Tick/ATR, consistent across timeframe changes)
Uptrend trendlines from adjacent Bottom and Higher Bottom swing points; downtrend trendlines from adjacent Top and Lower Top swing points
Breakout signals when a candle closes past a trendline (bearish below an upward trendline, bullish above a downward trendline)
User-defined false-breakout detection: trendlines resist breaking on false signals and extend until an authentic breakout occurs as specified by you
Limitless trendline count, where a dense concentration of trendlines signifies solid support/resistance zones
User-friendly interface with distinct Uptrend/Downtrend colors, Active/Inactive trendlines, and an Instance button to toggle visibility
Dedicated NinjaScript Signal (Signal_Trade: 1 = bullish, -1 = bearish, 0 = no signal)
2 intelligence layers, 1 market context
Auction Δxis answers: Where is the activity occurring within the market's evolving value structure?
Trendline Autom@ton answers: Where does price structure define support and resistance, and is the breakout authentic?
Together, they connect auction context with automatic trendline structure, giving traders a more complete framework for evaluating potential market reactions.
Best for
Best for intraday traders who want a structured value-to-structure workflow for evaluating market location, trendline-based support and resistance, and authentic breakout conditions.
Today's offer
Receive both products as one connected market-intelligence framework.
Price during Zaccess program: $375 (supporting traders when it matters most).
Reviewed periodically and may change without notice.
Policies
Software license
Every purchase includes a perpetual software license, granting you the right to use the software indefinitely on the number of computers permitted by your license.
Installation & Onboarding
Every purchase includes guided installation assistance. Purchases with Premium Services also include white-glove software setup and onboarding, along with personalized trading setup and workflow optimization.
Software updates & upgrades
Software updates & upgrades are provided at no additional cost. For products with a modular structure, this coverage applies to the core product, while optional expansion modules may be offered separately. Read the full policy
Customer service
Every purchase includes lifetime support via email & chat, delivered by our renowned Customer Care team – widely recognized throughout the trading community for its world-class service. As your NINZA product collection expands, Premium Path unlocks a growing range of enhanced Customer Care benefits & privileges, available through dedicated channels. Explore Premium Path
Remote assistance
Every purchase includes up to 3 complimentary remote assistance sessions, available within 30 days of purchase – with each session lasting up to 30 minutes. Purchases with Premium Services include up to 6 sessions within 60 days of purchase, with priority scheduling and longer session durations.
Product exchange
Customers may request up to 3 product exchanges within 30 days of purchase, at little or no additional cost when exchanging for a comparable product. Read the full policy
Returns & refunds
Due to the ease with which software products can be stored and copied, no returns will be accepted and no refunds will be issued. ALL SALES ARE FINAL & NON-REFUNDABLE.
Community Perspectives
From individual traders to pros and institutional trading teams... Trusted worldwide! Read traders' thoughts
4.9
Based on 800+ authentic reviews
M.
Indicators Improved My Charts. Hannah's Help And Great Customer Service. Will Buy Again.
I have been using the ninZa.co indicators for several months now and am very happy with what a valuable addition they have been to my charts. I recently decided to add one of the recently released indicators from ninZa.co. But after using for a few days, it wasn’t quite what I had been looking for. I contacted ninZa.co and had the pleasure of working with Hannah for an exchange to a different one of the many available indicators. At the time, the indicator I wanted to purchase to replace the one I had recently bought was on sale. Hannah put through an exchange and without my having to ask, gave me the advantage of the sale price. She also included a pdf that provided education about the indicator I chose to switch to. Any time I have had contact with one of the associates from ninZa.co, I have received excellent customer service, and will not hesitate to purchase from them again.
Bartosz
Grace Goes Above And Beyond: A Customer Support Experience That Exceeds Expectations!
Thank You, Grace! Your support is extraordinary I wish all companies have such great support. Keep going I’m 200% satisfied.
Kari L.
ConnorsRSI Pro With Grace's Outstanding Customer Service
Thank you very much for your excellent customer service, Grace! You are doing an excellent job making customers' lives much easier.
T.
An Exemplary Customer Experience At NinZa.Co: Unveiling The Power Of Cumulative Delta
I'm a new customer with ninZa.co and i was needing help today in making a purchase. I made a request on your chat platform and Hannah came to my rescue. She helped me find the what I needed and even offered me a discount. Everything went very smoothly from that point. I made the purchase and she even provided me some documentation on the indicator. I am very pleased with her assistance. Thanks again Hannah for your excellent customer service !!
Mike W.
Smart Ruler
I use ninZa.co's Smart Ruler every day !!! It is on all charts and helps me a great deal. Smart Ruler is one great tool for NinjaTrader !!!!!!!
A. B.
The indicator is working perfectly
The indicator is working perfectly. You guys are the best - Purchased Smart Zoom + Supply/Demand Discovery
Sandeep Rao
Awesome Indicator And Pi Rocks
This is my story, I ordered the Day Range indicator for NIFTY India. To my dismay, it didn't work well as it calculated ranges in ticks. I asked Larry Pi if there was a workaround, and he created a new version with all the choices for range unit: points, ticks, pips. He was with me all through the process, with very short turnaround cycles. So don't hesitate at all to pick what you want! You won't regret.
J.
Grateful For Excellent Support From Hannah!
Hi Hannah, Thank you for your great support. You got back to me right away, provided links to solve the problem, and they worked great! All is well that ends well, and your kind and more than adequate support ended very well! Thanks.
David P. From Connecticut
- Purchased Supply/Demand Discovery + TDI Pro + Solar Wind + Intraday Adaptive S/R + Ruby River + Market Profile (Daily) + Day Range
Just got your new Supply/Demand Discovery and it is truly a great improvement over everything else on the market. It will take me days to determine the best values for the variables for my different charts, but it will be worth the effort.
Research Domains
Full spectrum of trading intelligence across diverse domains. Explore all domains
Support & Resistance
Find where price may turn or break
Identify key price areas where buying and selling pressure tend to react. Help traders recognize important levels for potential reversals, trend continuation, or breakouts, and plan trades around these key areas.
Analyze price behavior and structure through price movements. Identify trends, momentum, key reaction areas, and meaningful shifts in market behavior to better assess price direction.

![[AbsP] MEO #100: Auction Δxis + Trendline Autom@ton](/_next/image?url=https%3A%2F%2Fforestcms.nyc3.digitaloceanspaces.com%2Fmedia%2Fmedium_Auction%20Axis%20%2B%20Trenline%20Automaton%20avatar_1785925799693.png&w=3840&q=75)


_1787026707358.svg)