BigTrade Sweep maps aggressive buying and selling directly onto your chart, helping you spot concentrated participation, continuation, absorption, and potential market traps in real time.
Detect big trades at micro-tick level, track sudden liquidity surges in real time, and read how price responds to distinguish continuation from liquidity traps.
$275R2BOne-time investment
Zaccess extended through October Use coupon “ZACCESS” for up to 10% purchase assistance on this product’s R2B price. Learn more → https://ninza.co/zaccess
Earn $14 back in Zuture Wallet • Online orders only ✓
Need guidance? Contact sales
Perpetual license
Lifetime support
Free updates
30-day exchange
Earn $14 back in Zuture Wallet • Online orders only ✓
Part of a broad trading intelligence ecosystem comprising 300+ research projects and products.
Trusted by
60,000+ traders
worldwide
Reflected in
700+ verified
5-star reviews
Backed by
12 years of
research & innovation
BigTrade Sweep: Visualize aggressive Order Flow & spot market Traps in real time
Most volume indicators show how much volume traded during a bar.
What they don't show is where that volume entered the market, how aggressively it was executed, or how price responded afterward.
When a large volume spike appears on a traditional histogram, traders are often left with more questions than answers:
Where did the activity actually occur?
Were buyers or sellers driving the move?
Was the volume absorbed or accepted?
Did the move generate follow-through or fail?
Was it the beginning of a continuation move or a trap?
Because traditional charts compress all trading activity into a single candle, much of the underlying order flow remains hidden.
BigTrade Sweep helps uncover that missing layer.
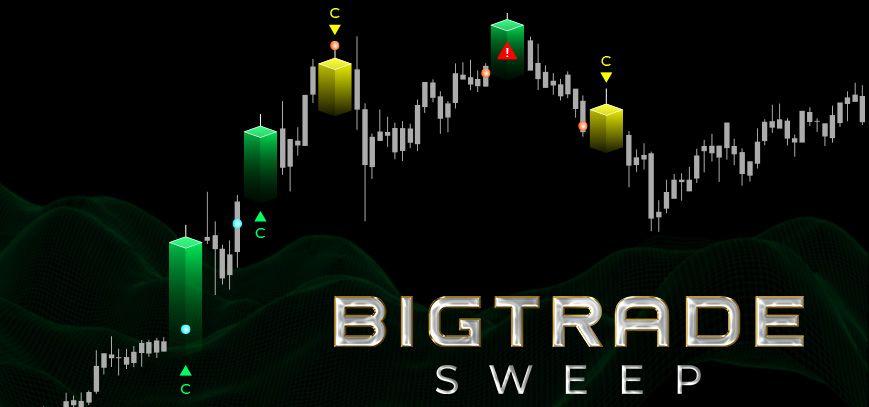
Using tick-by-tick execution data, the indicator identifies unusual bursts of aggressive buying and selling activity and maps them directly onto your chart through Volume Heat Bubbles and rule-based continuation (C) and trap (T) signals.
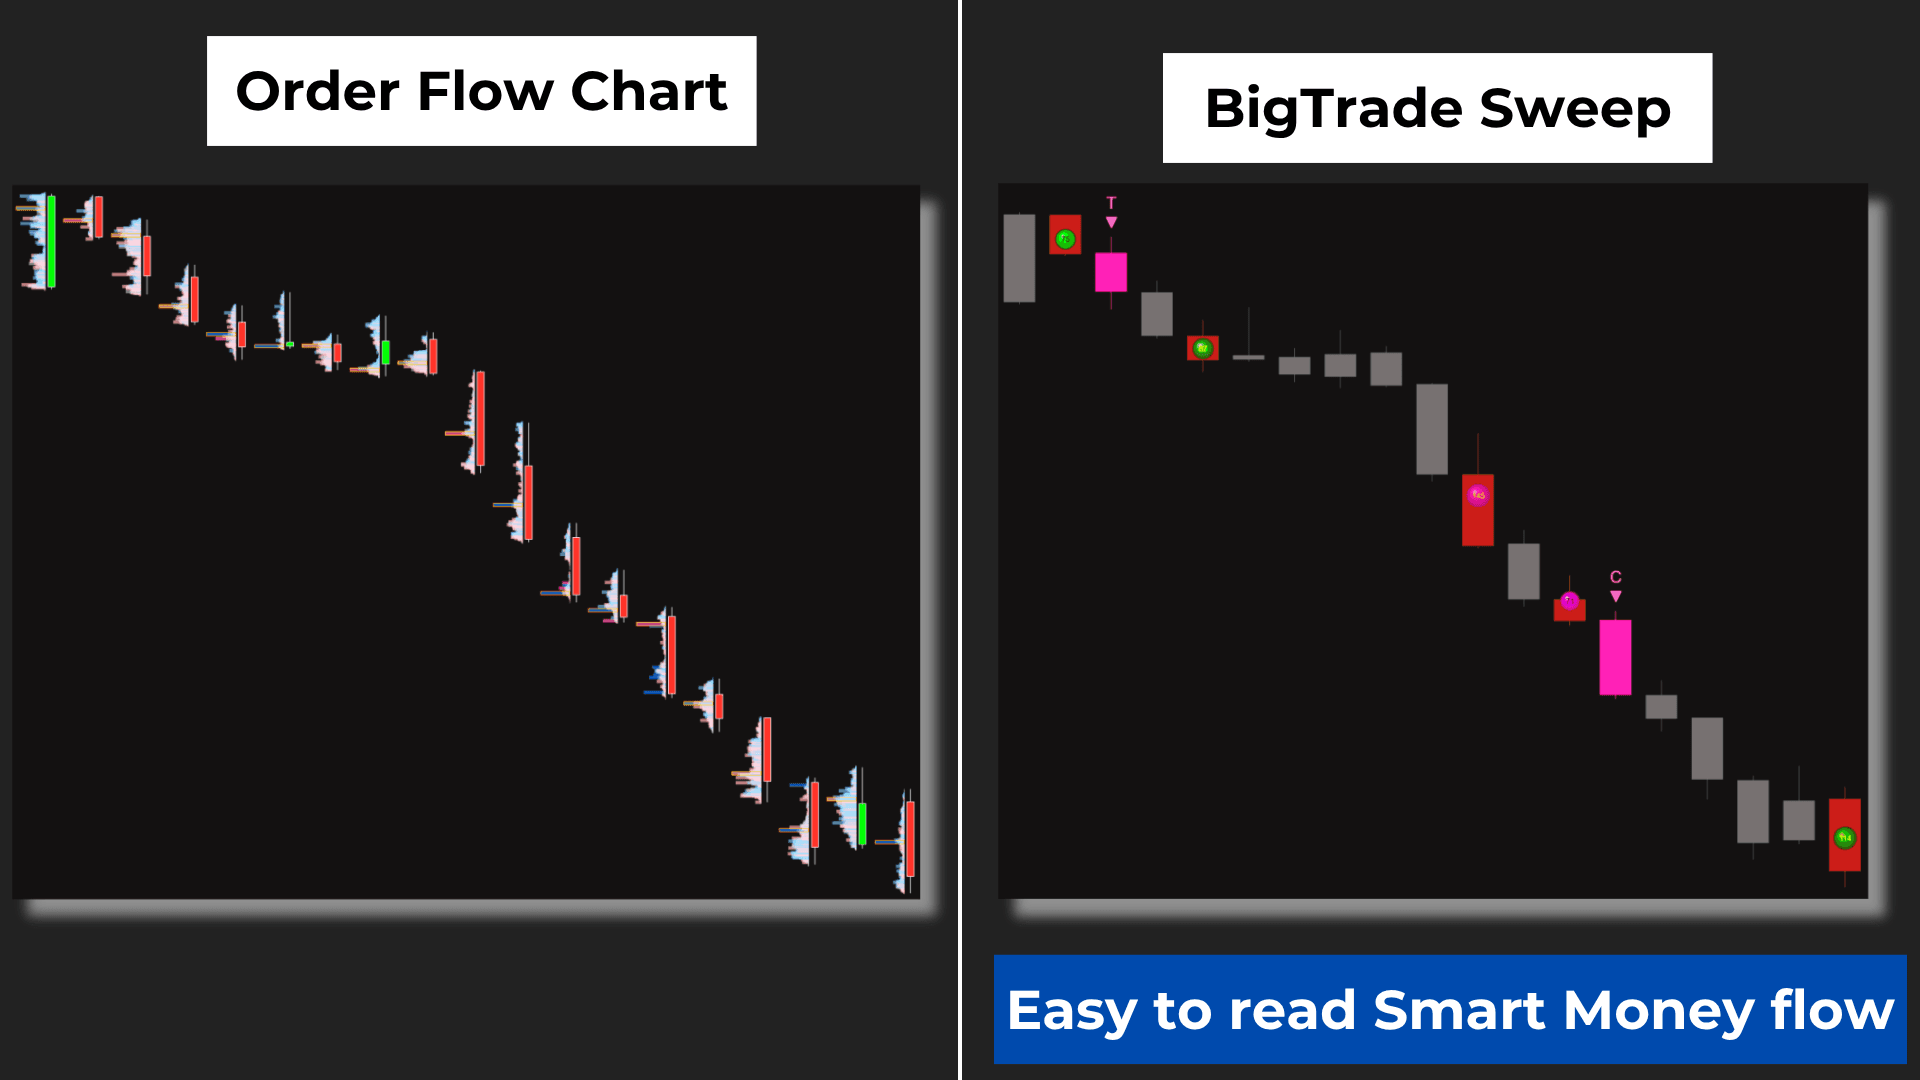
Rather than forcing you to interpret rapidly changing Footprint charts or raw time-and-sales data, BigTrade Sweep highlights the areas that matter most, making it easier to identify meaningful participation and understand how the market responds afterward.
Built on tick-level Order Flow analysis
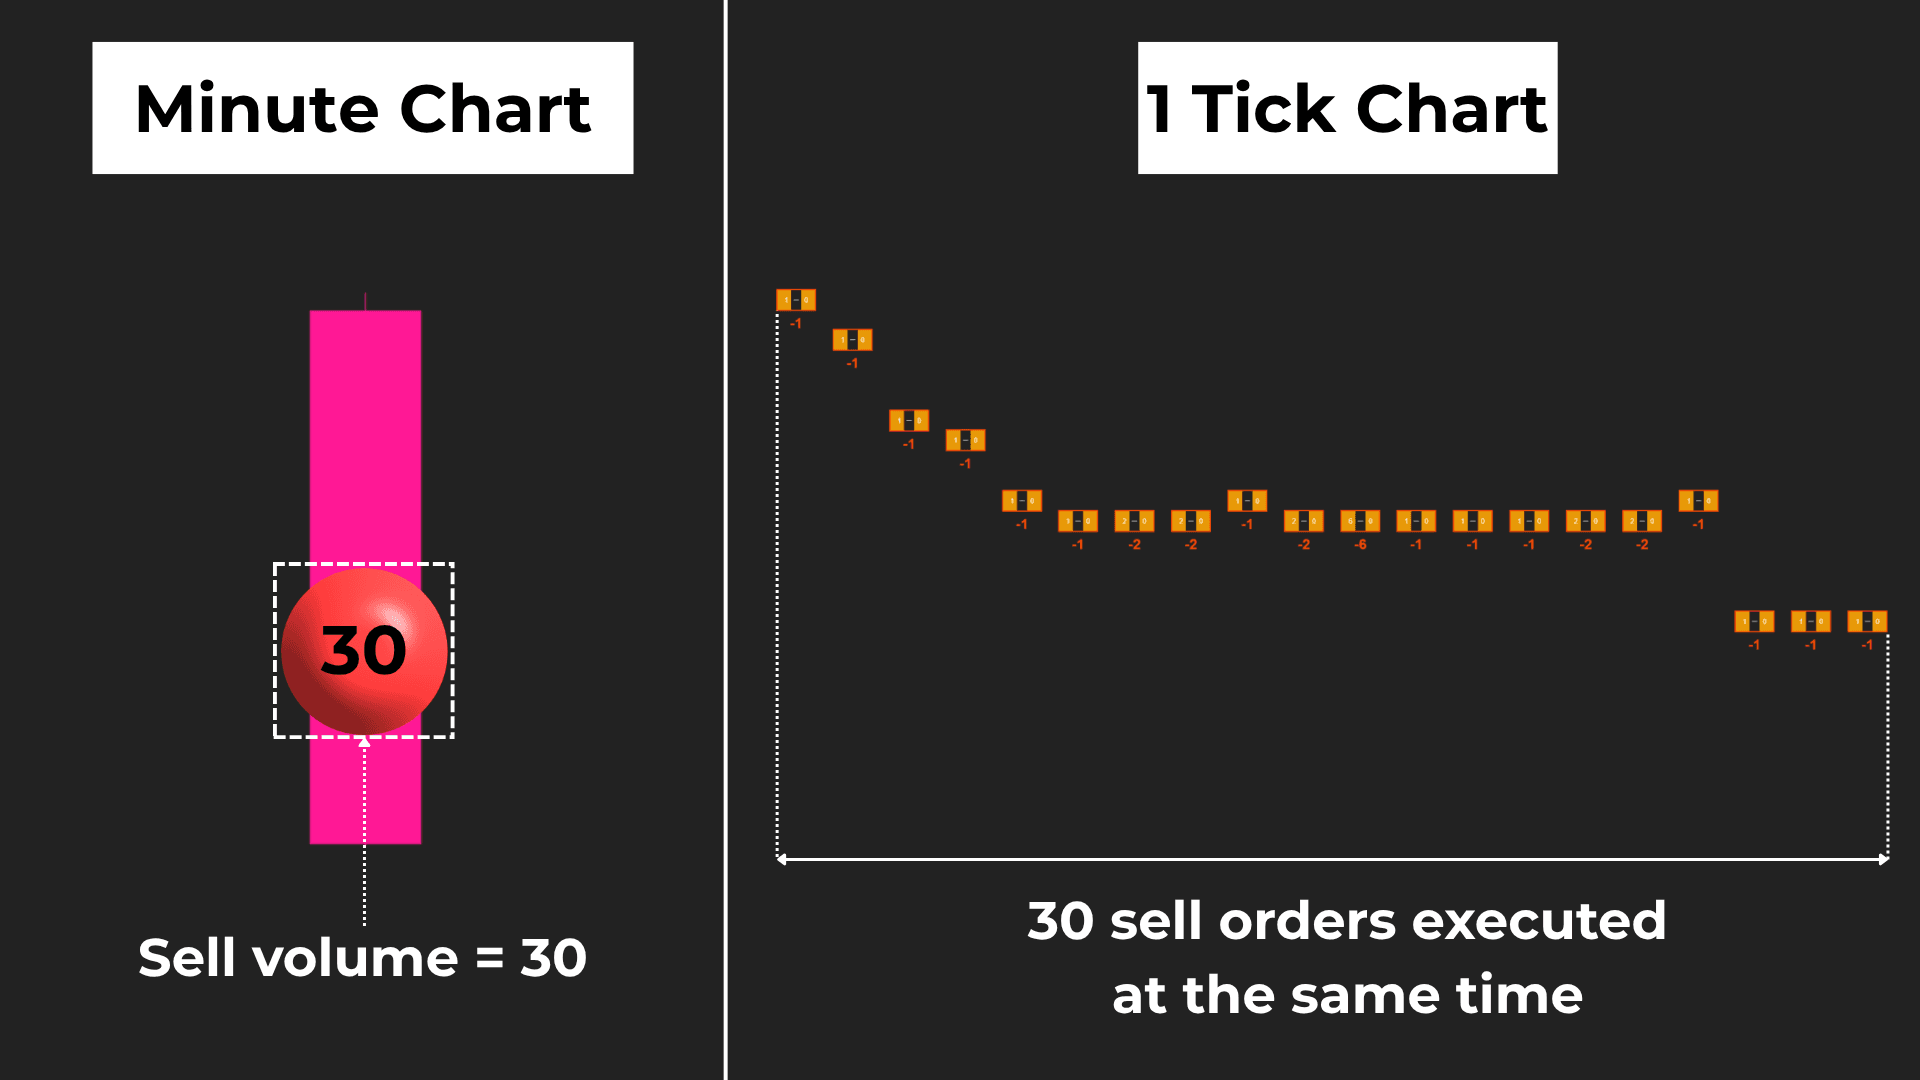
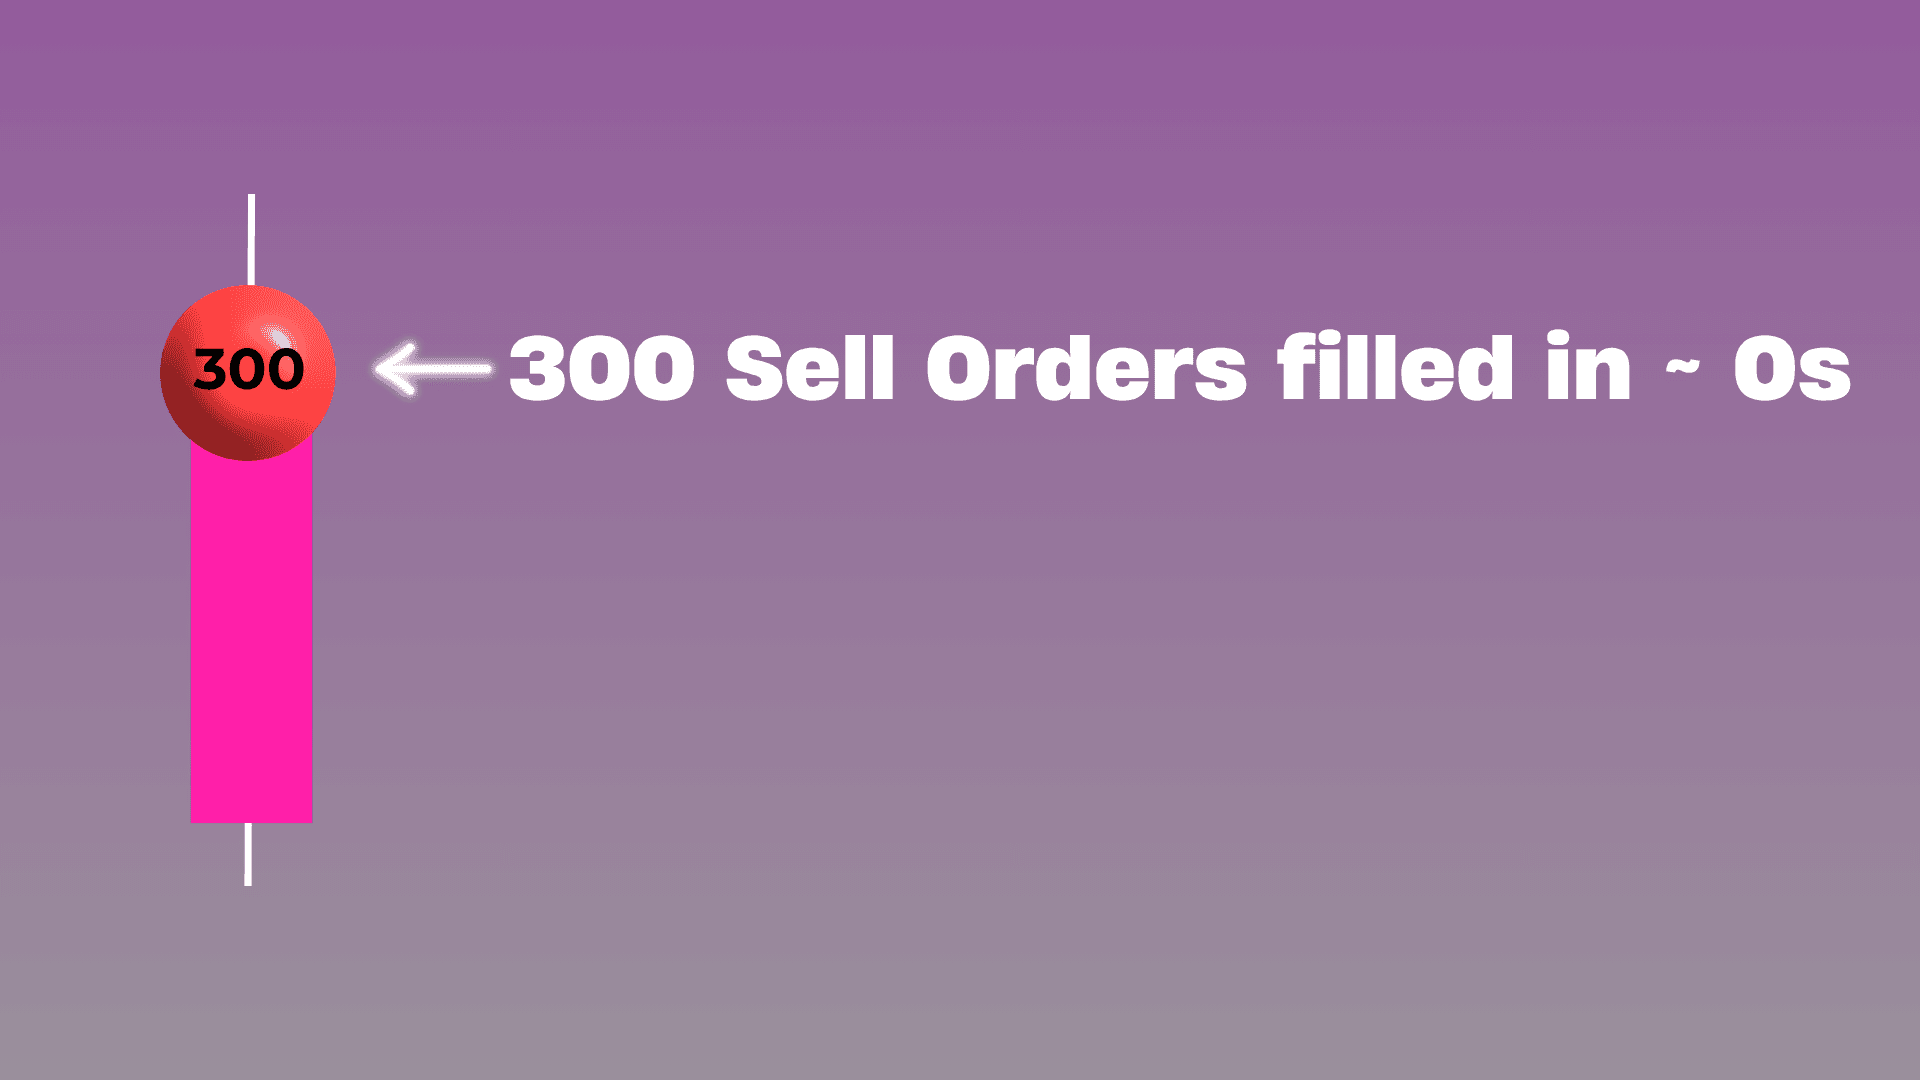
Large market participants rarely reveal their full size through a single trade.
Activity is often distributed across multiple executions, fragmented through algorithms, or hidden within iceberg-style order flow.
Traditional volume studies typically aggregate all of that activity into a single volume total.
BigTrade Sweep analyzes the underlying execution data in real time, monitoring:
Aggressive buying and selling pressure
Execution speed
Order flow imbalances
Concentrated bursts of activity
This helps identify areas where meaningful participation enters the market, even when that activity is distributed across multiple executions rather than appearing as a single block trade.
Volume Heat Bubbles
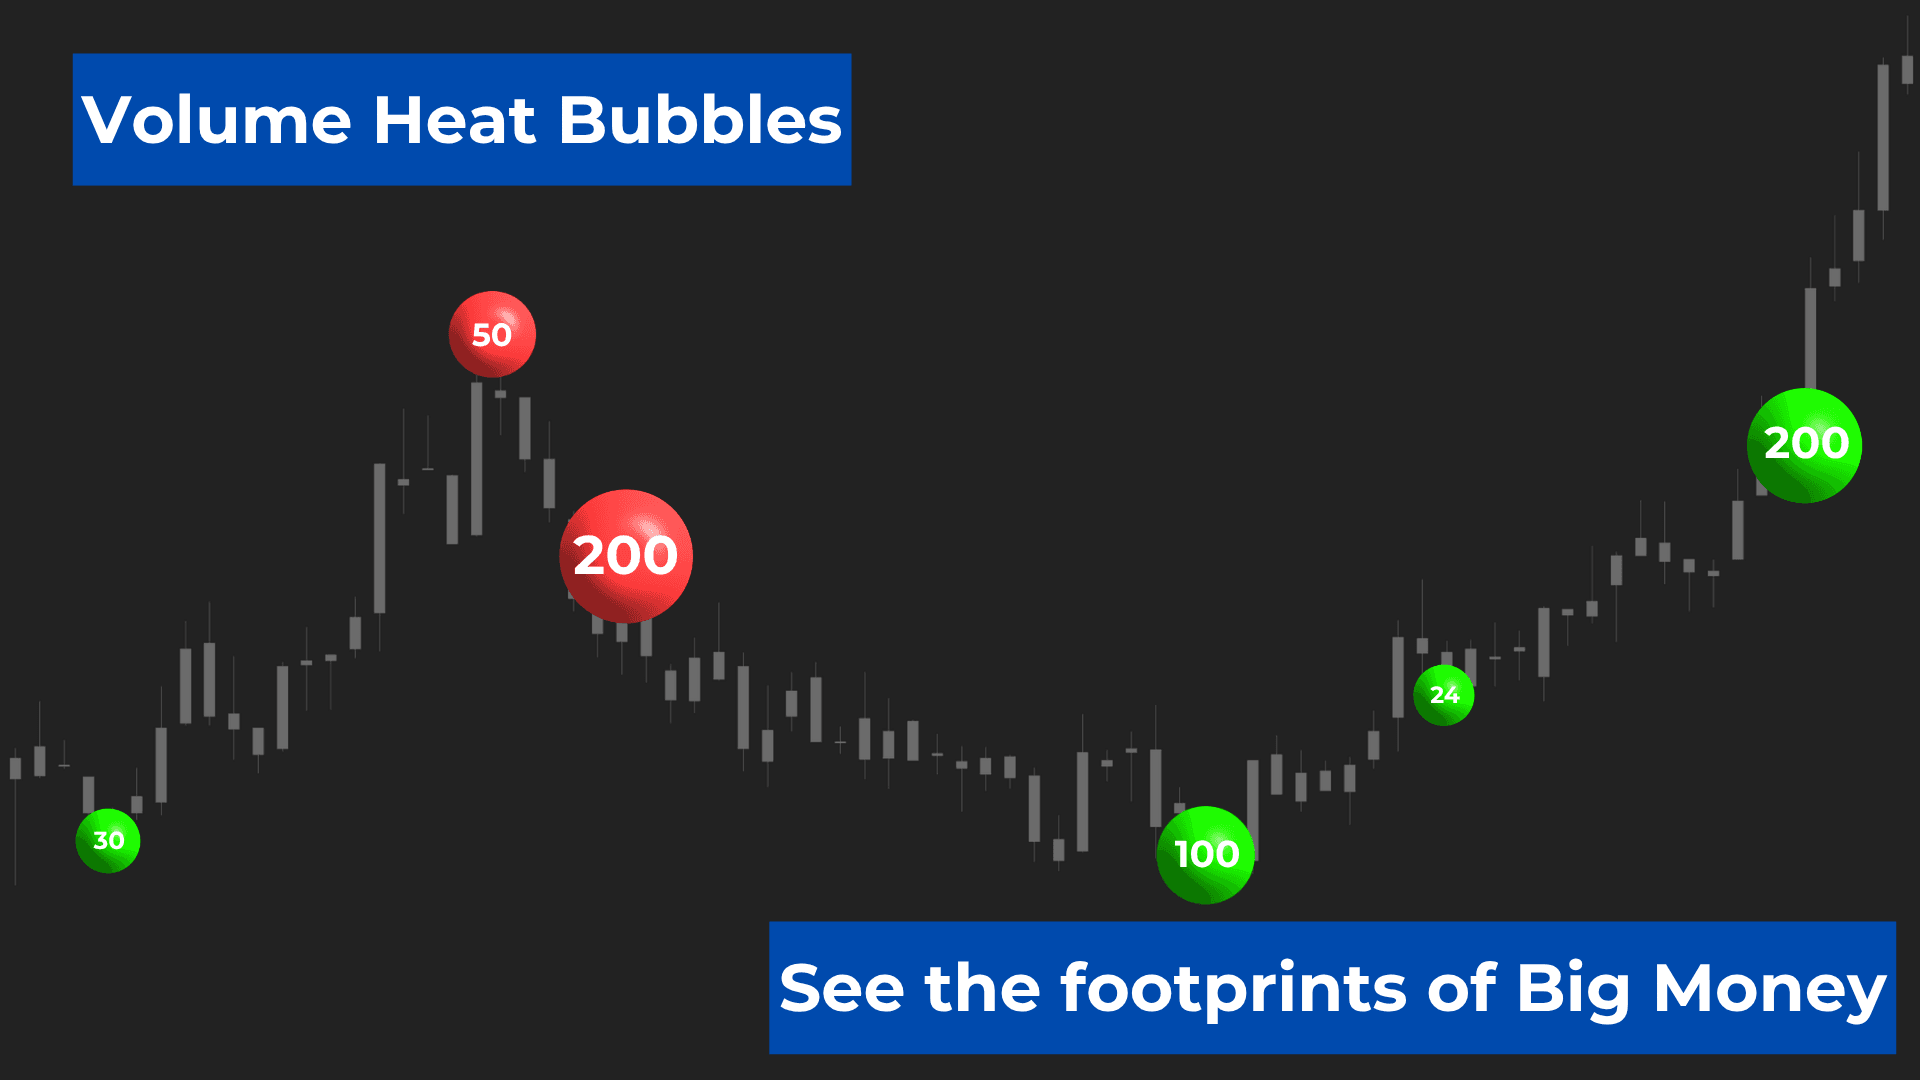
Volume Heat Bubbles are the core visual component of BigTrade Sweep.
Each bubble highlights a price area where unusually large buying or selling activity entered the market within a short period of time.
Instead of requiring you to interpret thousands of changing values within a Footprint chart, BigTrade Sweep displays that information directly on your chart in a clean and intuitive format.
Key features
Green bubbles highlight aggressive buying lifting the offer.
Red bubbles highlight aggressive selling hitting the bid.
Bubble clusters reveal key zones – when multiple bubbles form around the same area, they often identify zones where participation has become highly concentrated.
These areas frequently become important locations for liquidity interactions, market reactions, and potential trading opportunities.
Understanding market response: C & T signals
Large volume alone does not tell the entire story.
What often matters most is how the market responds after that volume enters.
BigTrade Sweep monitors post-volume price behavior and classifies the outcome into 2 distinct signal types.
C signal (Continuation)
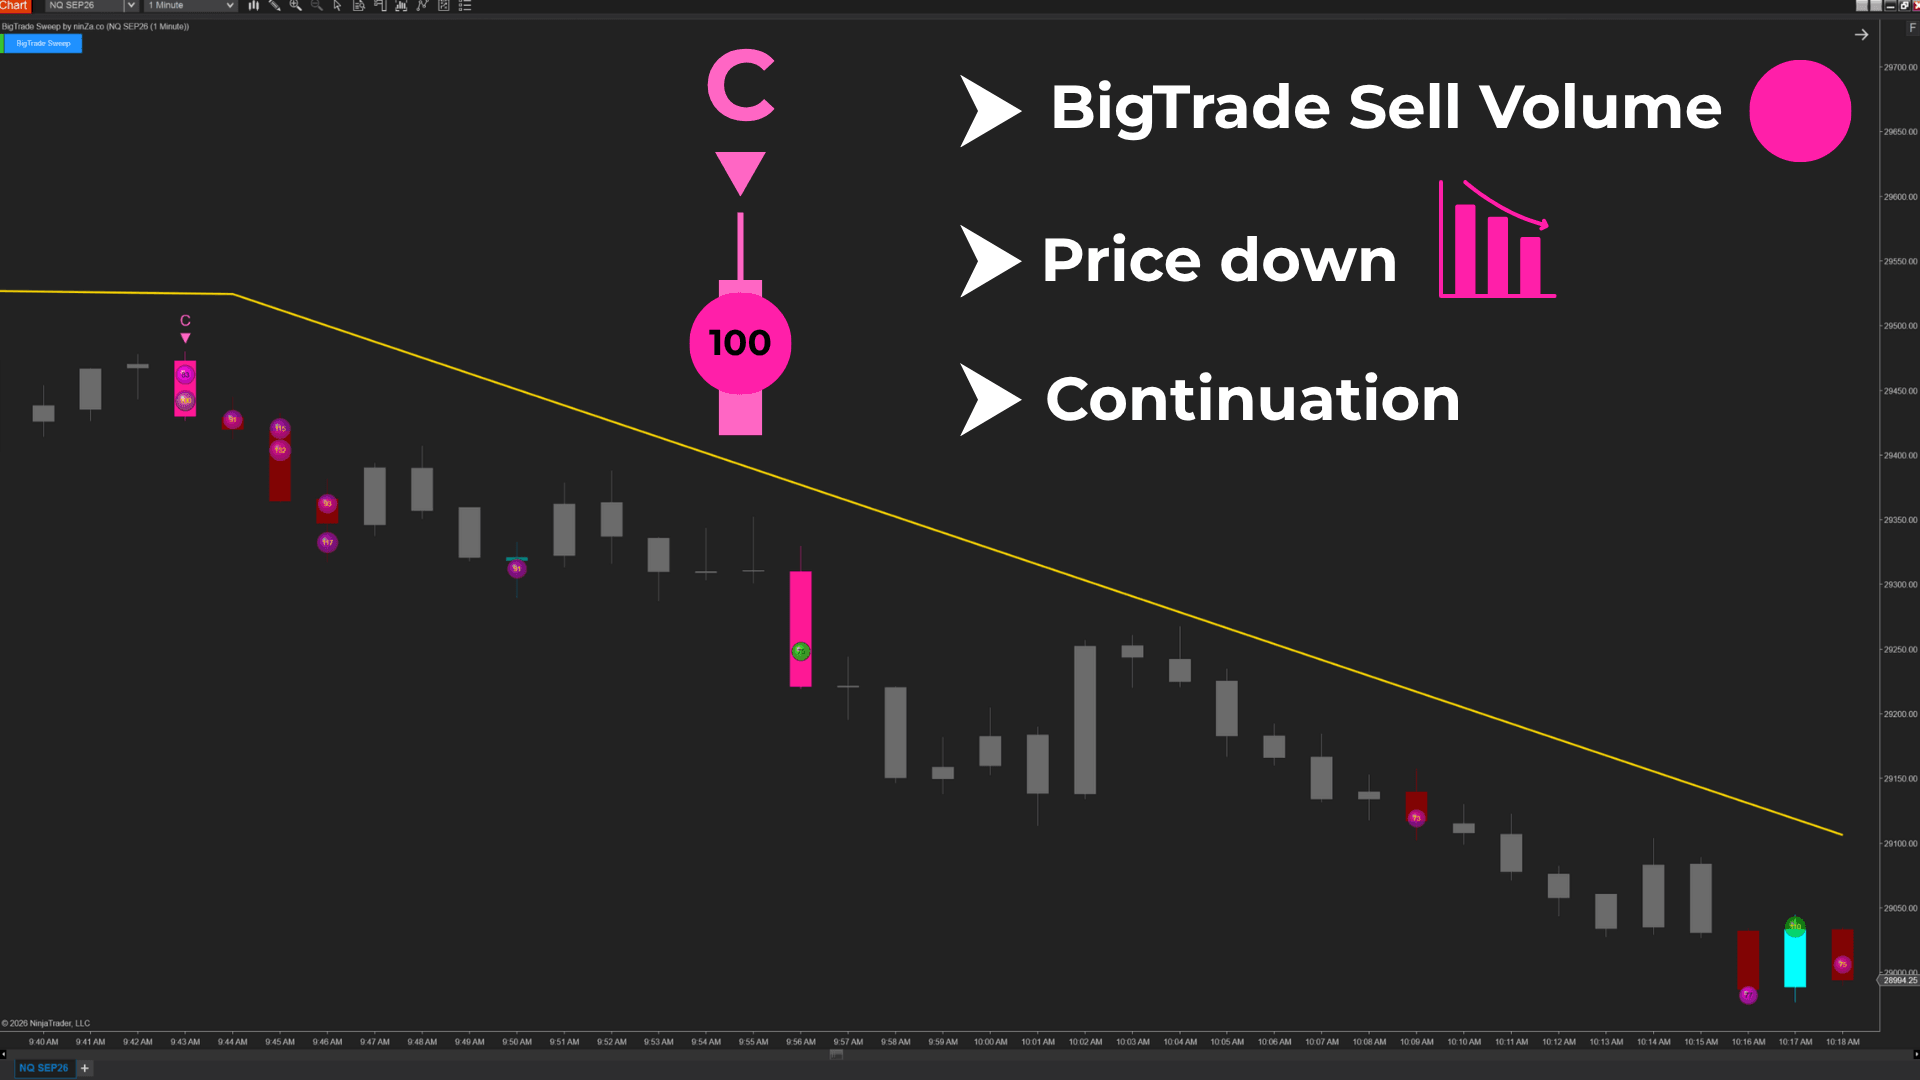
A C signal appears when aggressive buying or selling enters the market and price continues moving in the same direction.
This suggests the initiating side remains active and directional pressure continues to be accepted by the market.
C signals can help you identify situations where order flow and price movement remain aligned.
T signal (Trap)
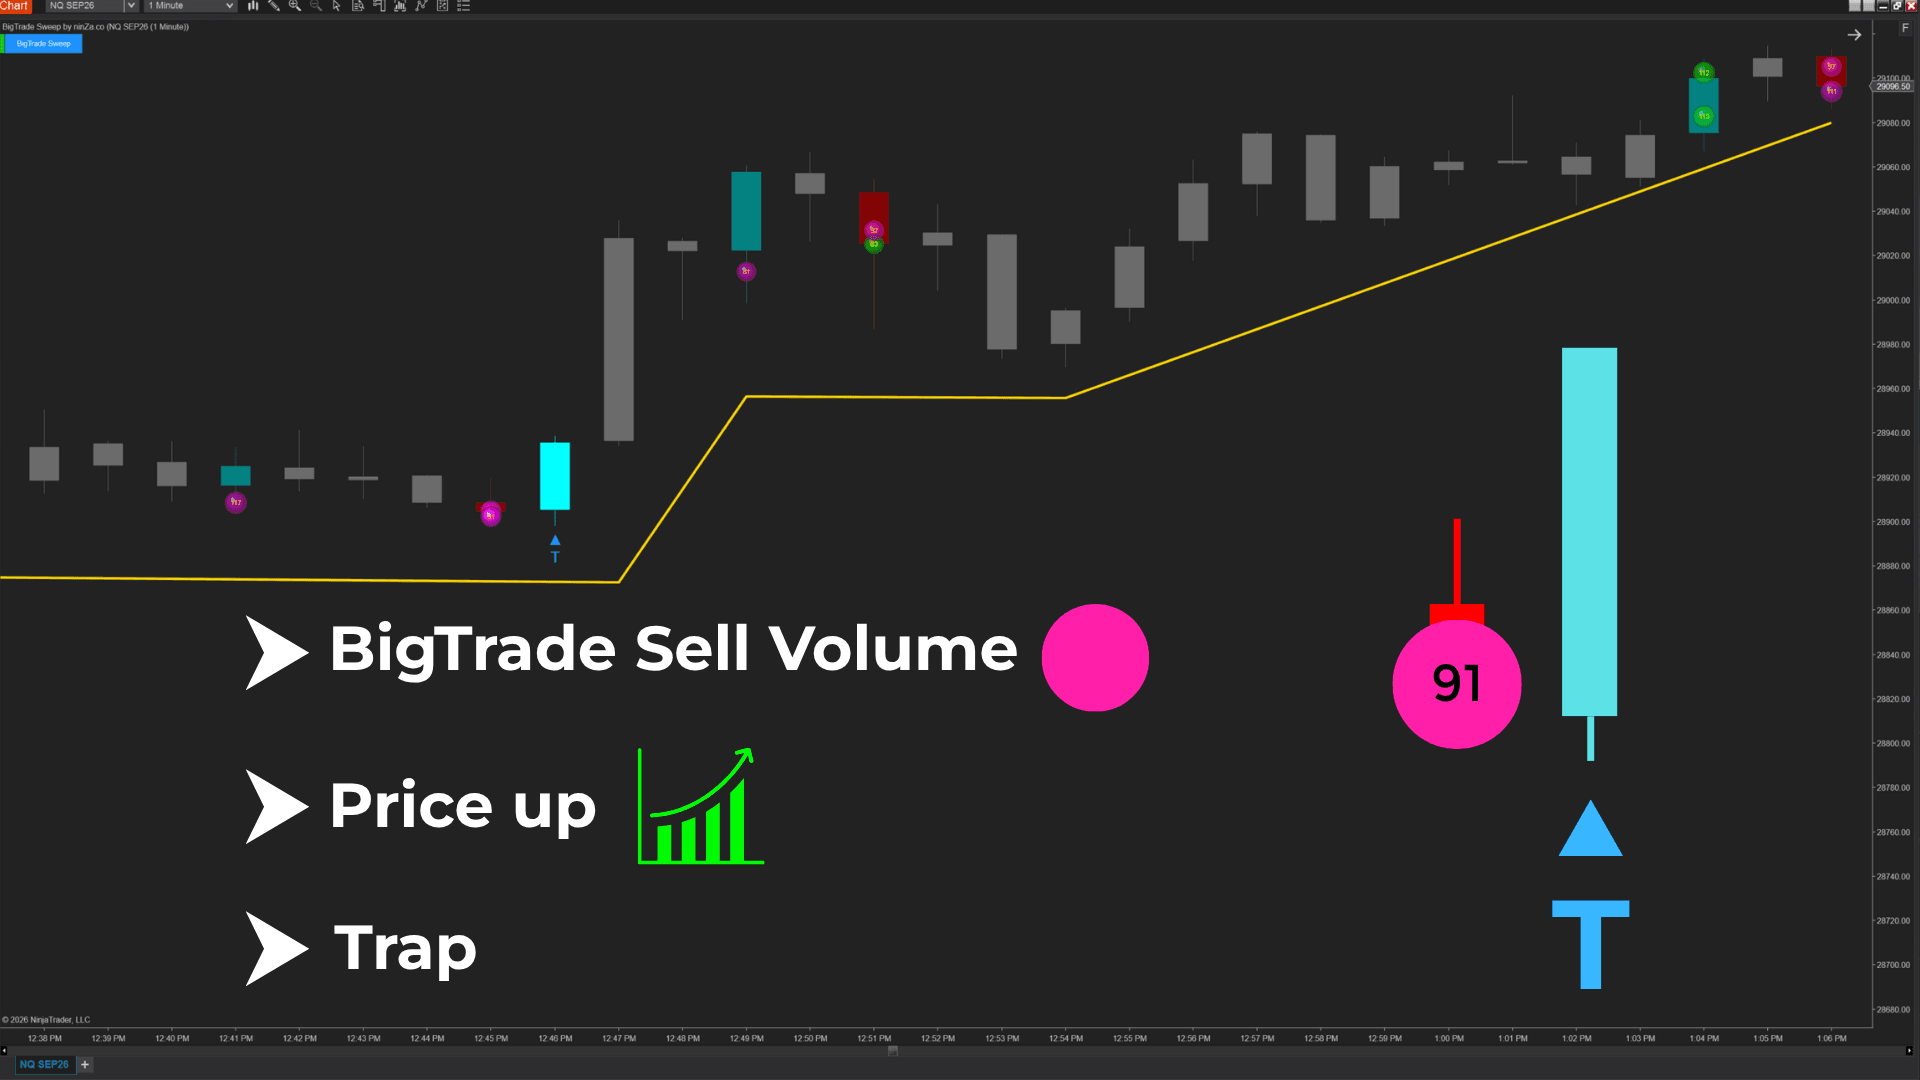
A T signal appears when aggressive volume initially pushes price in one direction but fails to gain acceptance.
Instead, the move is absorbed, rejected, and followed by a reversal.
This often occurs during failed breakouts, exhaustion moves, or liquidity grabs where late participants become trapped on the wrong side of the market.
T signals can help identify potential absorption and trap conditions that may not be immediately apparent from price action alone.
Compatible with multiple chart types
BigTrade Sweep processes raw execution data independently of chart style, making it adaptable to a wide range of trading approaches.
You can use the indicator on:
Minute charts
Tick charts
Renko charts
Range charts
Other commonly used chart formats
Whether your focus is order flow, momentum, market structure, or discretionary price action, BigTrade Sweep can fit into your existing workflow without requiring major changes to your chart setup.
What BigTrade Sweep helps you identify
Areas of unusually high participation
Aggressive buying and selling activity
Volume concentration at specific price levels
Potential continuation following heavy participation
Potential absorption and trap scenarios
Key liquidity zones that may influence future price movement
BigTrade Sweep helps you understand where significant activity entered the market and how price responded afterward, providing additional context for more informed trading decisions.
Watch the indicator in action. Step-by-step guides, live trading, and feature overviews.
Software Changelog
03 Aug 2026:Some graphics functions were improved.
30 Jun 2026:The indicator was released (built new).
16 Jun 2026:A minor issue where some parameters did not have NinjaScript support was fixed.
Policies
Software license
Every purchase includes a perpetual software license, granting you the right to use the software indefinitely on the number of computers permitted by your license.
Installation & Onboarding
Every purchase includes guided installation assistance. Purchases with Premium Services also include white-glove software setup and onboarding, along with personalized trading setup and workflow optimization.
Software updates & upgrades
Software updates & upgrades are provided at no additional cost. For products with a modular structure, this coverage applies to the core product, while optional expansion modules may be offered separately. Read the full policy
Customer service
Every purchase includes lifetime support via email & chat, delivered by our renowned Customer Care team – widely recognized throughout the trading community for its world-class service. As your NINZA product collection expands, Premium Path unlocks a growing range of enhanced Customer Care benefits & privileges, available through dedicated channels. Explore Premium Path
Remote assistance
Every purchase includes up to 3 complimentary remote assistance sessions, available within 30 days of purchase – with each session lasting up to 30 minutes. Purchases with Premium Services include up to 6 sessions within 60 days of purchase, with priority scheduling and longer session durations.
Product exchange
Customers may request up to 3 product exchanges within 30 days of purchase, at little or no additional cost when exchanging for a comparable product. Read the full policy
Returns & refunds
Due to the ease with which software products can be stored and copied, no returns will be accepted and no refunds will be issued. ALL SALES ARE FINAL & NON-REFUNDABLE.
Community perspectives
From individual traders to pros and institutional trading teams... Trusted worldwide! Read traders' thoughts
4.9
Based on 800+ authentic reviews
Christopher Heathman
Grace was AWESOME! taking care of me
I'm totally impressed with the following about ninZa.co service from all of the girls, but Grace is my favorite. Product knowledge and support. Great pricing. Always there to offer advice and get everything setup. Looking forward to using the new software. I'll comeback and write a review.
Samuel Grossman
ninZa.co has excellent customer Service
ninZa.co has excellent customer service. They are very helpful and go above and beyond. In my 30+ years of dealing with all kinds of companies, Ninza.co has the best customer service I have ever experienced.
I have been dealing with them for maybe 3 years or so now and I am continually impressed. I usually deal with Grace or Cute Flora. Both are fantastic. In my recent purchase Cute Flora went above and beyond for what she did for me, and it was greatly appreciated.
Samuel
Abhijit Banerjee
An Amazing Organization With Amazing People & Products
I have been with ninZa.co for many years now and over the years my trading method and objectives have changed and I have always found a product to make my trading better. The Customer Service from Hannah, Jennifer and the entire team is way beyond describing in words. They are constantly researching on ways to improve their indicators and how best to combine them for efficient and improved results. If you are clear in what kind of trading you do, then they will have something that will make your trading better.
Ben
Exceptional Responsiveness and Professional Communication: Prompt and thorough replies to my inquiries, demonstrating professionalism
ninZa.co is very responsive to my many questions and comments. I’ve sent their support folks numerous questions and have always received a reply within 24 hours. If it weren’t for the 11-hour time zone difference, I have no doubt they would respond even more quickly. They have always been very professional in their communication with me. Thanks, ninZa.co.
Steffie
Thank you for providing free indicators
The customer service is very helpful and it's great that I can have these indicators for free.
Lance S.
High-Quality Indicators and Outstanding Customer Service at ninZa.co
I have been purchasing and using indicators from ninZa.co since Larry Pi started his business with a website of about 10 indicators many years ago. And I have continued to purchase and use his indicators with additional purchases over the years. There are tons of trading vendors out there. Many I have tried and abandoned because they didn’t work and there was no customer service that I could easily email and get a prompt response for help.
What makes ninZa.co so special is not just the high quality of the indicators, but the outstanding customer service and help. I have been working with Grace over the last 6 months, and she has provided prompt, cheerful, and most importantly, high-quality customer service. Larry is lucky to have her on his team! GO GRACE!!
Jim
Excellent Support From Grace: Problem Solved!
I would say that you did a great job with the support you provided, Grace. Very eager to help and you solved my problems. Thank you again for your help.
Agbaje
Multi-Osc OB/OS Overlap, Solar Wind Plus KingRenko$ Bar With Outstanding Support From Miss Grace Lopez
I was struggling to set up my newly bought product in the name of Multi-Osc OB/OS Overlap, Solar Wind plus KingRenko$ bar I just bought it. As soon as I started the chart box, Miss Grace Lopez came to my rescue. She lead the way, connected to my computer with my permission, and set up my software without any problems. She was patient and kind. I am so grateful to her and truly appreciate her assistance. She is certainly an asset to your company. Hopefully, she will stick around longer and ninZa.co group of companies i.e. personnel will appreciate her contribution to the company. Once again, Thank you Miss Grace for your effort in solving my frustration at 2:00 Am in the morning.
Sigma Bob
Highly Recommended Service - Ms. Hannah
ninZa.co Hannah has provided timely service on information and purchases. Foreign support is generally complained about, but ninZa.co Hannah has been attentive and responsive to my email communications. For that I thank her and she reflects positively on ninZa.co.
Research Domains
Full spectrum of trading intelligence across diverse domains. Explore all domains
Support & Resistance
Find where price may turn or break
Identify key price areas where buying and selling pressure tend to react. Help traders recognize important levels for potential reversals, trend continuation, or breakouts, and plan trades around these key areas.
Analyze real-time buying and selling activity to assess buyer and seller aggression. Help traders gauge the strength behind price movements and identify key shifts in market behavior.


_1787026707358.svg)