ninza.co Logo
Download 40+ FREE IndicatorsInfrastructureSolutions⭐️ MEO & Absolute Price
Research Domains
MEO Collection #115: SwingWeave + ICT PhantomTrace

MEO Collection #115: SwingWeave + ICT PhantomTrace

One-time investment

Earn $0 back in Zuture Wallet • Online orders only ✓

Access this collection

Need guidance? Contact sales

Perpetual license
Lifetime support
Free updates
30-day exchange

Earn $0 back in Zuture Wallet • Online orders only ✓

Access this collection

Part of a broad trading intelligence ecosystem comprising 300+ research projects and products.

  • Trusted by

    60,000+ traders

    worldwide

  • Reflected in

    700+ verified

    5-star reviews

  • Backed by

    12 years of

    research & innovation

Trading setups often become clearer when market structure and liquidity are evaluated together rather than in isolation.

This collection combines SwingWeave and ICT PhantomTrace into one structured workflow for reading how price structure is developing, where liquidity is being collected, and whether the market is showing continuation or potential reversal behavior.

Read the structure. Track the liquidity. Evaluate the next move.

A broken swing point does not always mean the same thing.

Price may break a previous high as part of a healthy trend continuation – or that same move may sweep liquidity before reversing. Likewise, a structural shift can look significant on its own, but its meaning changes depending on where liquidity has been taken and which liquidity objective the market may be pursuing.

This collection approaches the market through two separate questions:

01 – What is the price structure doing?

Use SwingWeave to identify important Swing Points and determine whether structural breakouts indicate Follow Trend or Reversal behavior.

02 – What is liquidity doing behind that structure?

Use ICT PhantomTrace to evaluate liquidity collection, market structure transitions, Fair Value Gaps, and directional liquidity objectives.

Together, the two indicators provide separate but complementary views of the same price movement: structure shows what price is doing, while liquidity adds context for why that movement may matter.

Two indicators, two different roles

SwingWeave

SwingWeave provides the market-structure layer of the workflow.

Instead of requiring traders to continuously compare previous highs and lows manually, it automatically identifies relevant Swing Points, connects the evolving structure, and detects breakouts directly on the chart.

Its signals distinguish between two important structural behaviors:

  • Follow Trend: Identifies Swing Point breakouts occurring in the direction of structural continuation.
  • Reversal: Identifies structural changes that may indicate the market is beginning to shift direction.

SwingWeave also provides two methods for identifying Swing Points:

  • Price-based Swing detection reacts more quickly to price movement, making structural changes visible earlier but potentially capturing more market noise.
  • Moving Average-based Swing detection applies additional filtering to the structure, producing more selective Swing Points and breakout signals at the cost of additional confirmation time.

This flexibility allows traders to adapt structural analysis to different strategies, instruments, and trading styles.

Role in the collection: Market Structure

banner-image
banner-image
banner-image
banner-image
banner-image
banner-image
banner-image
banner-image
banner-image
banner-image

ICT PhantomTrace

ICT PhantomTrace provides the liquidity layer of the workflow.

Rather than treating ICT concepts as isolated events, it connects liquidity behavior into two structured frameworks: Liquidity Transition and Liquidity Continuation.

For potential transitions, ICT PhantomTrace tracks the sequence from:

Stop Run → Market Structure Shift → Fair Value Gap → FVG Retracement → Reaction

This helps traders evaluate whether liquidity collection is developing into a broader change in order flow.

For continuation scenarios, the indicator tracks:

PDH / PDL → Liquidity Bias → BOS → Fair Value Gap → Reaction

This provides additional context for determining which side of liquidity the market may currently be seeking and whether continuation signals align with that objective.

Role in the collection: Liquidity Context

banner-image
banner-image
banner-image
banner-image
banner-image
banner-image
banner-image
banner-image
banner-image
banner-image

How the two tools work together

The collection is designed around a simple sequence:

01 Market Structure
SwingWeave
↓
02 Liquidity Context
ICT PhantomTrace

SwingWeave first makes the evolving price structure visible: where meaningful swings are forming, which Swing Point has been broken, and whether the structural event is classified as Follow Trend or Reversal.

ICT PhantomTrace then adds another layer of context by showing whether liquidity has been collected, whether order flow is transitioning, and which larger liquidity objective may be active.

Instead of asking one signal to explain the entire market, traders can evaluate structure and liquidity as two separate layers of evidence.

NQ DEC26 (1 Minute) 2026_10_01 (10_17_27 AM)_1791964664214_2026-10-14T07:57:44.png

NQ DEC26 (1 Minute) 2026_10_06 (10_17_59 AM)_1791964663940_2026-10-14T07:57:43.png

NQ DEC26 (1 Minute) 2026_10_06 (10_16_31 AM)_1791964663642_2026-10-14T07:57:43.png

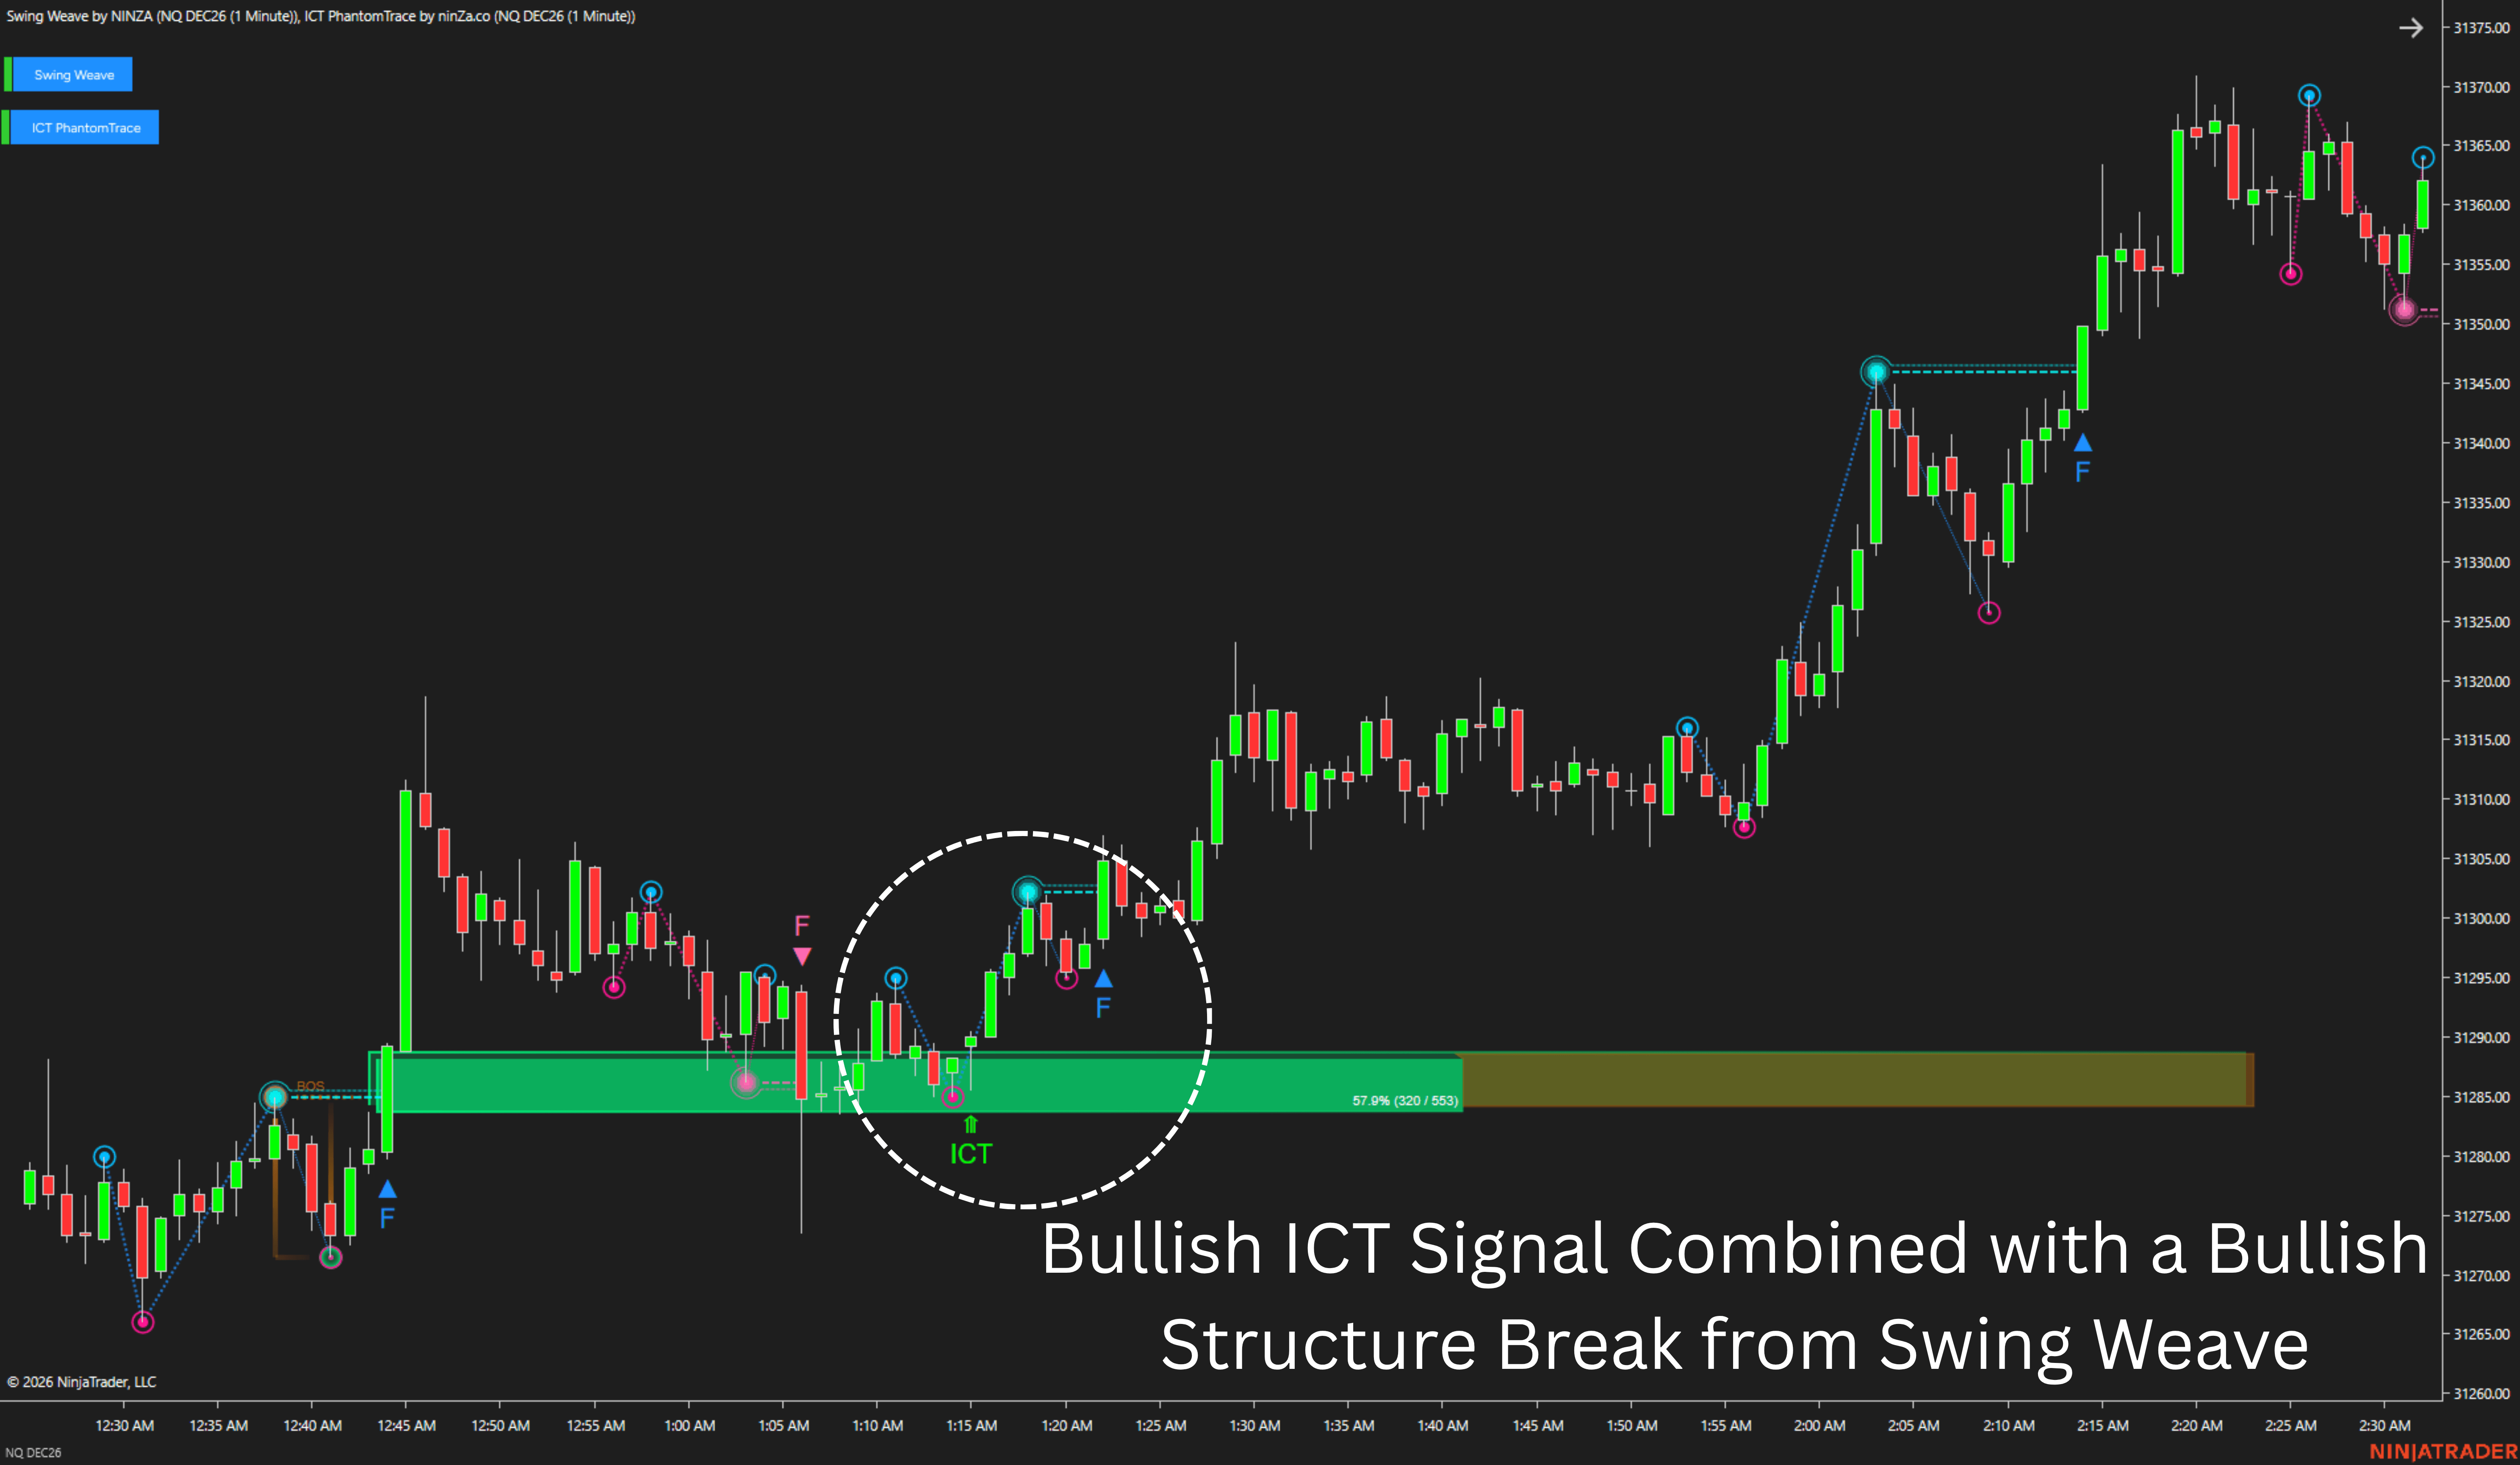
Example workflow: structural continuation

1. Identify the current Swing structure

Use SwingWeave to visualize the sequence of relevant highs and lows and establish how the current market structure is developing.

2. Detect a Follow Trend breakout

SwingWeave identifies when price breaks a Swing Point in the direction of structural continuation.

3. Check the liquidity objective

Use ICT PhantomTrace to determine whether Buy-Side or Sell-Side liquidity is currently favored and monitor relevant PDH / PDL objectives.

4. Evaluate the continuation framework

Look for BOS, Fair Value Gap, and price reaction conditions that support the active liquidity direction.

5. Evaluate the complete setup

Consider structure, liquidity location, volatility, support/resistance, and risk before making a trading decision.
6_1791964669377_2026-10-14T07:57:49.png

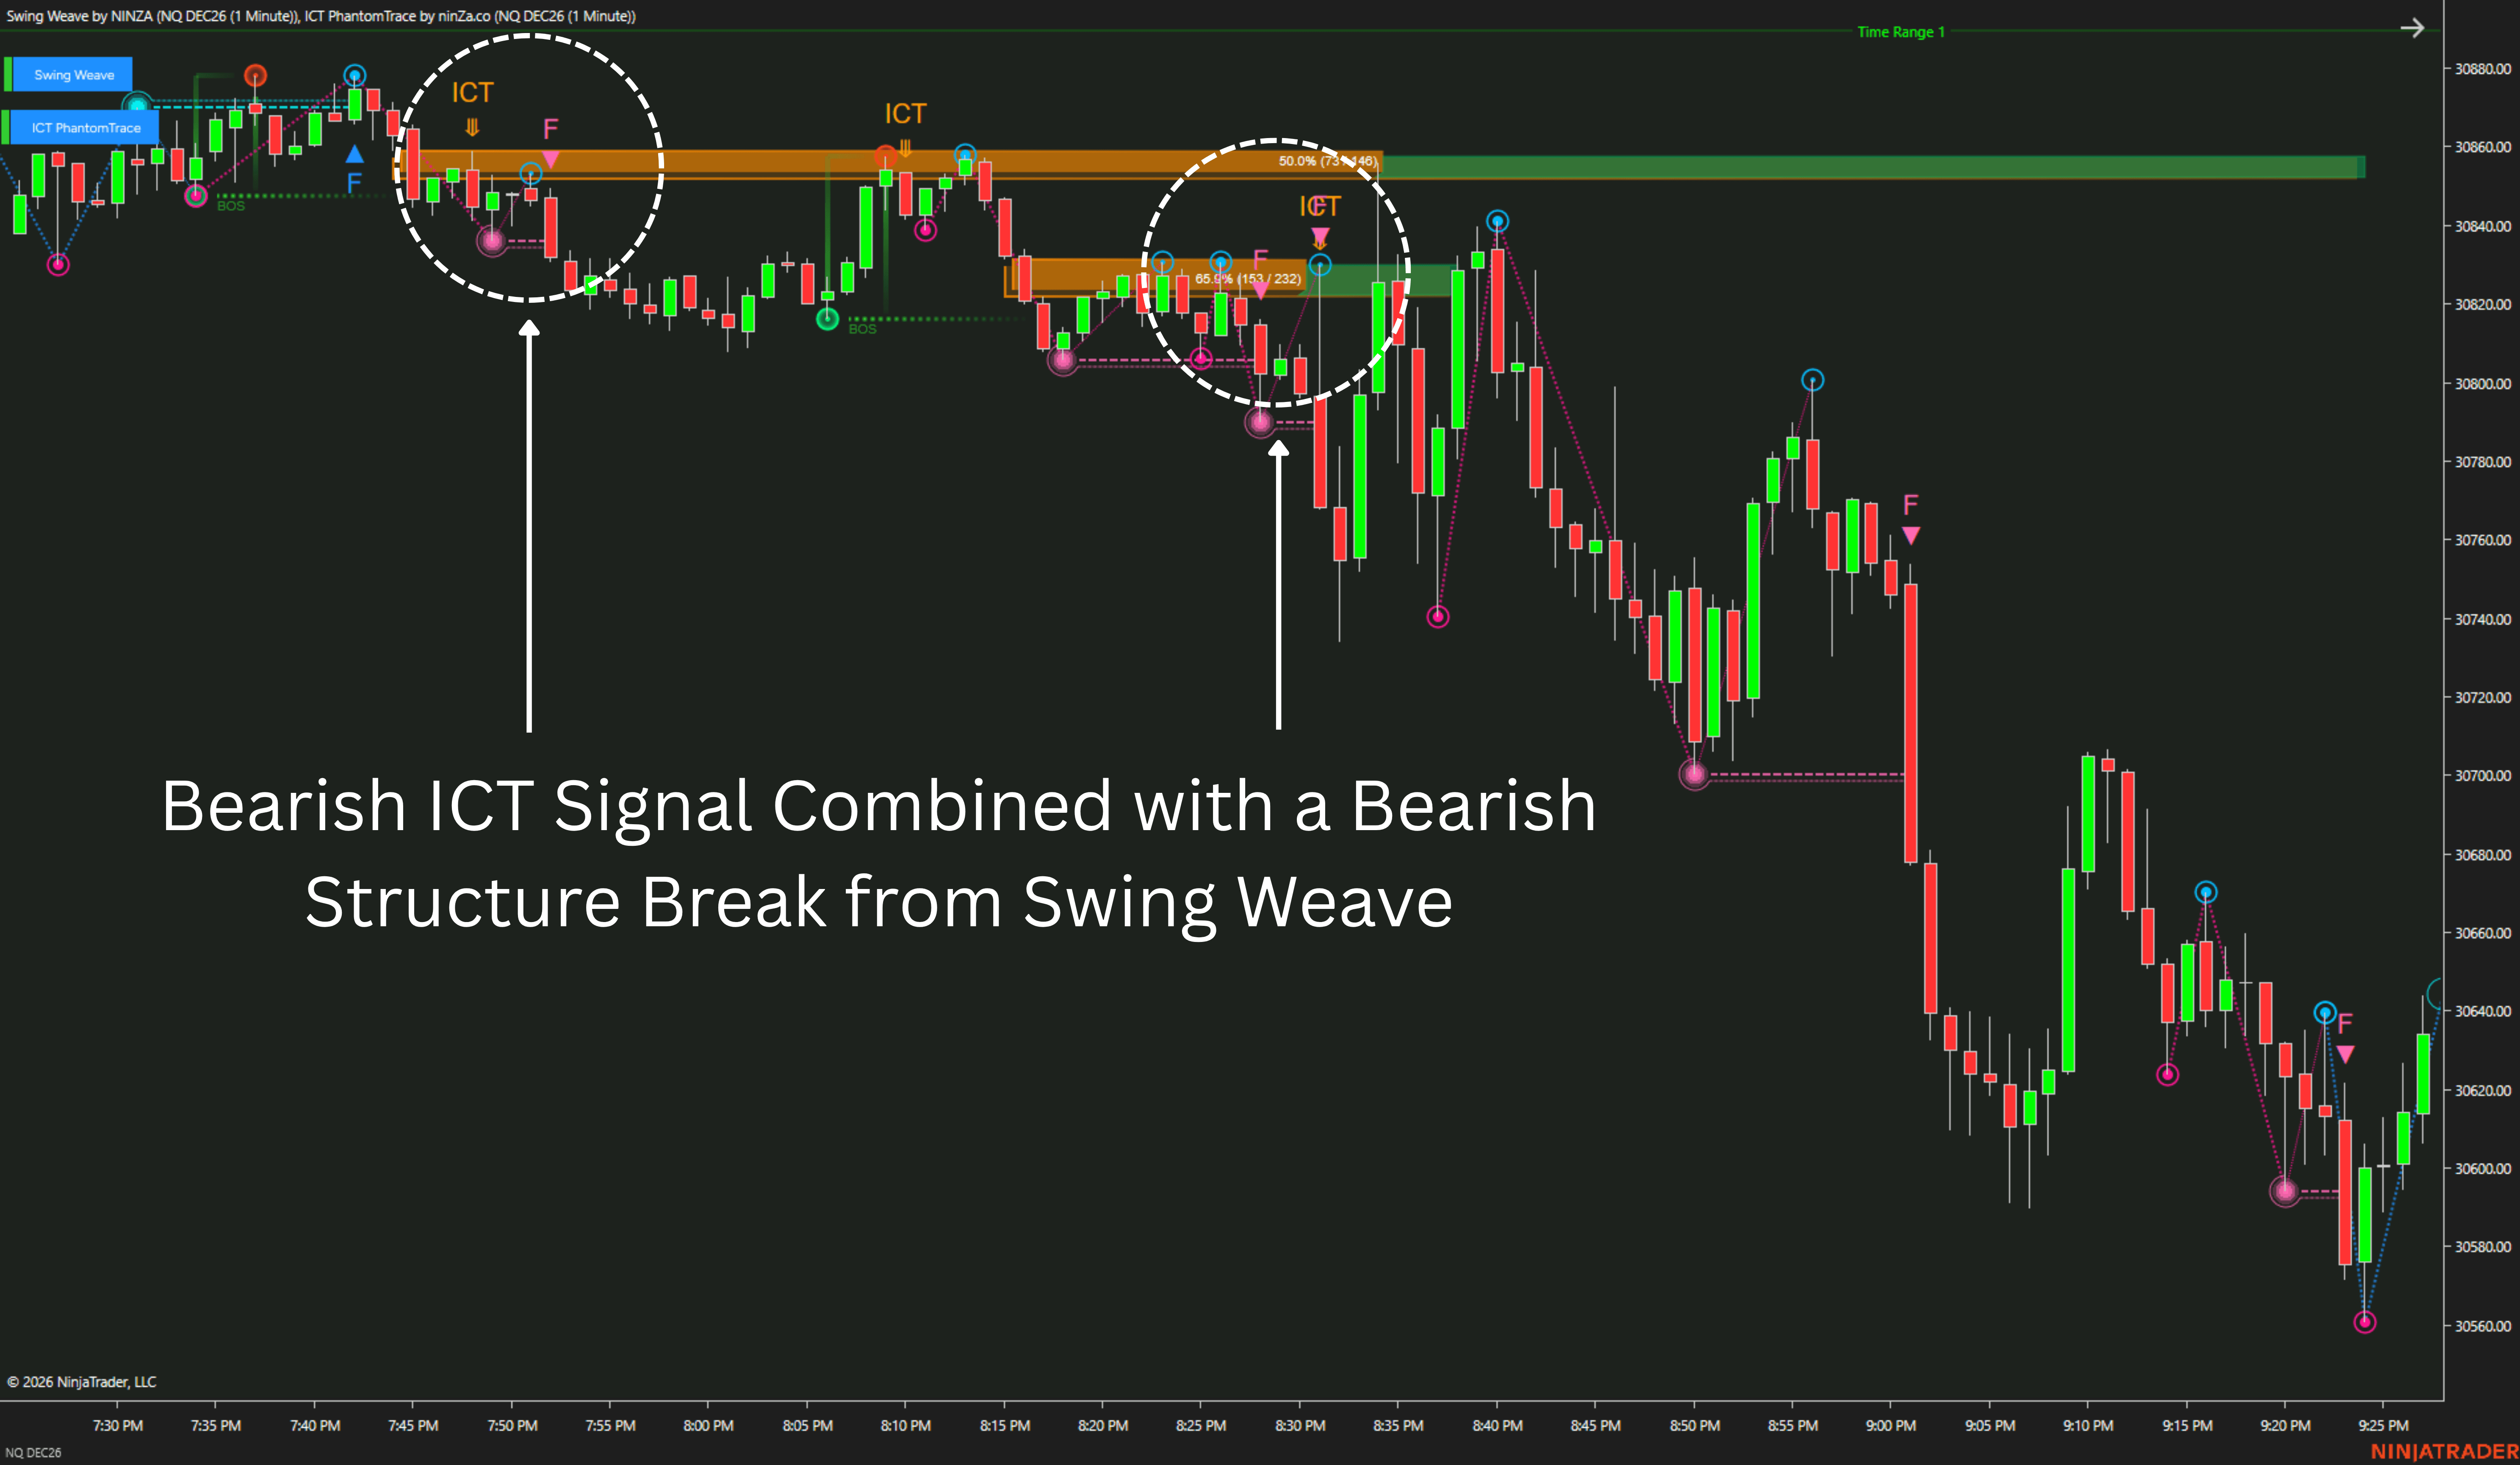
Example workflow: potential structural reversal

The same collection can be used when the market begins showing signs that the existing structure may be changing.

1. Watch liquidity being taken

ICT PhantomTrace identifies a Stop Run where liquidity has been collected around an important area.

2. Monitor the structural response

SwingWeave shows how price behaves relative to existing Swing Points and whether an opposing structural breakout begins to develop.

3. Look for a Reversal signal

A SwingWeave Reversal signal provides evidence that the previous structural sequence may be changing.

4. Evaluate the liquidity transition

ICT PhantomTrace tracks MSS, Fair Value Gap formation, retracement, and subsequent reaction to determine whether the liquidity event is developing into a broader transition.

5. Evaluate the complete setup

Use both structural and liquidity evidence together rather than treating either event as sufficient on its own.
5_1791964669969_2026-10-14T07:57:50.png

See market structure from two perspectives

A Swing Point tells you where price has established an important structural reference.

A breakout tells you that this reference has been violated.

But neither automatically explains why the breakout occurred or what liquidity objective may sit behind the move.

SwingWeave gives traders a structured view of highs, lows, breakouts, continuation, and reversal.

ICT PhantomTrace adds the liquidity framework behind those movements through Stop Runs, MSS, FVGs, PDH/PDL, and directional liquidity bias.

Together, they create a workflow built around two complementary questions:

What is the price structure doing? 
SwingWeave

Where is liquidity moving?
ICT PhantomTrace

Instead of reacting to every breakout or ICT event independently, traders can evaluate how market structure and liquidity behavior interact before making the next decision.

Product Media

Watch the indicator in action. Step-by-step guides, live trading, and feature overviews.

Policies

Software license

Every purchase includes a perpetual software license, granting you the right to use the software indefinitely on the number of computers permitted by your license.

Installation & Onboarding

Every purchase includes guided installation assistance.
Purchases with Premium Services also include white-glove software setup and onboarding, along with personalized trading setup and workflow optimization.

Software updates & upgrades

Software updates & upgrades are provided at no additional cost. 
For products with a modular structure, this coverage applies to the core product, while optional expansion modules may be offered separately.
Read the full policy

Customer service

Every purchase includes lifetime support via email & chat, delivered by our renowned Customer Care team – widely recognized throughout the trading community for its world-class service.
As your NINZA product collection expands, Premium Path unlocks a growing range of enhanced Customer Care benefits & privileges, available through dedicated channels.
Explore Premium Path

Remote assistance

Every purchase includes up to 3 complimentary remote assistance sessions, available within 30 days of purchase – with each session lasting up to 30 minutes.
Purchases with Premium Services include up to 6 sessions within 60 days of purchase, with priority scheduling and longer session durations.

Product exchange

Customers may request up to 3 product exchanges within 30 days of purchase, at little or no additional cost when exchanging for a comparable product.
Read the full policy

Returns & refunds

Due to the ease with which software products can be stored and copied, no returns will be accepted and no refunds will be issued.
ALL SALES ARE FINAL & NON-REFUNDABLE.

Community Perspectives

From individual traders to pros and institutional trading teams...
Trusted worldwide! Read traders' thoughts

4.9

Based on 800+ authentic reviews

M.

M.

Indicators Improved My Charts. Hannah's Help And Great Customer Service. Will Buy Again.

I have been using the ninZa.co indicators for several months now and am very happy with what a valuable addition they have been to my charts. I recently decided to add one of the recently released indicators from ninZa.co. But after using for a few days, it wasn’t quite what I had been looking for. I contacted ninZa.co and had the pleasure of working with Hannah for an exchange to a different one of the many available indicators. At the time, the indicator I wanted to purchase to replace the one I had recently bought was on sale. Hannah put through an exchange and without my having to ask, gave me the advantage of the sale price. She also included a pdf that provided education about the indicator I chose to switch to. Any time I have had contact with one of the associates from ninZa.co, I have received excellent customer service, and will not hesitate to purchase from them again.
Bartosz

Bartosz

Grace Goes Above And Beyond: A Customer Support Experience That Exceeds Expectations!

Thank You, Grace! Your support is extraordinary I wish all companies have such great support. Keep going I’m 200% satisfied.
Kari L.

Kari L.

ConnorsRSI Pro With Grace's Outstanding Customer Service

Thank you very much for your excellent customer service, Grace! You are doing an excellent job making customers' lives much easier.
T.

T.

An Exemplary Customer Experience At NinZa.Co: Unveiling The Power Of Cumulative Delta

I'm a new customer with ninZa.co and i was needing help today in making a purchase. I made a request on your chat platform and Hannah came to my rescue. She helped me find the what I needed and even offered me a discount. Everything went very smoothly from that point. I made the purchase and she even provided me some documentation on the indicator. I am very pleased with her assistance. Thanks again Hannah for your excellent customer service !!
Mike W.

Mike W.

Smart Ruler

I use ninZa.co's Smart Ruler every day !!! It is on all charts and helps me a great deal. Smart Ruler is one great tool for NinjaTrader !!!!!!!
A. B.

A. B.

The indicator is working perfectly

The indicator is working perfectly. You guys are the best - Purchased Smart Zoom + Supply/Demand Discovery
Sandeep Rao

Sandeep Rao

Awesome Indicator And Pi Rocks

This is my story, I ordered the Day Range indicator for NIFTY India. To my dismay, it didn't work well as it calculated ranges in ticks. I asked Larry Pi if there was a workaround, and he created a new version with all the choices for range unit: points, ticks, pips. He was with me all through the process, with very short turnaround cycles. So don't hesitate at all to pick what you want! You won't regret.
J.

J.

Grateful For Excellent Support From Hannah!

Hi Hannah, Thank you for your great support. You got back to me right away, provided links to solve the problem, and they worked great! All is well that ends well, and your kind and more than adequate support ended very well! Thanks.
David P. From Connecticut

David P. From Connecticut

- Purchased Supply/Demand Discovery + TDI Pro + Solar Wind + Intraday Adaptive S/R + Ruby River + Market Profile (Daily) + Day Range

Just got your new Supply/Demand Discovery and it is truly a great improvement over everything else on the market. It will take me days to determine the best values for the variables for my different charts, but it will be worth the effort.

Research Domains

Full spectrum of trading intelligence across diverse domains. Explore all domains

Profile

Identify where the market finds value

Analyze volume and value distribution across price levels to identify concentrated trading activity and key value areas. Highlight levels that may influence future price reactions and moves.

Profile
Explore Profile
Imbalance Profile LidarMarket Profile (Daily)KingDOM$Flex TPO

Statistics & Quant

Turn market data into measurable insight

Use data, statistics, and quantitative models to measure market behavior and identify meaningful patterns. Turn these insights into data-driven signals, probabilities, and trading decisions.

Statistics & Quant

dark-logo.svg

NINZA is an official member of NinjaTrader Ecosystem together with 600+ industry-leading professionals that provide traders with quality trading products & services.

paypal.pngvisa.pngmastercard.pngtazapay.png

even more payment methods

Follow us on

Shop By

  • Trading Style  
  • Trading Method  
  • Analysis Method  
  • Product Type  

Quick Links

  • Best Seller  
  • New Releases  
  • PRIME  
  • GRAND  

Company

  • Welcome to NINZA  
  • Contact  
  • Customer Reviews  

Instructions

  • Guide  

  • Policy  

  • Config  

  • ninZaFamily  

Support

  • Customer Service   

  • Pay  

Resources & Information

  • Blog

  • Strategies

  • FAQs

  • Vendors

© Copyright 2026 All Rights Reserved

DMCA.com Protection Status

ninzaTrader.png

footer-image.png

Terms of Use Privacy Policy Sitemap Risk Disclosure Exchange Policy Changelog Pricing

Because software products may be copied and stored easily, we will NOT issue refunds of any kind. ALL SALES ARE FINAL & NON-REFUNDABLE!

Futures, foreign currency, and options trading contains substantial risk and is not for every investor. An investor could potentially lose all or more than the initial investment. Risk capital is money that can be lost without jeopardizing one's financial security or lifestyle. Only risk capital should be used for trading and only those with sufficient risk capital should consider trading. Past performance is not necessarily indicative of future results.

Hypothetical performance results have many inherent limitations, some of which are described below. No representation is being made that any account will or is likely to achieve profits or losses similar to those shown; in fact, there are frequently sharp differences between hypothetical performance results and the actual results subsequently achieved by any particular trading program. One of the limitations of hypothetical performance results is that they are generally prepared with the benefit of hindsight. In addition, hypothetical trading does not involve financial risk, and no hypothetical trading record can completely account for the impact of financial risk of actual trading. For example, the ability to withstand losses or to adhere to a particular trading program in spite of trading losses are material points which can also adversely affect actual trading results. There are numerous other factors related to the markets in general or to the implementation of any specific trading program which cannot be fully accounted for in the preparation of hypothetical performance results and all which can adversely affect trading results.

NinjaTrader® is a registered trademark of NinjaTrader Group, LLC. No NinjaTrader company has any affiliation with the owner, developer, or provider of the products or services described herein, or any interest, ownership or otherwise, in any such product or service, or endorses, recommends or approves any such product or service.