![[Auction Δxis] A comprehensive overview of Auction Δxis](https://forestcms.nyc3.digitaloceanspaces.com/media/small_Thumbnail New release Auction ∆XIS_1784002540029.jpg)
[Auction Δxis] A comprehensive overview of Auction Δxis
Support & Resistance is not a property of indicators. It is a property of the market itself.
_1784001871922.jpg)
Summer Privilege event
More flexibility for your next trading upgrade
Receive up to $500 in Voucher-F
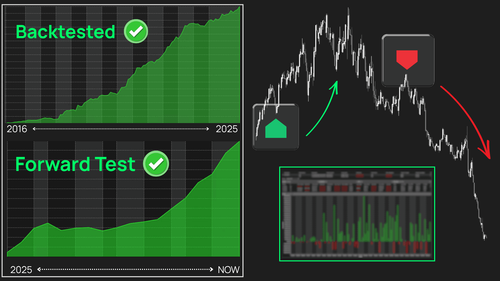
Review the optimized backtest results
- $48,000+ backtested profit for the funded account template.
- $3,200+ backtested profit on MNQ over the last four months.
_1783425884112.jpg)
Ready-to-Buy Pricing
A clearer way to understand product pricing
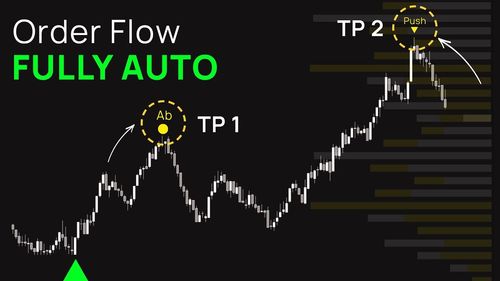
Fully Automated Order Flow
Enter with confirmed Order Flow strength. Exit when the edge starts to fade.
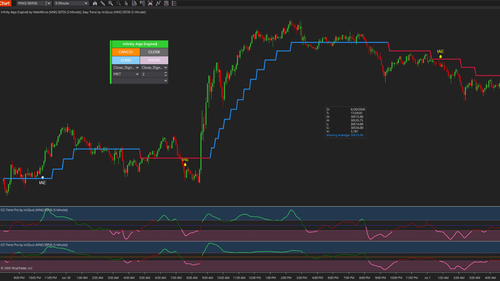
2 indicators. 1 structured CCI workflow
Double CCI combines CCI Trend Pro and Easy Trend into one structured CCI workflow
![[July Exclusive] Liberty Edge Bundle](https://forestcms.nyc3.digitaloceanspaces.com/media/small_liberty-edge-bundle-hdhdh_1783139262484.png)
[July Exclusive] Liberty Edge Bundle
From market analysis to trade execution — in one structured workflow.
LIQ Sweep Hunter
You constantly get stopped out?
You read the market structure correctly. You enter in the right direction
Yet price still runs your stop — and immediately reverses into the exact scenario you had anticipated. The issue is not your analysis.
It is your positioning within the liquidity structure. Most traders place stops in predictable areas — recent swing highs and lows, clean breakout levels, trailing stops, etc.
But those are precisely the areas where the market seeks liquidity to fill larger positions.
When price pushes through these zones, it is not always a genuine breakout. It is a liquidity sweep — the deliberate triggering and absorption of clustered stop losses.
Liquidity sweeps are discussed everywhere — SMC, ICT, stop-hunt theory. But in a live market, theory does not help you in the moment.
You cannot clearly see:
- When stops are being aggressively triggered
- When the stop-run is complete
- When the market is about to expand
So you react too early. Or too late. And more often than not, you end up on the side that gets swept — instead of the institutional side that drives the move.
Introducing LIQ Sweep Hunter: Position with Liquidity, NOT against it
LIQ Sweep Hunter does not simply mark levels. The indicator tracks the full liquidity cycle the market typically hides:
Liquidity Build-Up → Sweep → Control Shift → Expansion
Instead of guessing whether a breakout is real or a stop hunt, you see which phase of the cycle is unfolding. The logic is rooted in market microstructure — how orders are matched and liquidity is distributed.
- Stop losses are opposing market orders triggered when price trades through them.
- Large positions cannot be filled without sufficient opposing liquidity.
- That liquidity clusters in predictable areas shaped by crowd behavior — swing highs and lows, breakout levels, trailing stops, and visible support/resistance.
Price trades into liquidity first. Then it moves. LIQ Sweep Hunter converts that structural reality into a rule-based detection engine:
- It locates Liquidity Pools, where opposing liquidity is statistically likely to concentrate.
- When price trades through them, it does not assume continuation.
- It analyzes the post-break reaction to determine whether price is being structurally accepted — or whether the move was merely a liquidity sweep.
Only after the liquidity sweep is complete and order flow imbalance becomes evident does the indicator confirm the start of expansion.
 2026_02_05 (9_10_30 PM)_1770892829793.png)
 2026_02_09 (8_56_54 PM)_1770892829444.png)
 2026_01_09 (3_44_05 AM)_1770892829261.png)
 2026_02_09 (8_52_44 PM)_1770892829233.png)
 2026_02_10 (8_57_41 PM)_1770892829190.png)
 2026_02_10 (8_59_55 PM)_1770892829079.png)
 2026_02_10 (3_30_02 AM)_1770892828864.png)
 2026_02_09 (9_00_18 PM)_1770892827068.png)
What changes when you see Liquidity clearly?
When you recognize the liquidity cycle instead of focusing solely on breakouts, the way you trade changes completely.
You enter after the sweep, not before it.
Instead of being triggered with the crowd, you wait for the stop run to complete. Then you participate.
Your stop sits at true invalidation, not at obvious levels.
The Liquidity Pool becomes a structural boundary. If it breaks, the premise is wrong. If it holds, the sweep remains valid. Your stop now has logic — not emotion.
You position during expansion, not in the chase.
Signals appear only after the liquidity sweep is complete. You participate at the start of displacement.
You avoid breakouts that look clean but lack fuel.
A level break alone is not enough. The move must prove acceptance — or rejection — after the sweep.
2 distinct modes to detect Liquidity Sweeps
Mode 1: Follow Direction
(Built for scalpers and intraday traders who want early expansion and clean R:R from the beginning of a move)
The mechanics of Internal Liquidity
In trending markets, price does not always form clean, obvious swing highs or lows. But liquidity still forms continuously.
That liquidity often sits along:
- Short-term swing points
- Trailing stops tightening behind price
Trailing stops are especially important because they represent dynamic liquidity. Even without a clear structural high/low, clusters of trailing stops create executable liquidity for larger participants.
The Follow Direction mode focuses on what happens inside an existing trend — the small internal stop runs that occur before continuation.
How it works
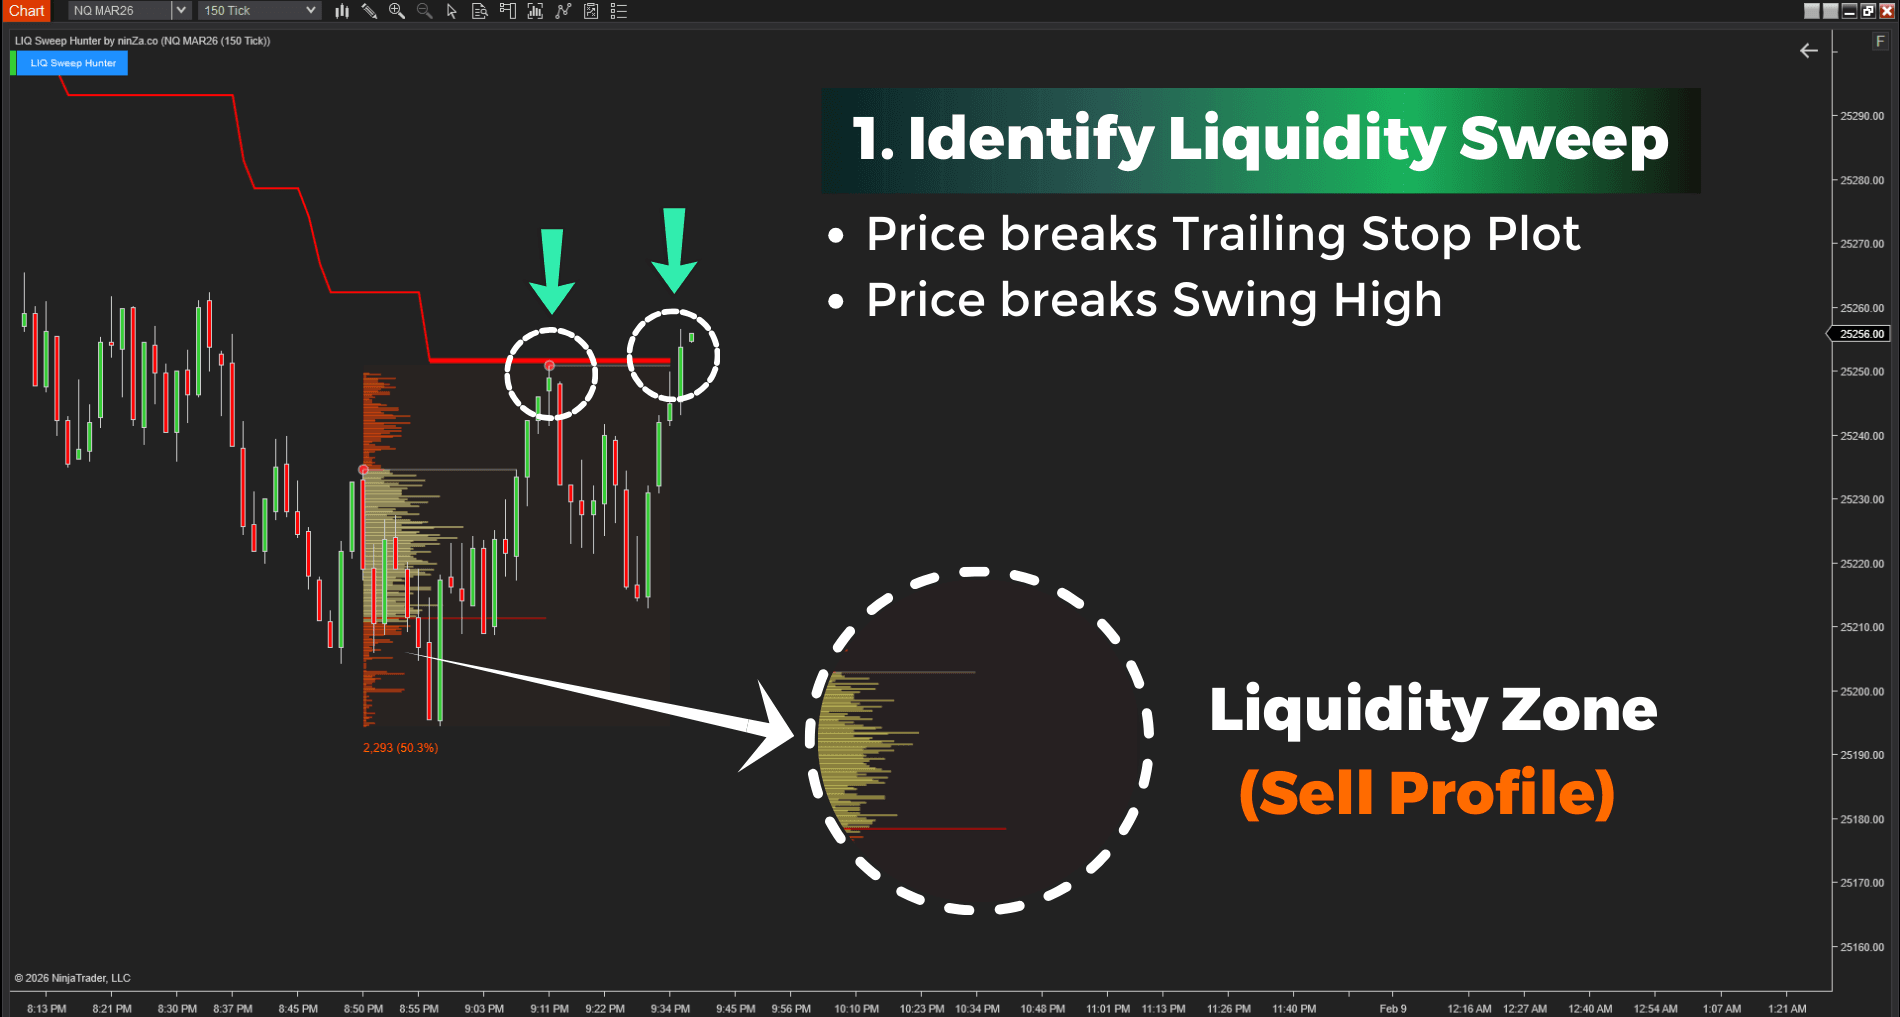
1. Liquidity Detection
The indicator identifies a liquidity sweep when price trades beyond short-term swing highs/lows and sweeps the trailing stop line.
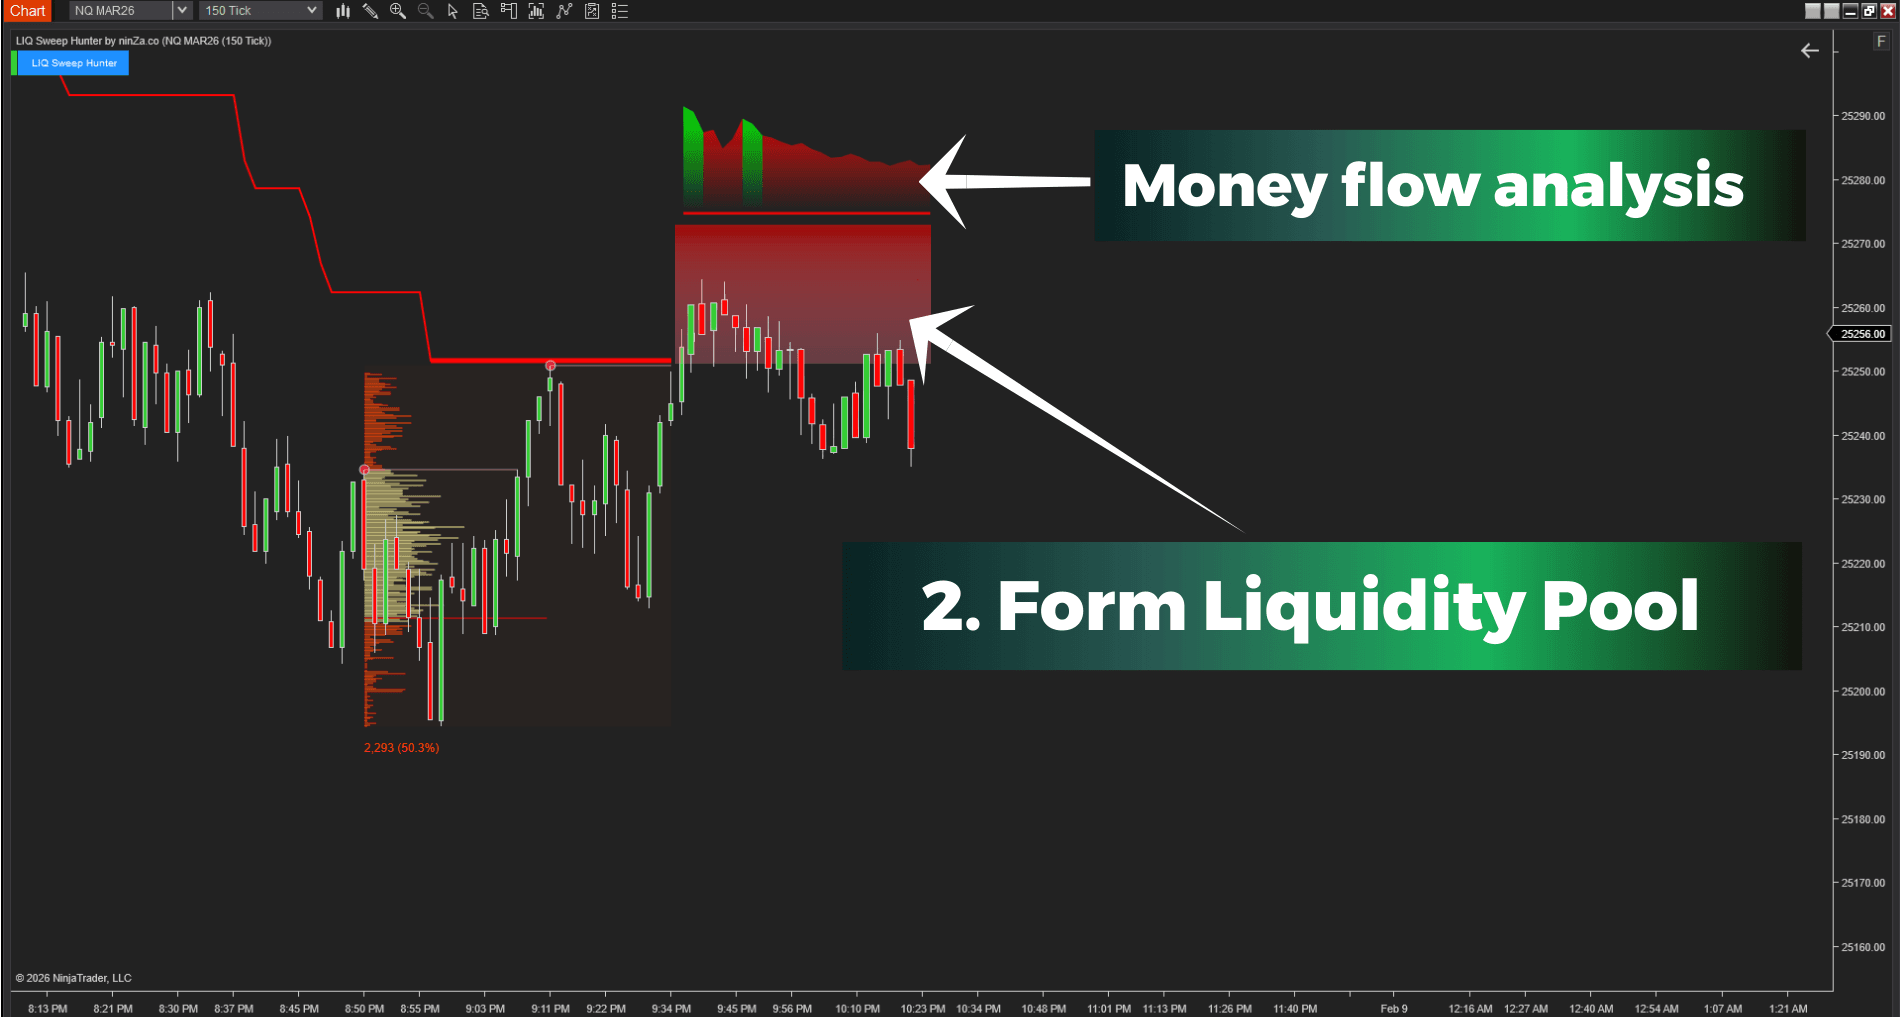
2. Liquidity Pool Formation
Once swept, a defined Liquidity Pool is established. This pool serves 2 purposes:
- It marks the structural boundary of the sweep.
- It defines a clear invalidation level.
If price holds within this framework and fails to expand beyond it, the event is likely a liquidity sweep. If price decisively accepts beyond the pool, continuation has structural backing.
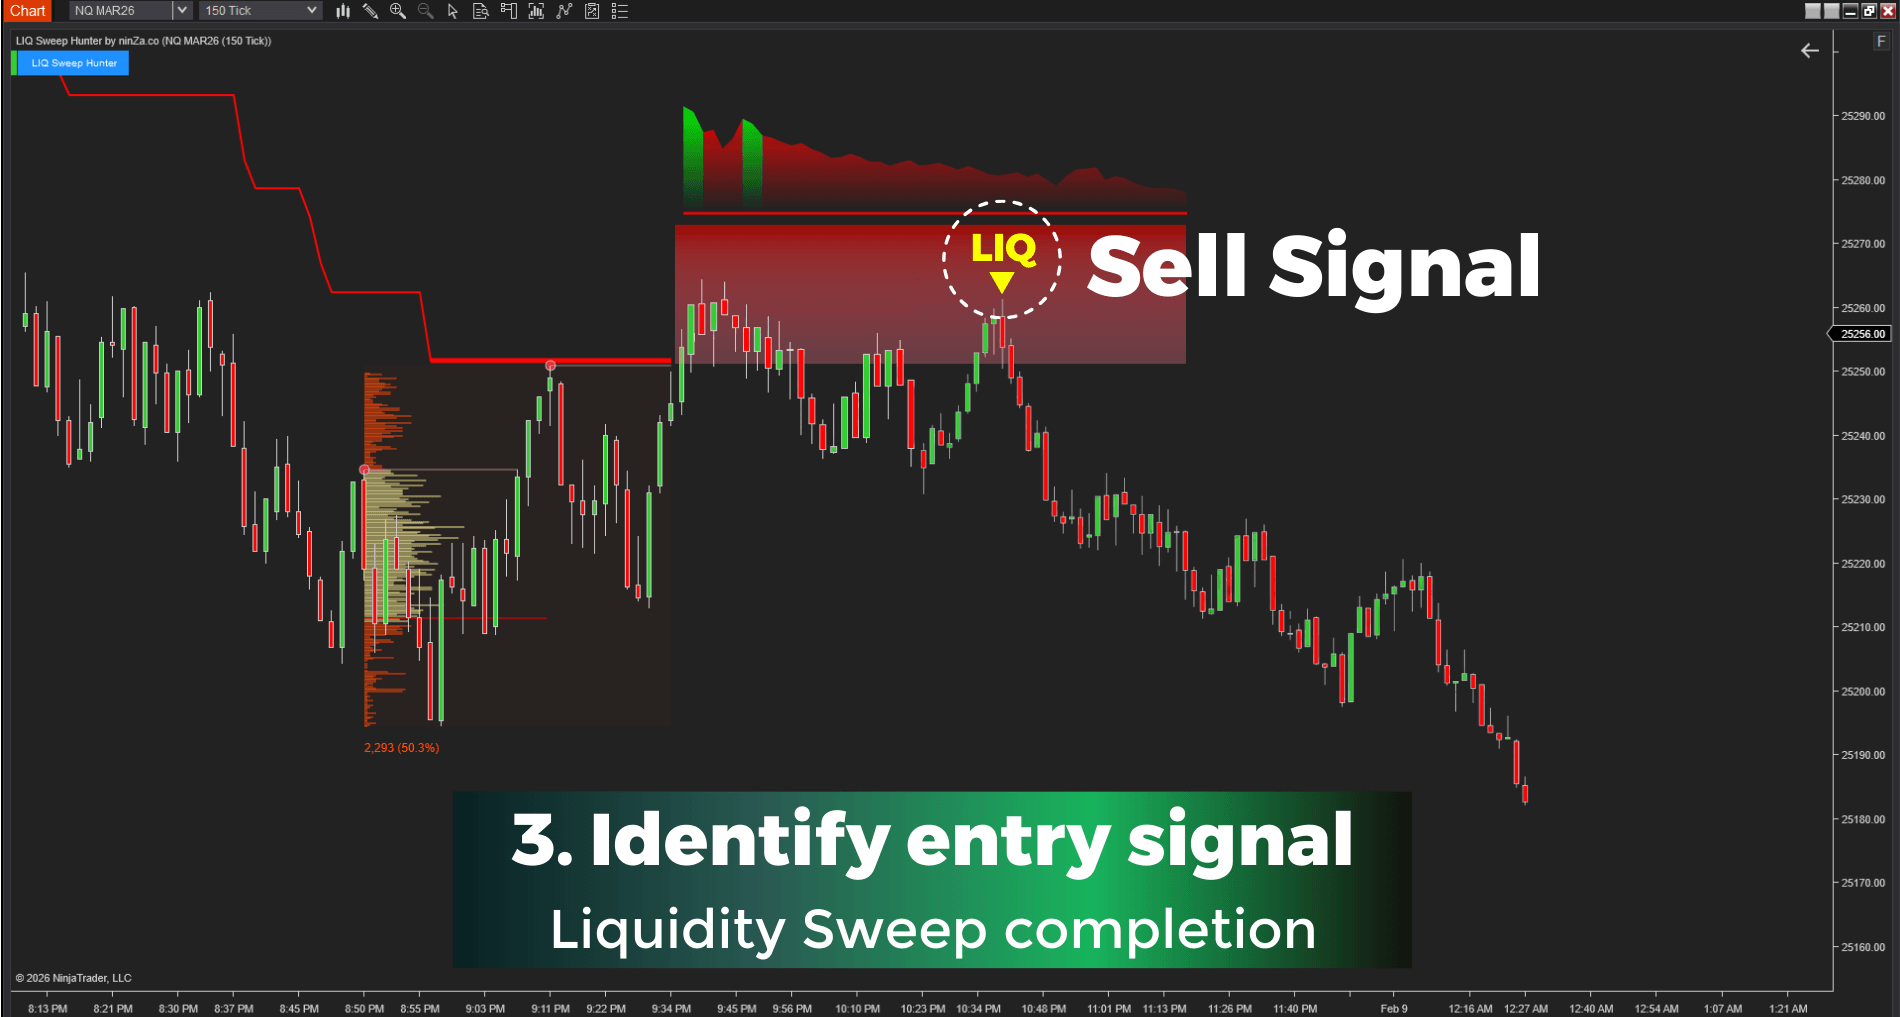
3. Signal Confirmation
The indicator then monitors price behavior inside the Liquidity Pool to determine whether the trend is ready to resume. This sequencing increases signal reliability by ensuring entries occur after internal stop runs complete — not during them.
Supporting components
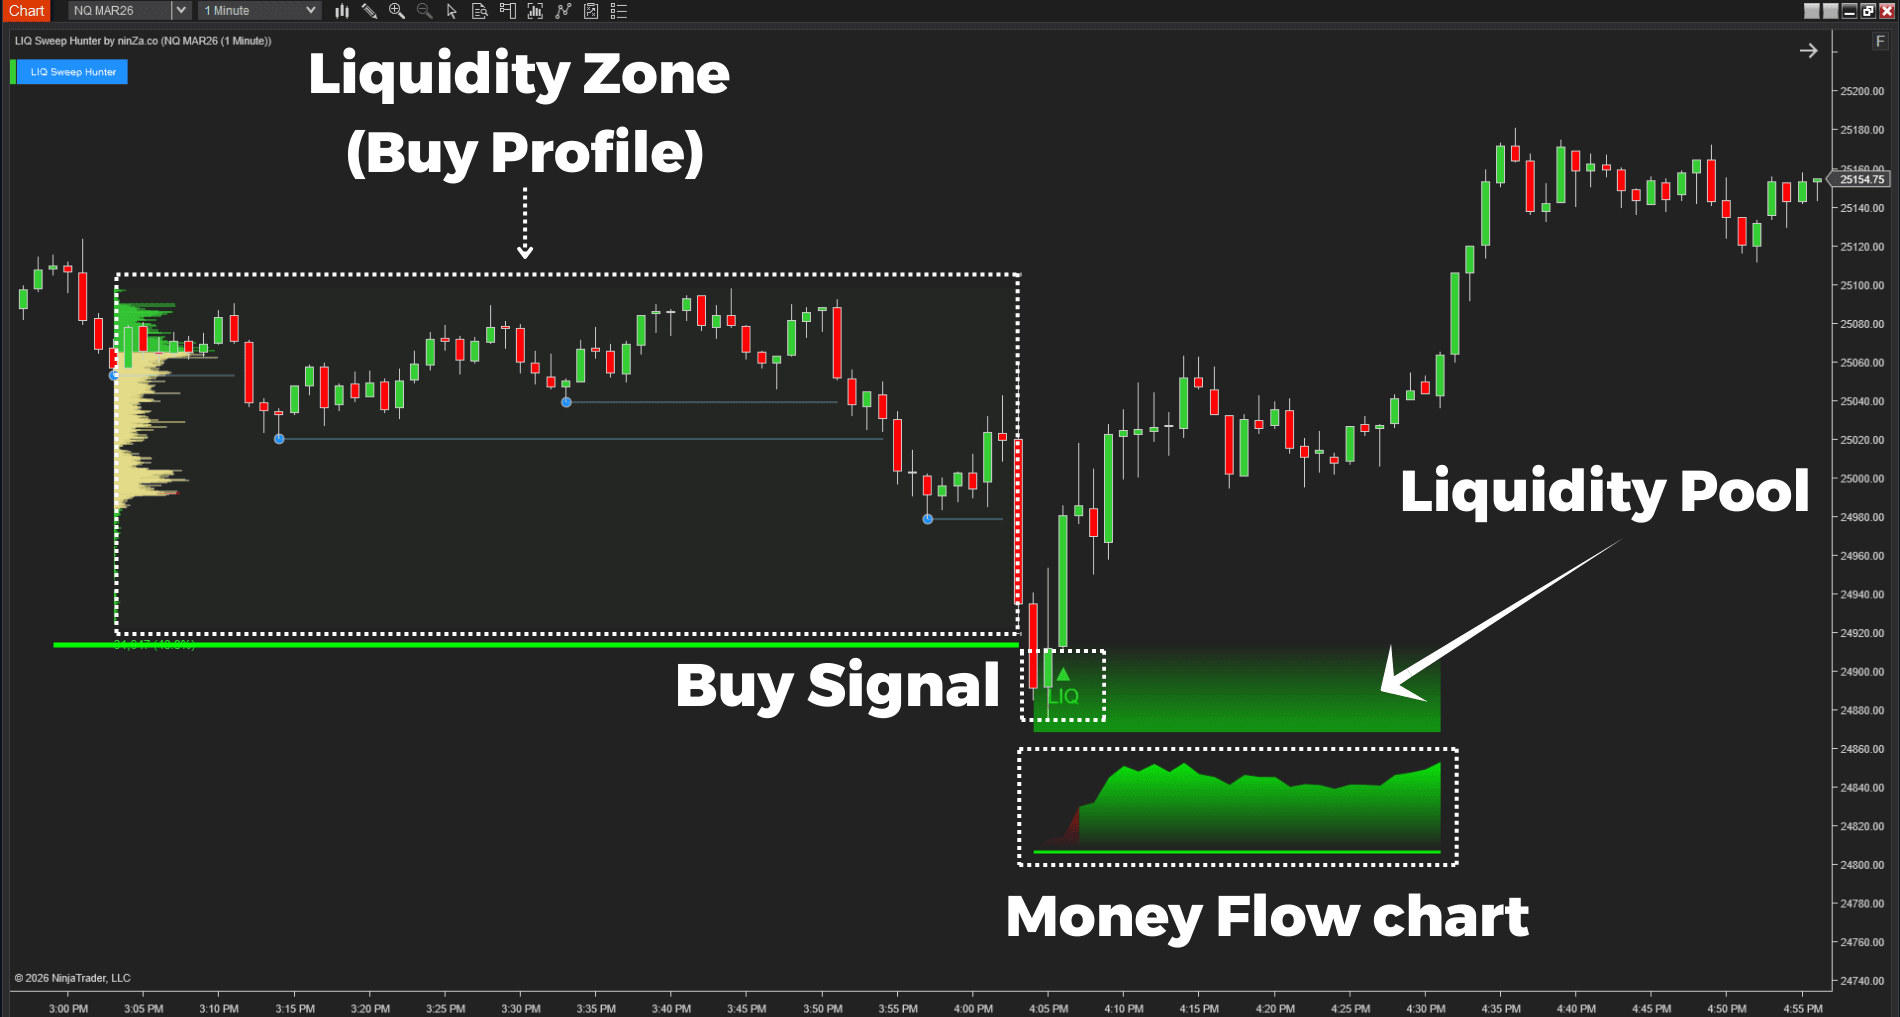
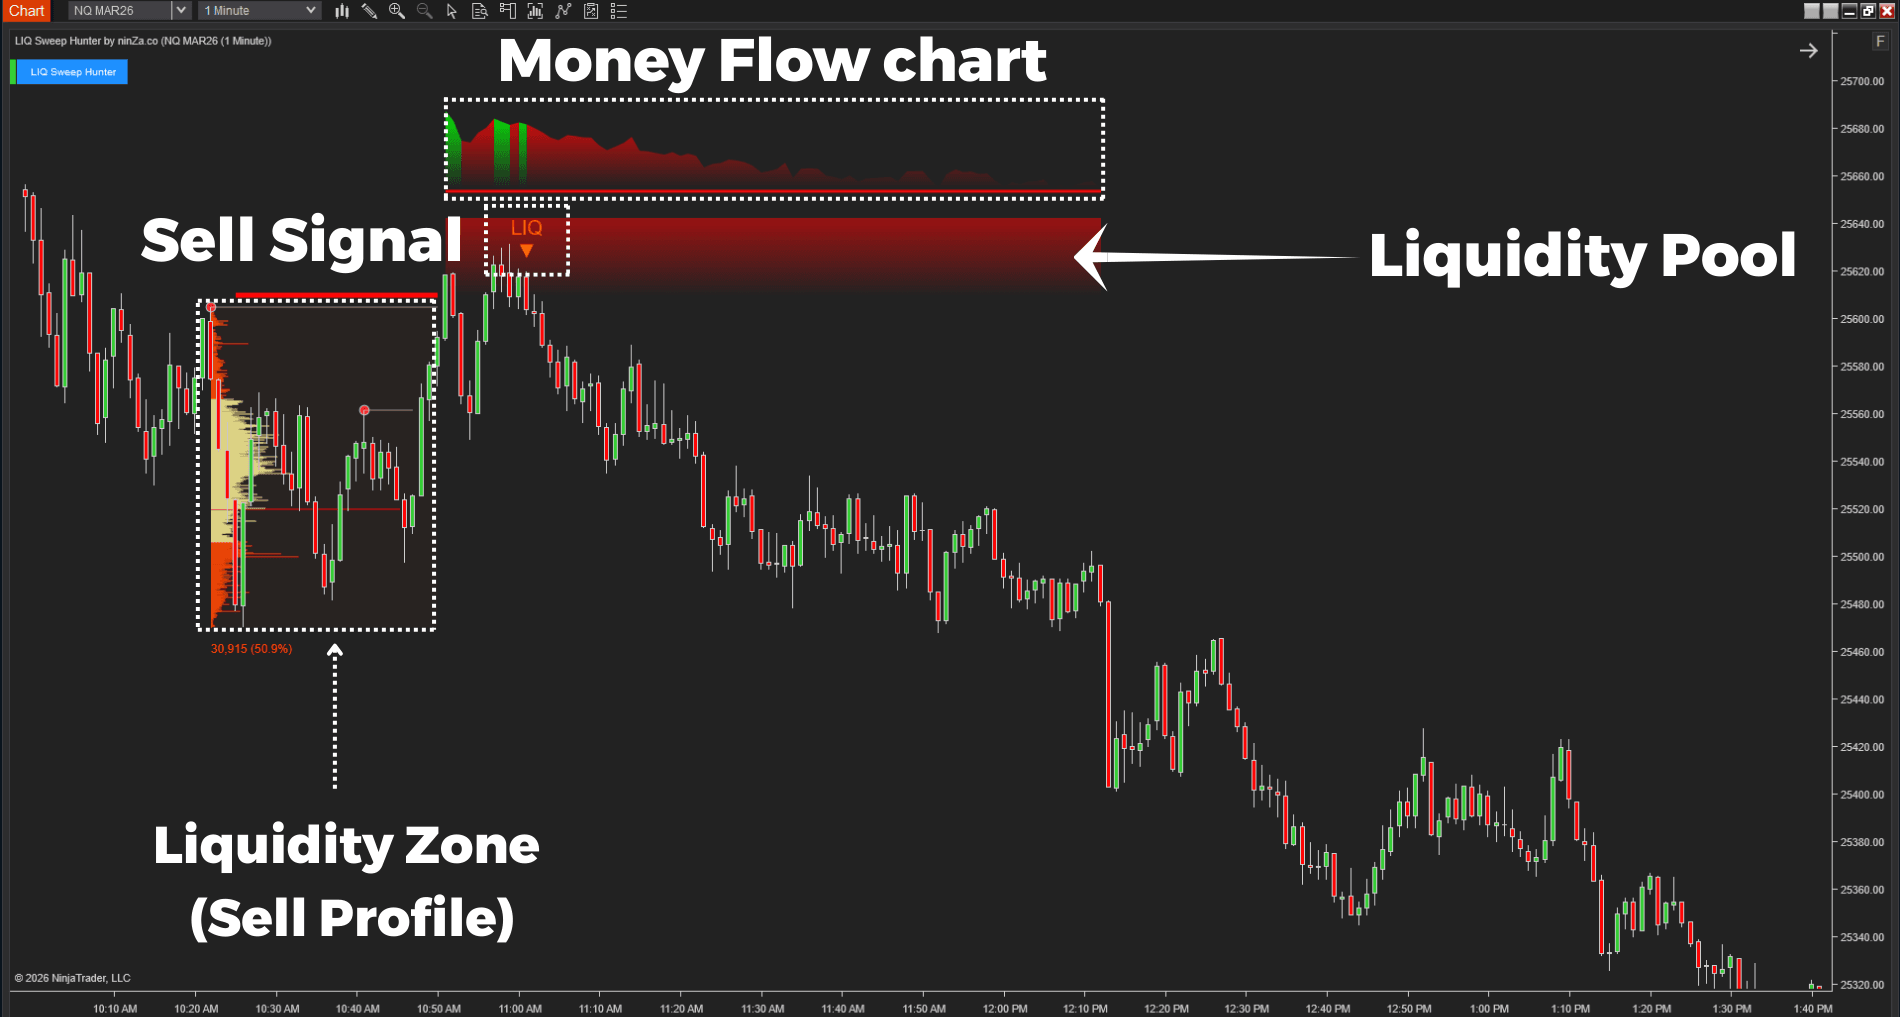
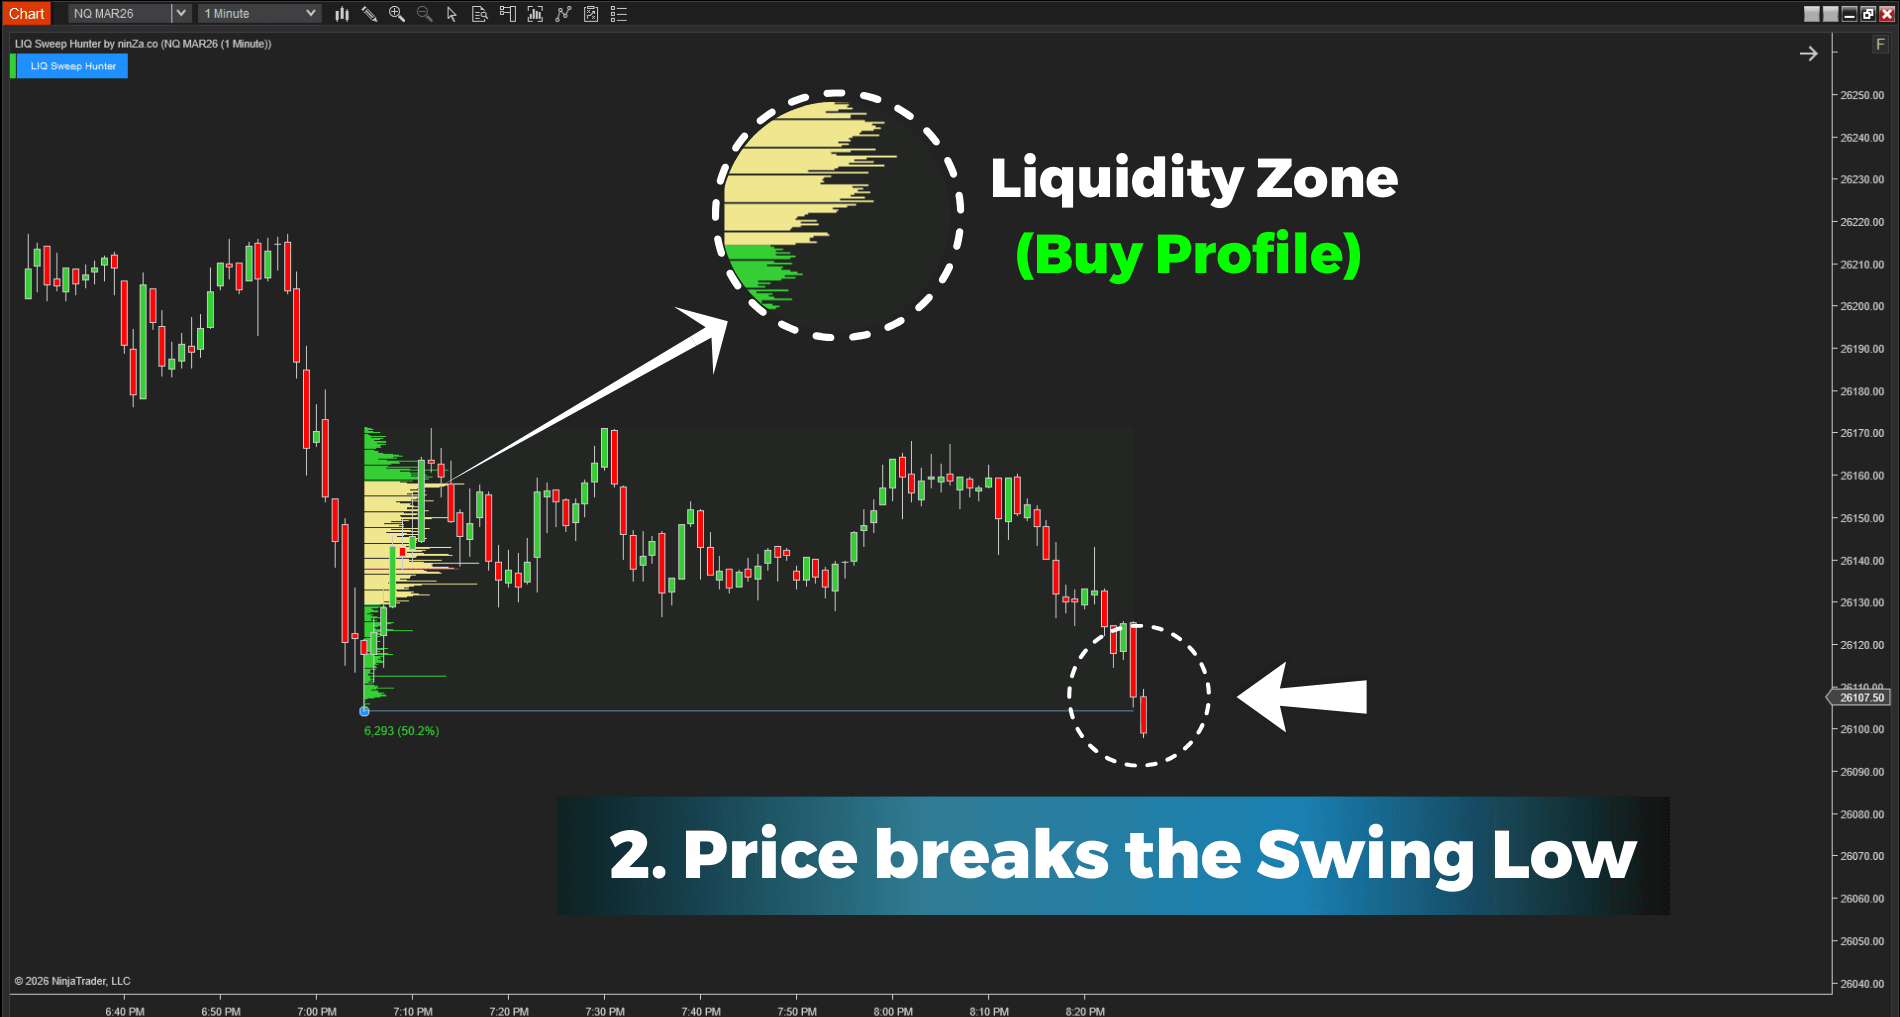
1. Liquidity Zone
Identifies where trading activity is concentrating and which side is dominant. This shows where participation is expanding, not just where price is ticking.
2. Money Flow analysis
Tracks order flow behavior within the Liquidity Pool:
- Is control shifting between buyers and sellers?
- Is initiative flow strengthening or fading?
Mode 2 – Counter Direction
(Designed for swing traders who aim to position around major structural reversals)
Where Significant Liquidity accumulates
The Counter Direction model shifts the focus outward — to significant swing highs and lows that previously drove strong directional moves.
These are structural reference points, not minor intraday levels. They are areas where:
- Breakout traders initiate positions
- Longer-term stops accumulate
- Early reversal traders attempt to front-run the move
When price revisits these levels, liquidity is concentrated. A break of a major swing does not automatically signal continuation.
The break is information. The reaction is confirmation.
How it works
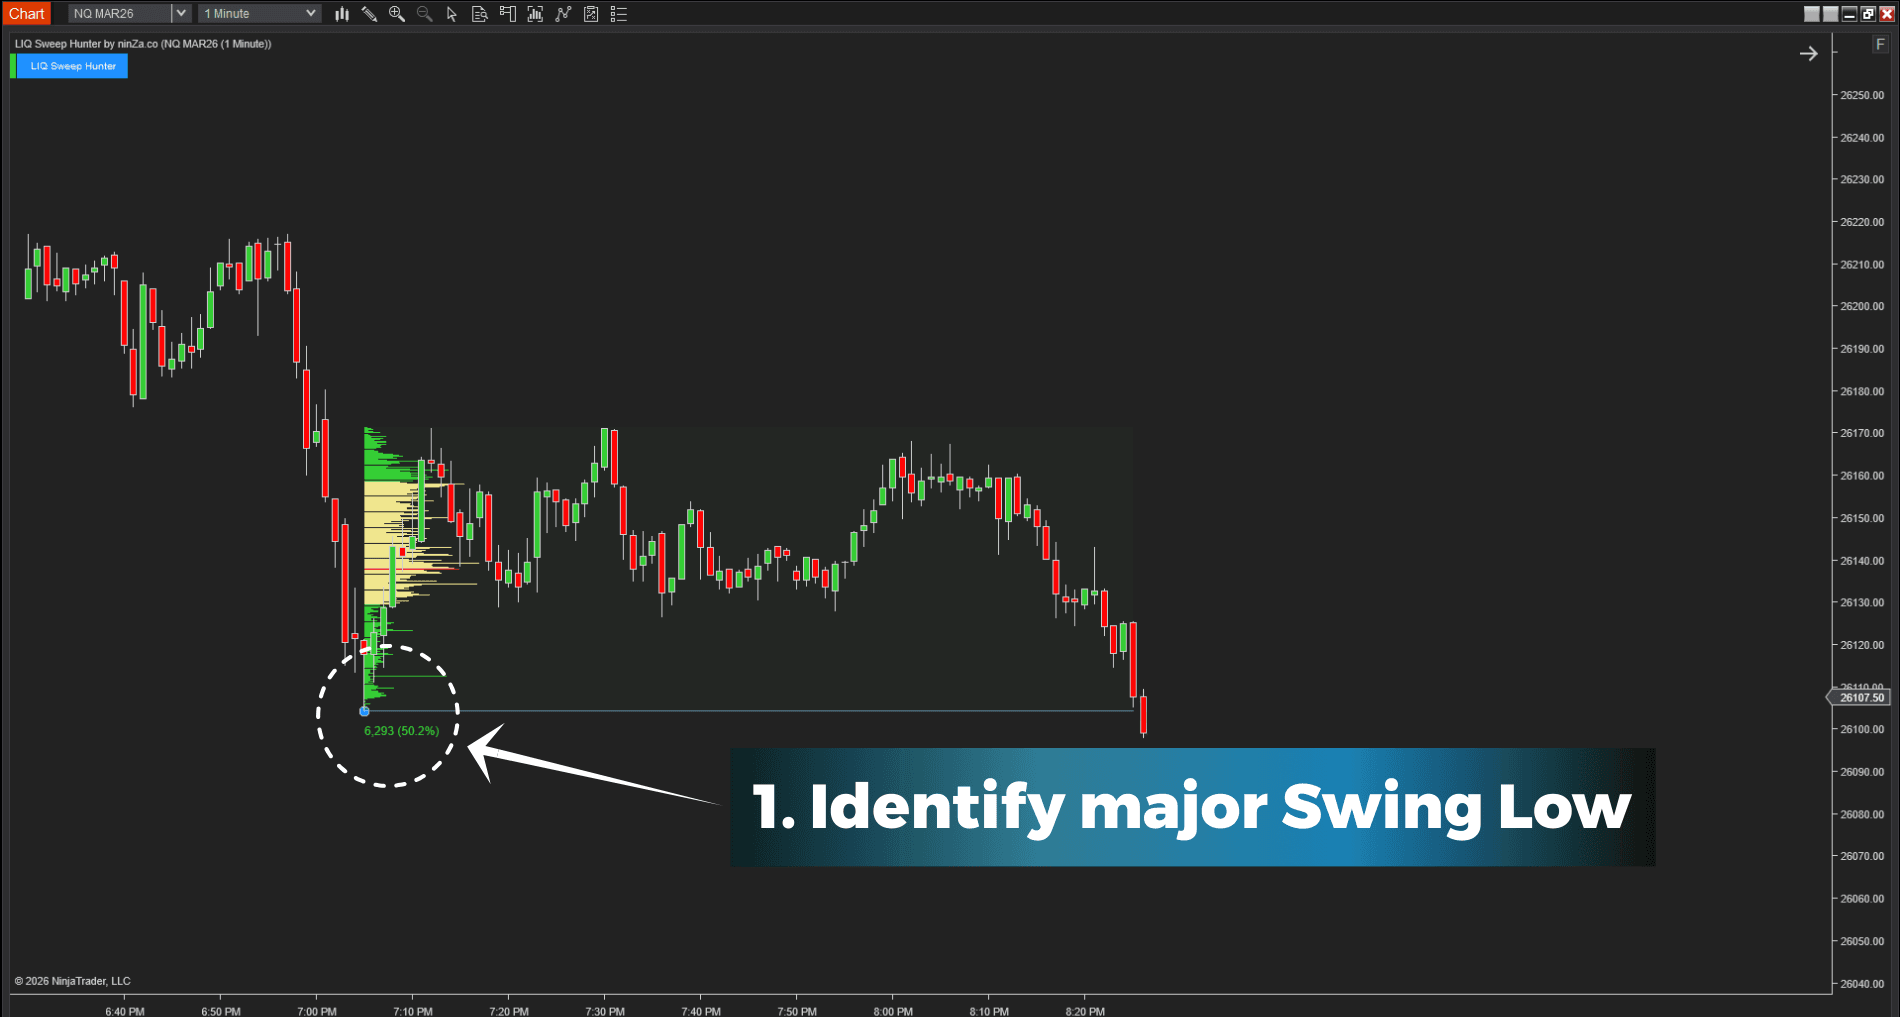
1. Level Projection
The indicator identifies significant historical swing highs/lows and projects them forward as active liquidity levels.
2. Initial Break
Price trades beyond the level, triggering clustered stops. Delta at the break is recorded.
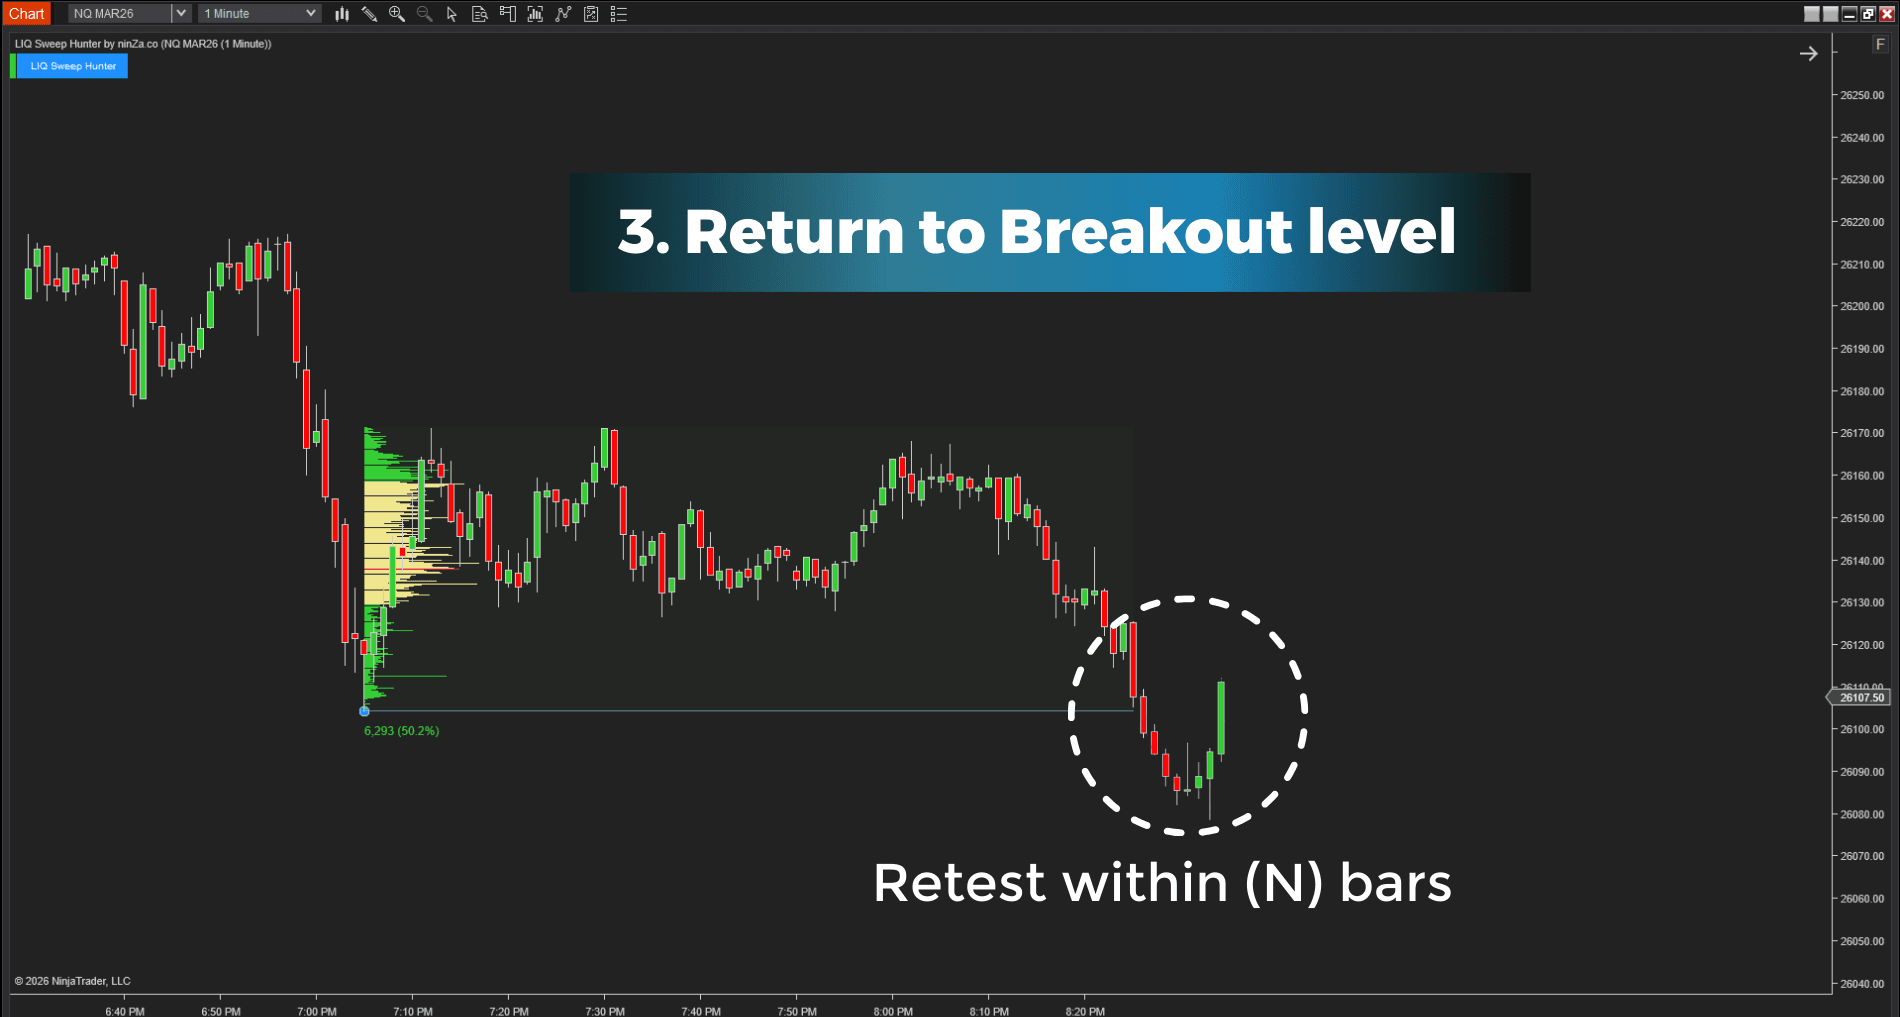
3. Return to Breakout Level
Within a defined number of bars, the price must return to the broken S/R level.
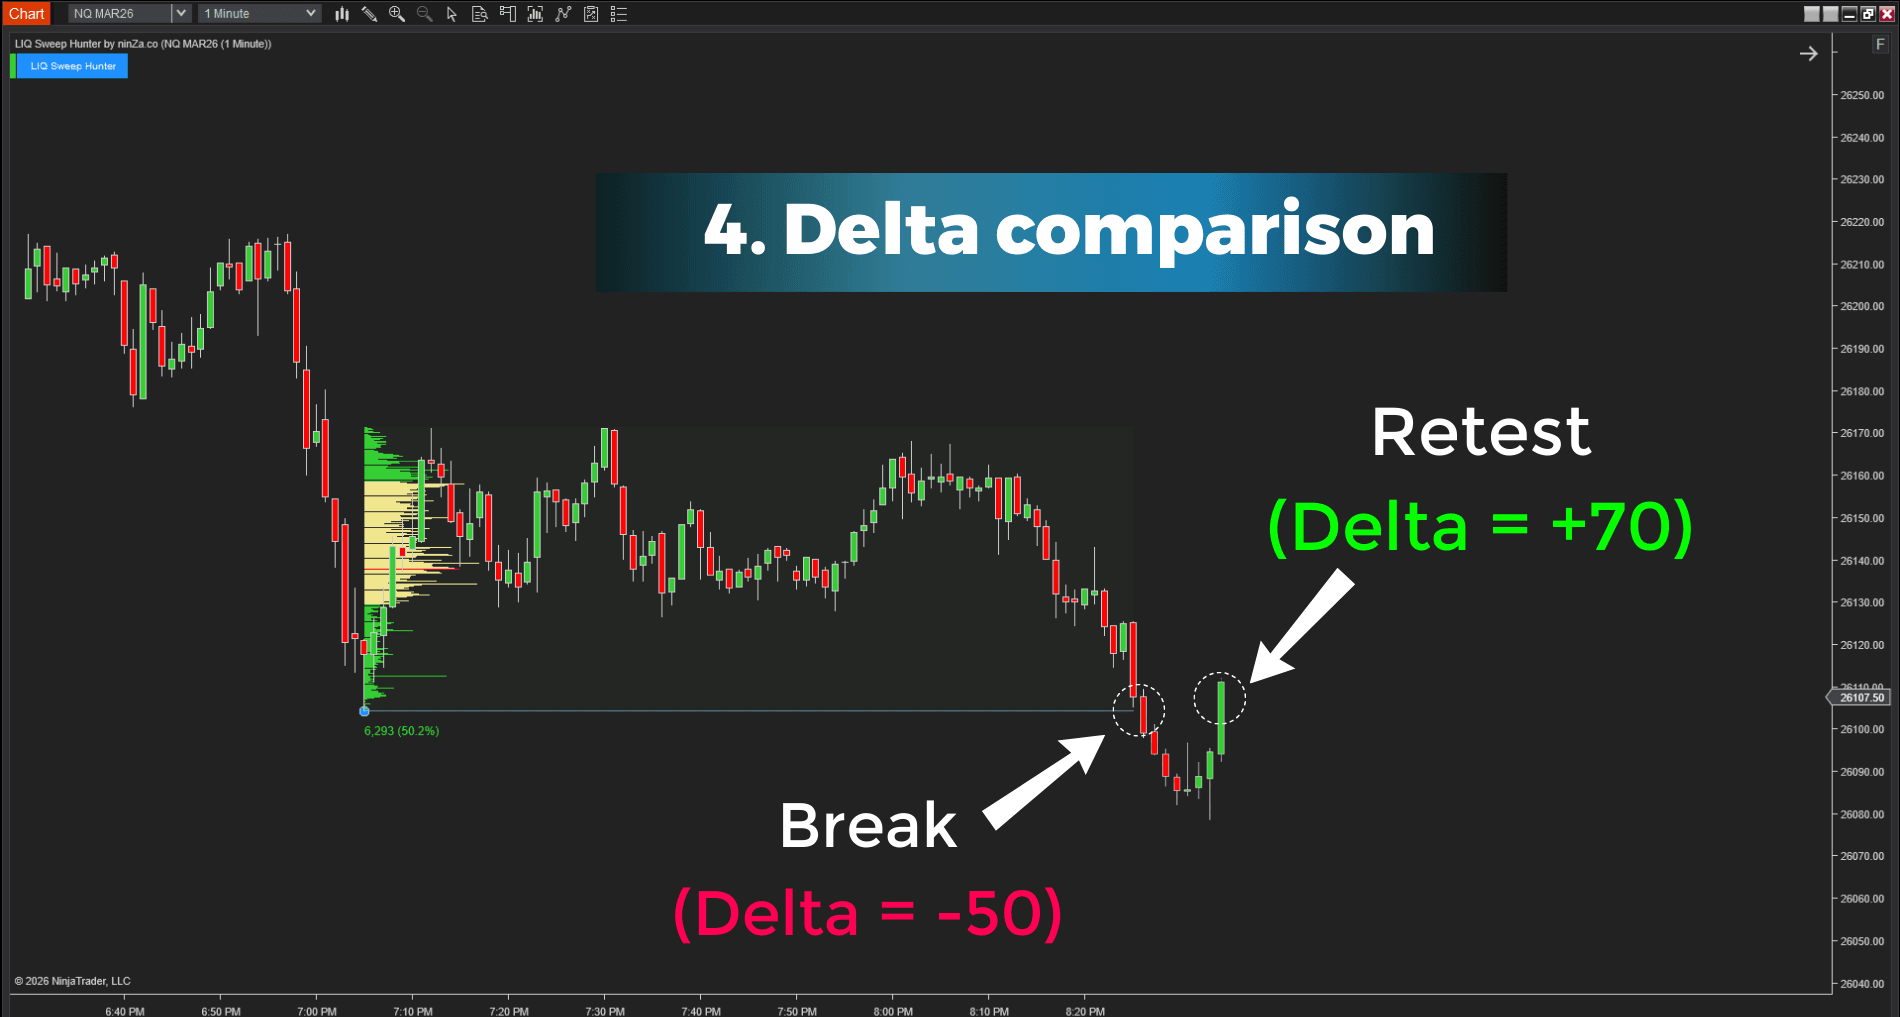
4. Delta Comparison
If Delta on the return opposes the Delta observed during the breakout, the move is more likely a reversal than true continuation.
🎬 Webinar Replay: Automating a multi-timeframe Liquidity Sweep strategy
In this replay, Harry shows how traders can identify meaningful liquidity sweeps in live markets and filter out weaker signals.
He introduces a multi-confirmation approach using swing points, trailing stop behavior, price action structure, delta shifts, and three-timeframe confirmation.
You’ll also see how the process can be automated and how the signals appear across markets like ES, NQ, CL, and GC on different chart types.
Get LIQ Sweep Hunter @ Only $300 today ↓
Watch LIQ Sweep Hunter detect Stop Runs LIVE
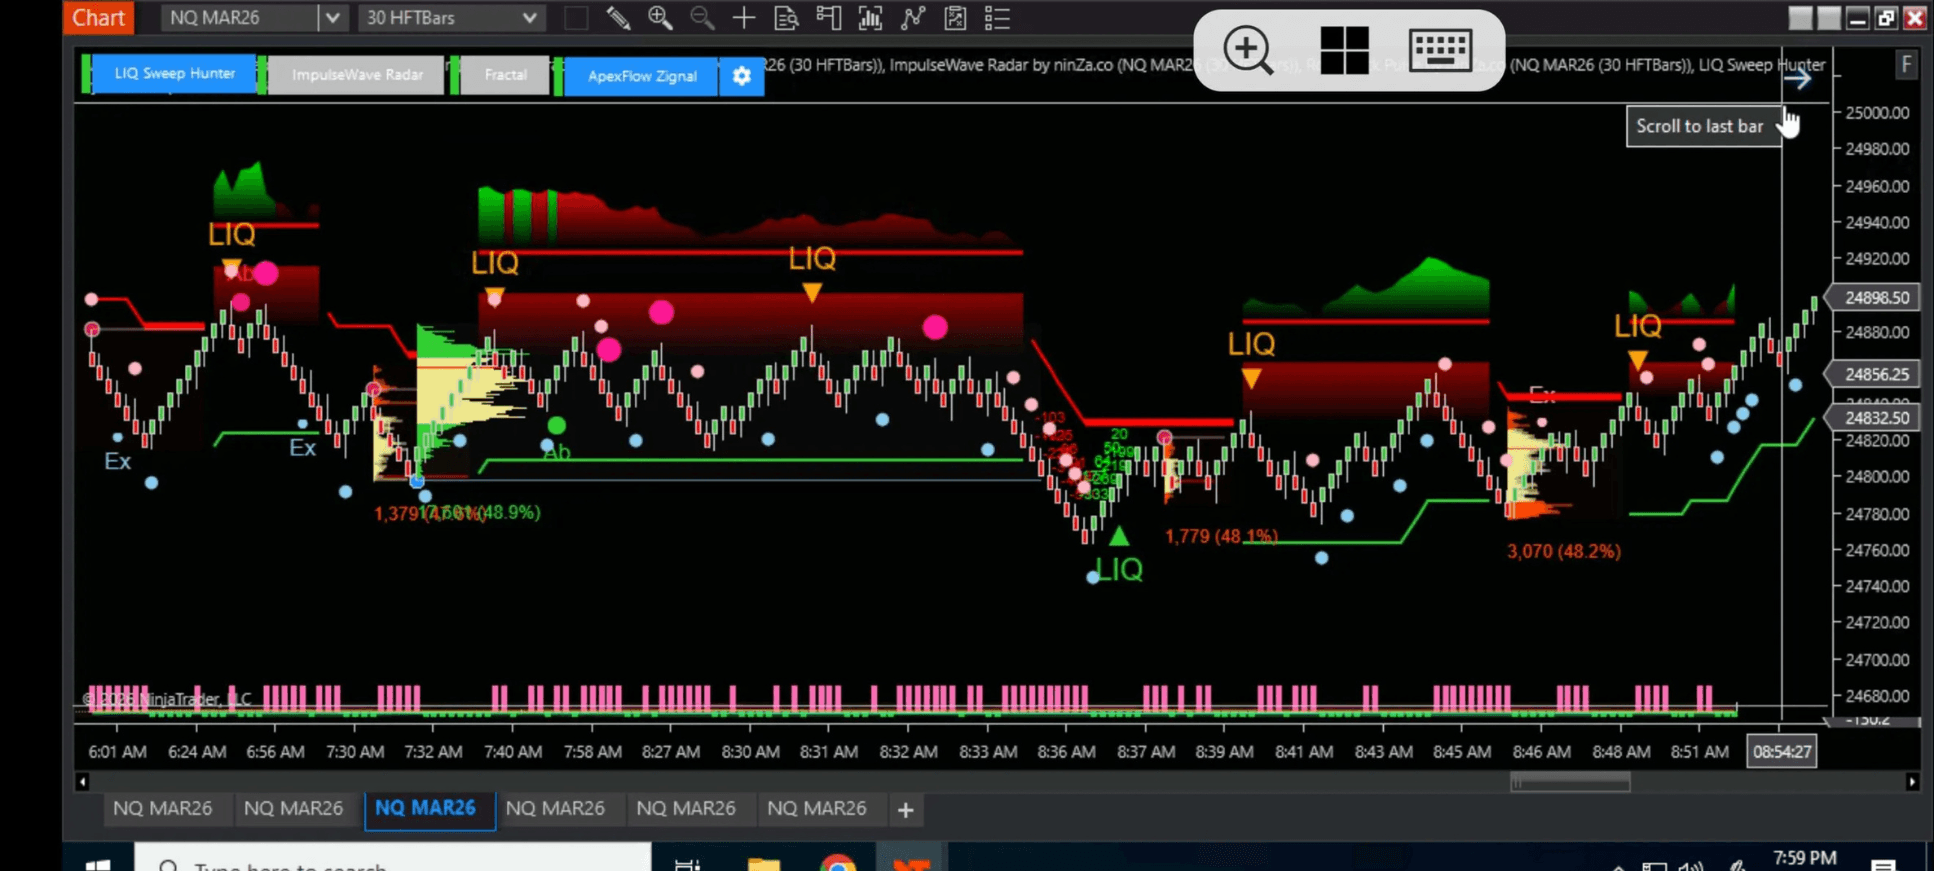
In this video, Harry showcases a live 100-tick chart session using LIQ Sweep Hunter. It also shows:
- How liquidity sweeps occur not only at major swing levels but also within short-term market moves
- How to detect hidden liquidity in these smaller swings to reduce stop hunts and improve trade performance
In this session, Harry demonstrates a trading strategy that combines LIQ Sweep Hunter with multi-timeframe trend analysis to filter signals and improve trade quality.
The setup is simple and follows a clear checklist.
In this demo, the strategy achieved 18 wins out of 24 trades (~75% win rate).
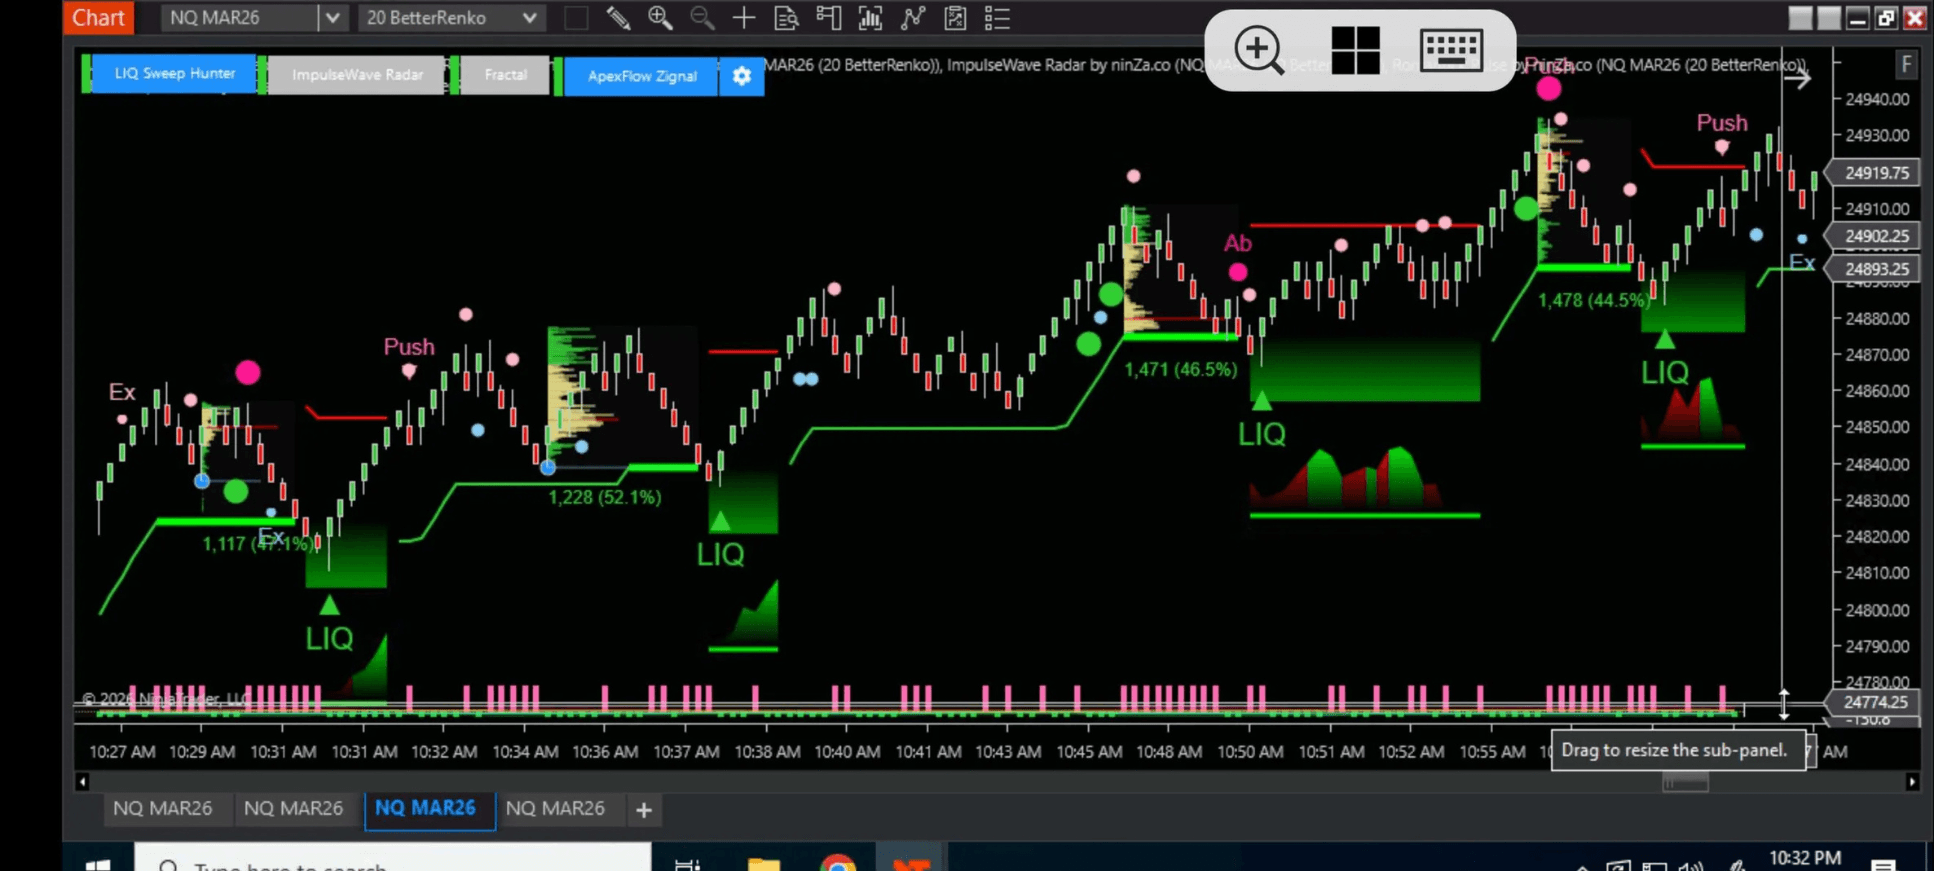
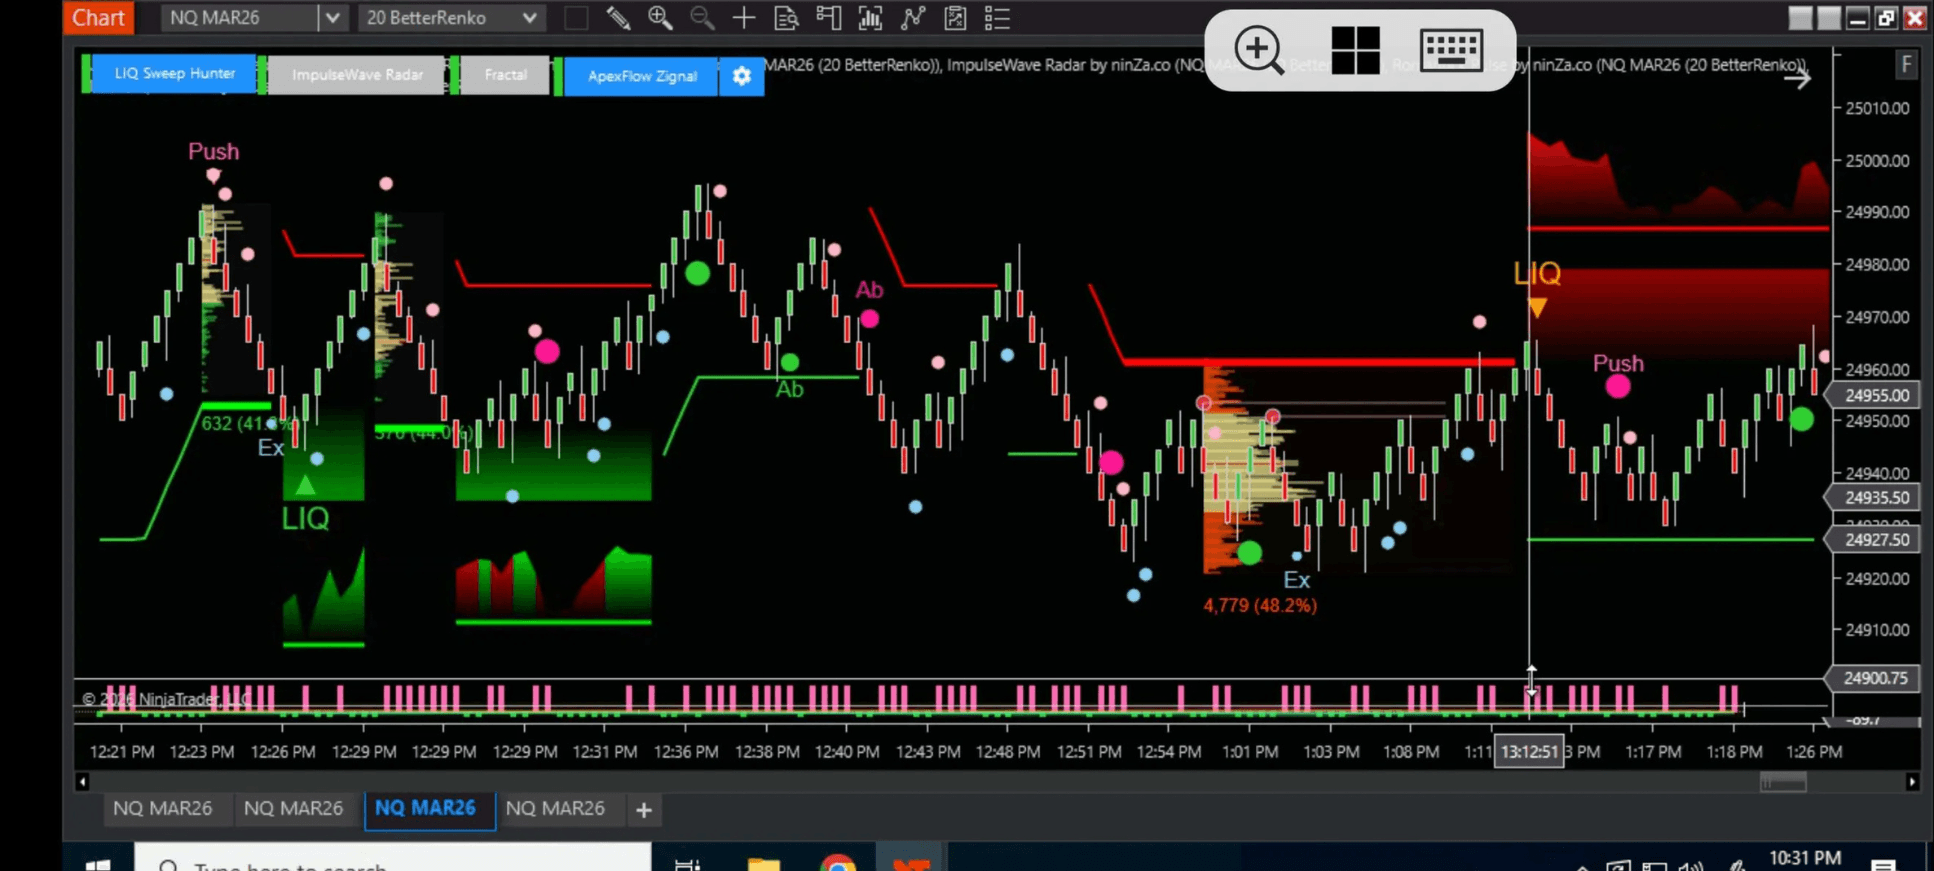
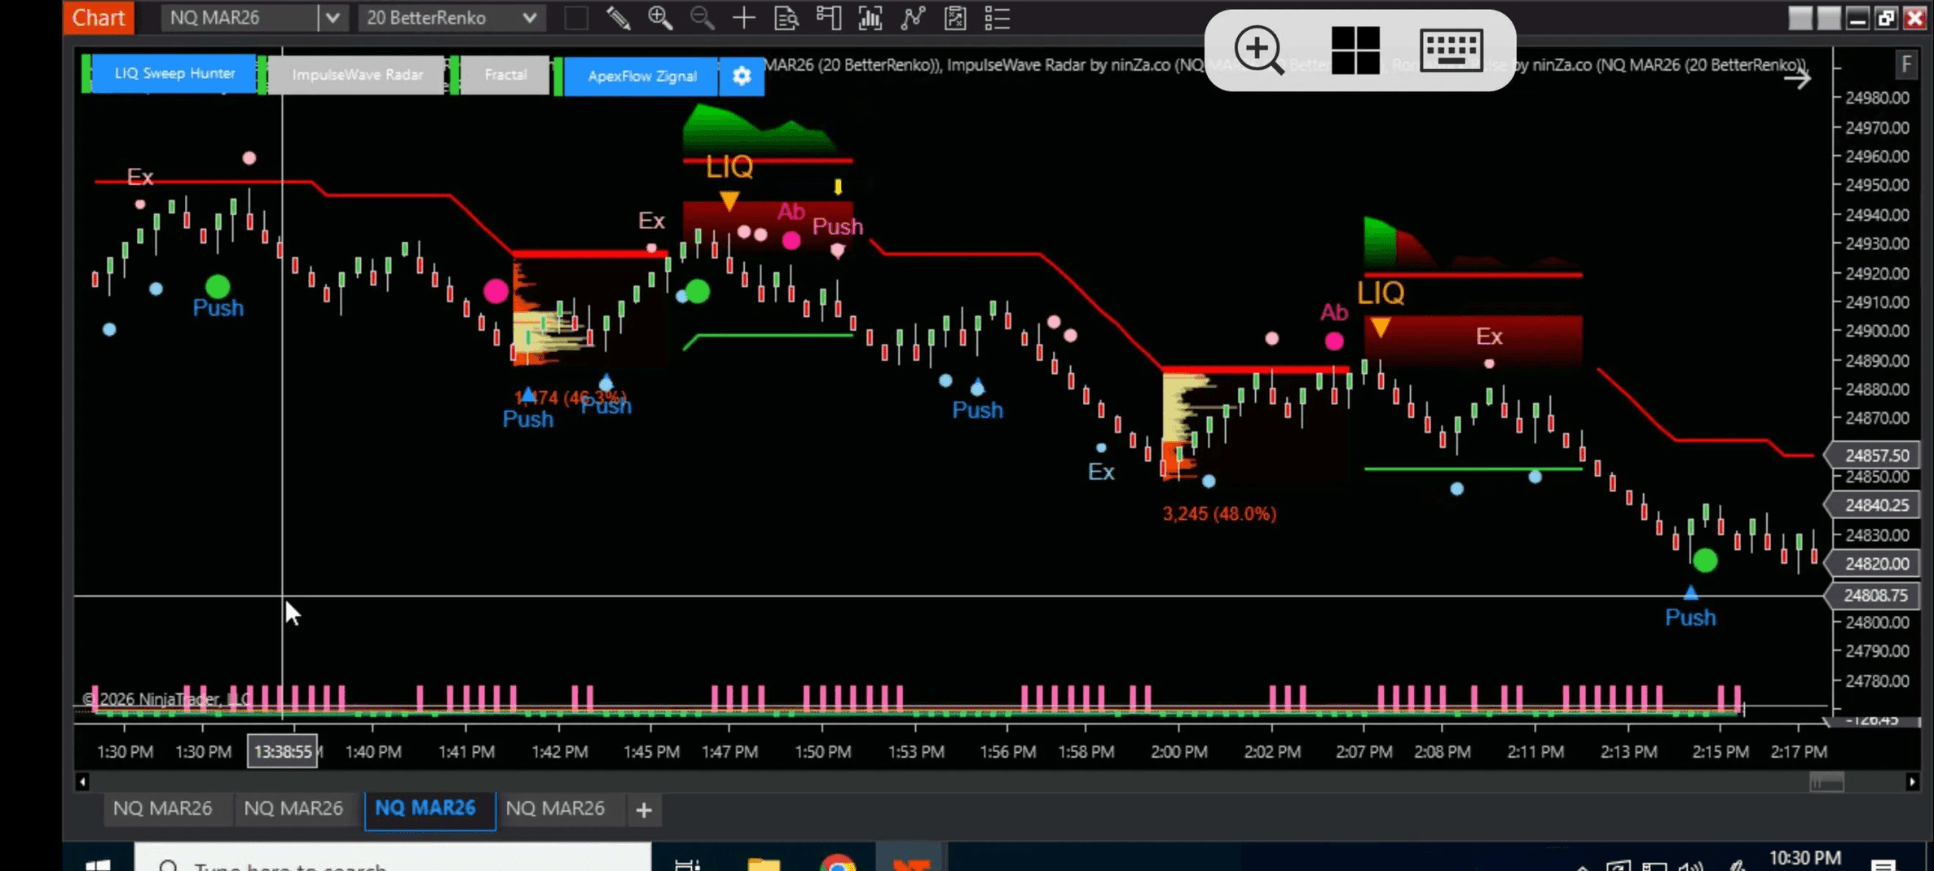
In the video, Harry trades LIQ Sweep Hunter live across 2 different environments – a Tick chart during the US session and a Renko chart during the Asian session – to evaluate how it performs across different time structures and market conditions.
Watch the full session below to review the execution and results in both market sessions.
Secure LIQ Sweep Hunter @ Only $300 today ↓
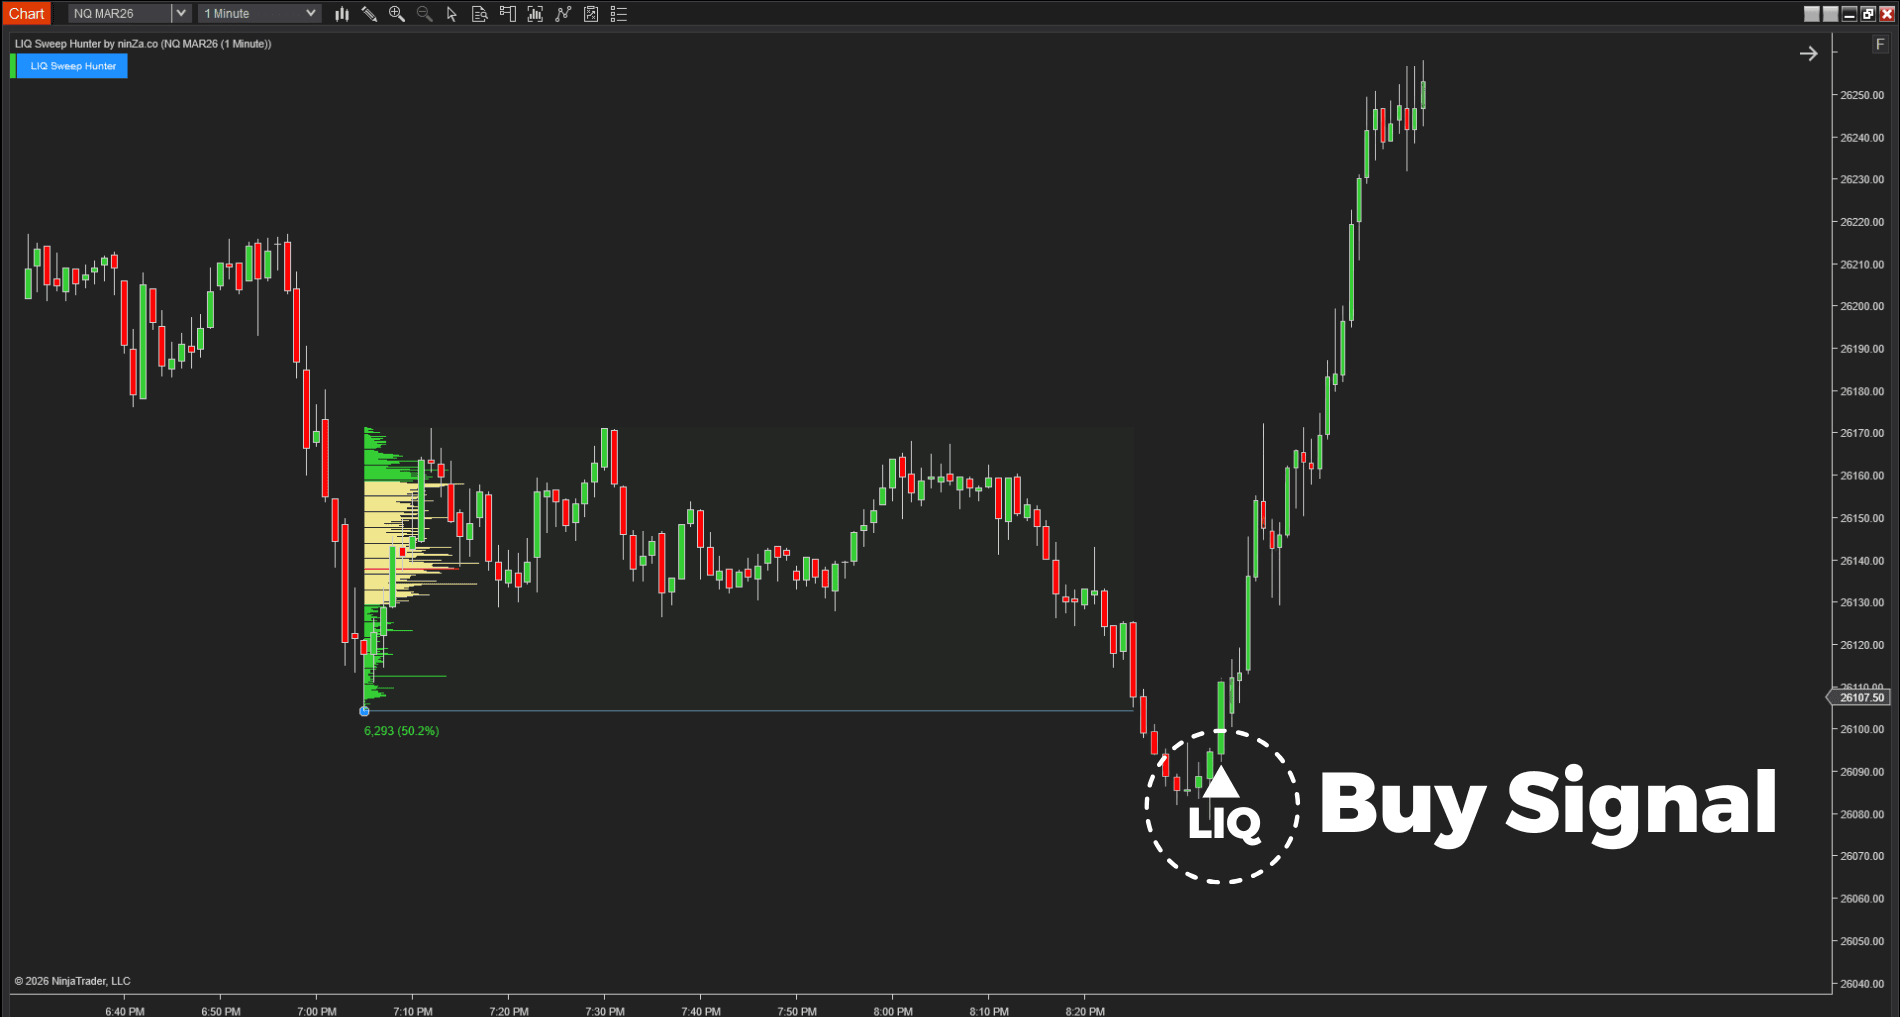
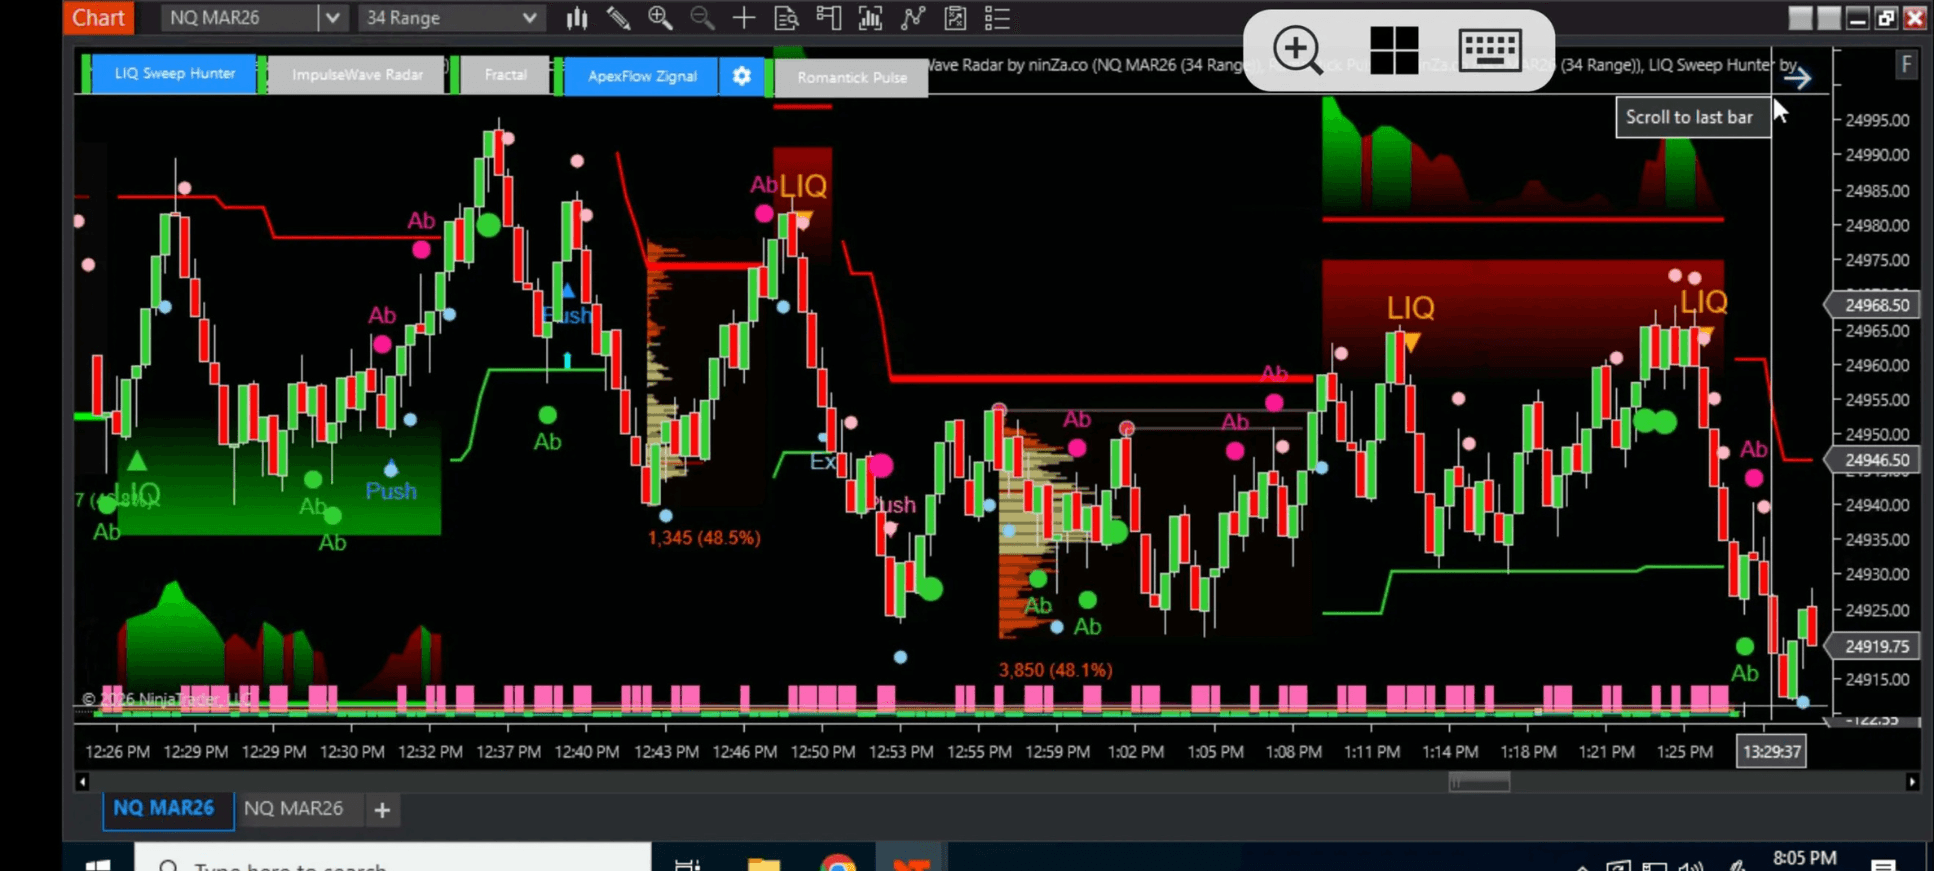
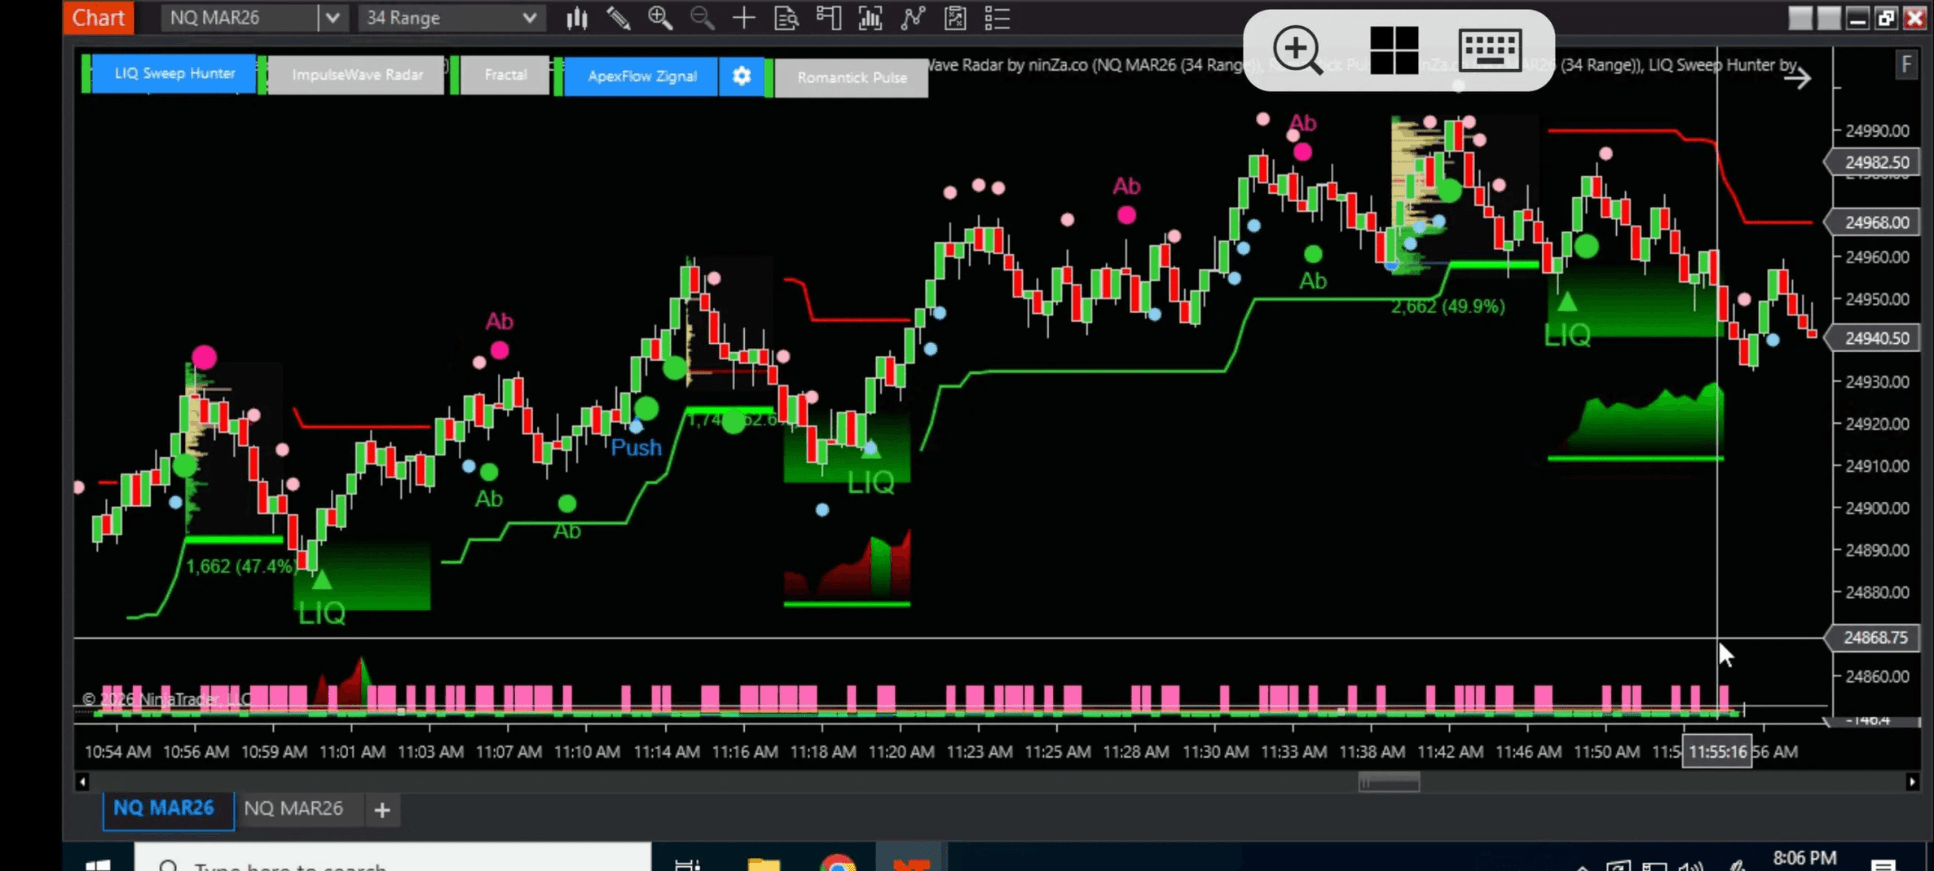
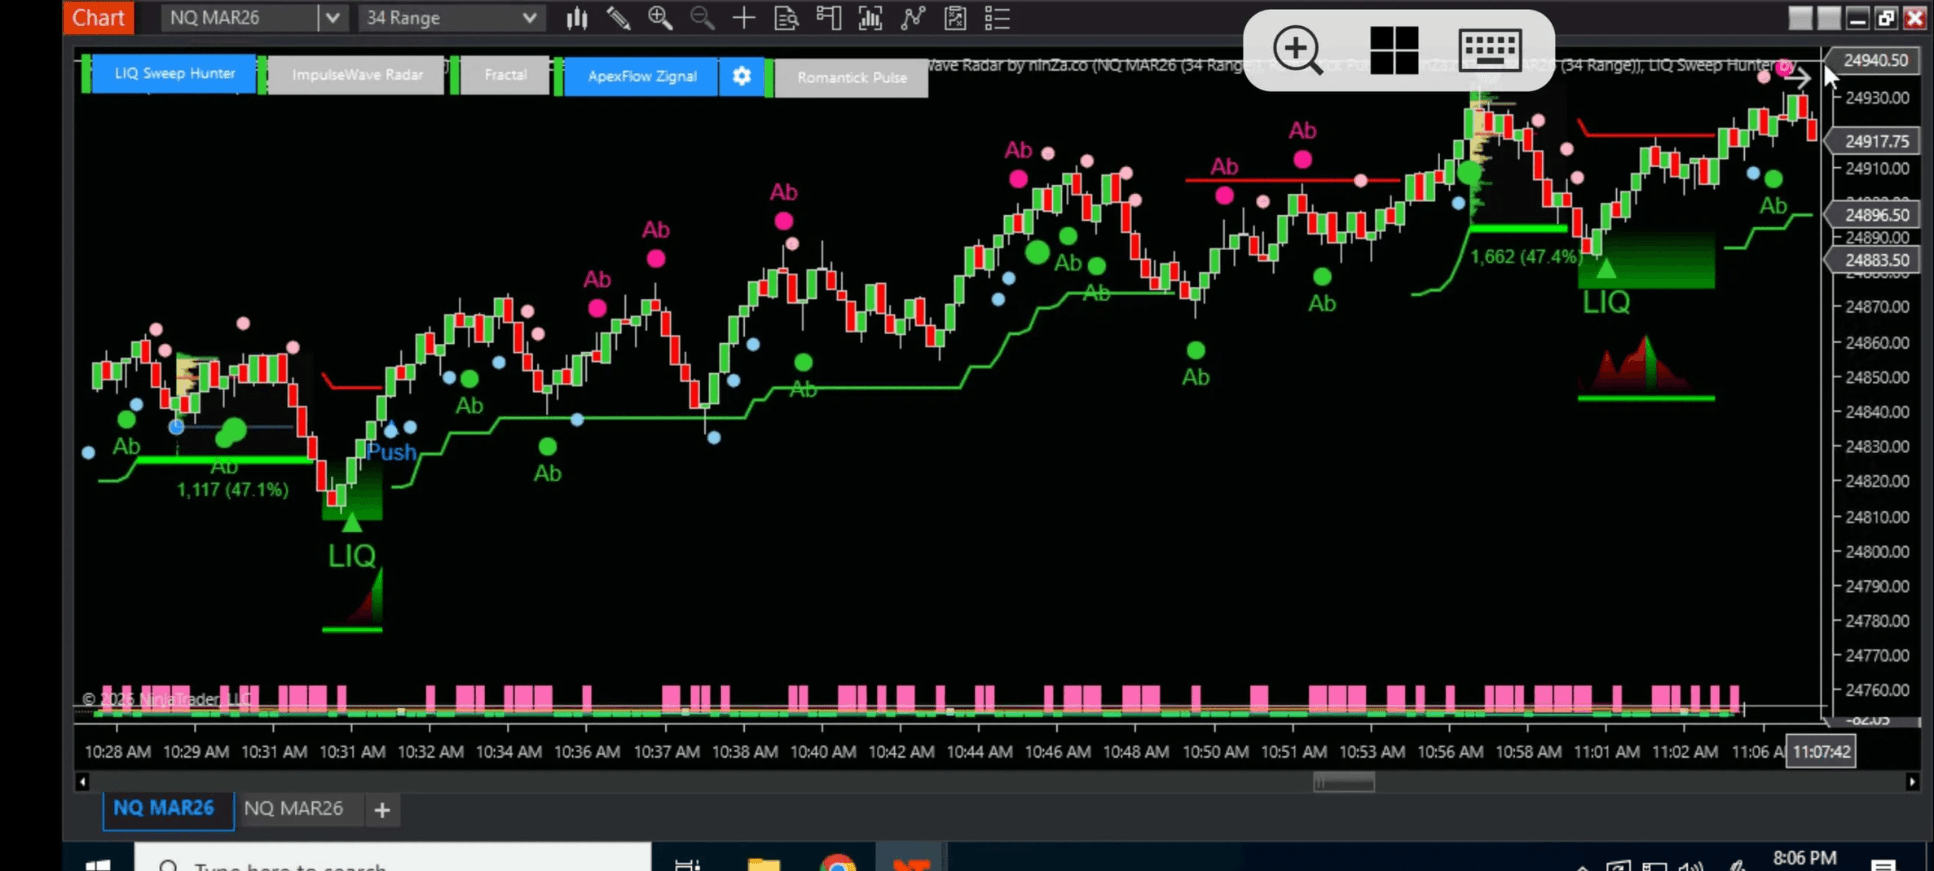
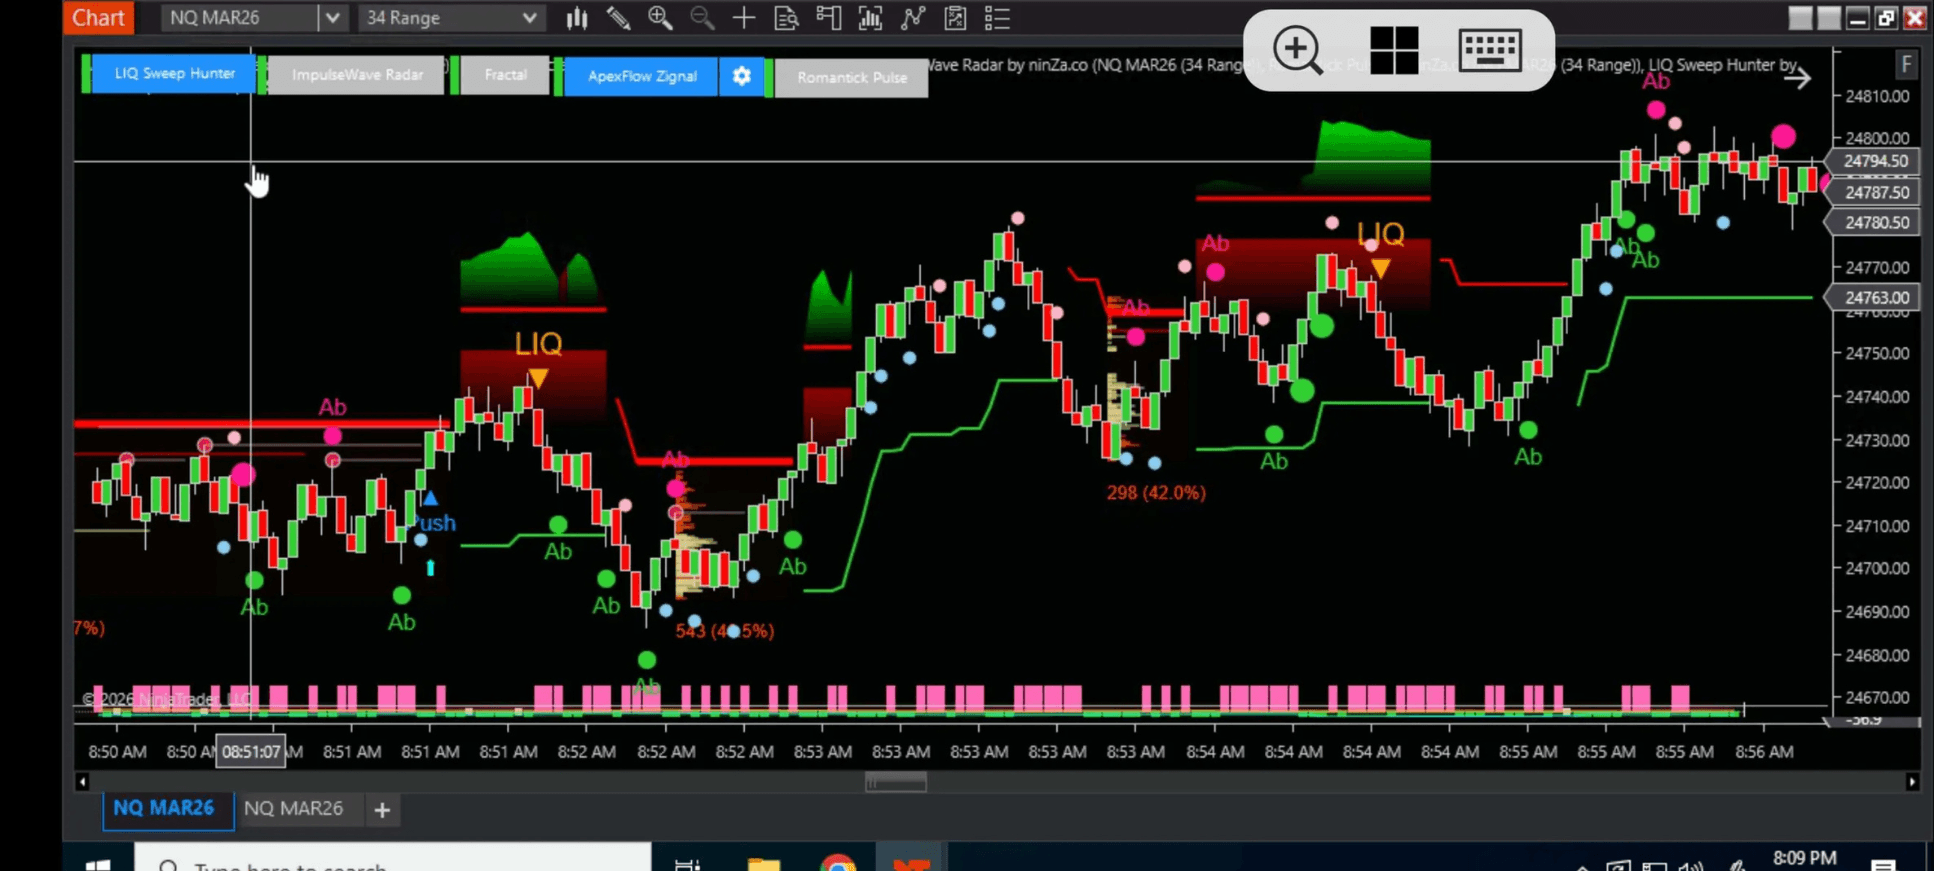
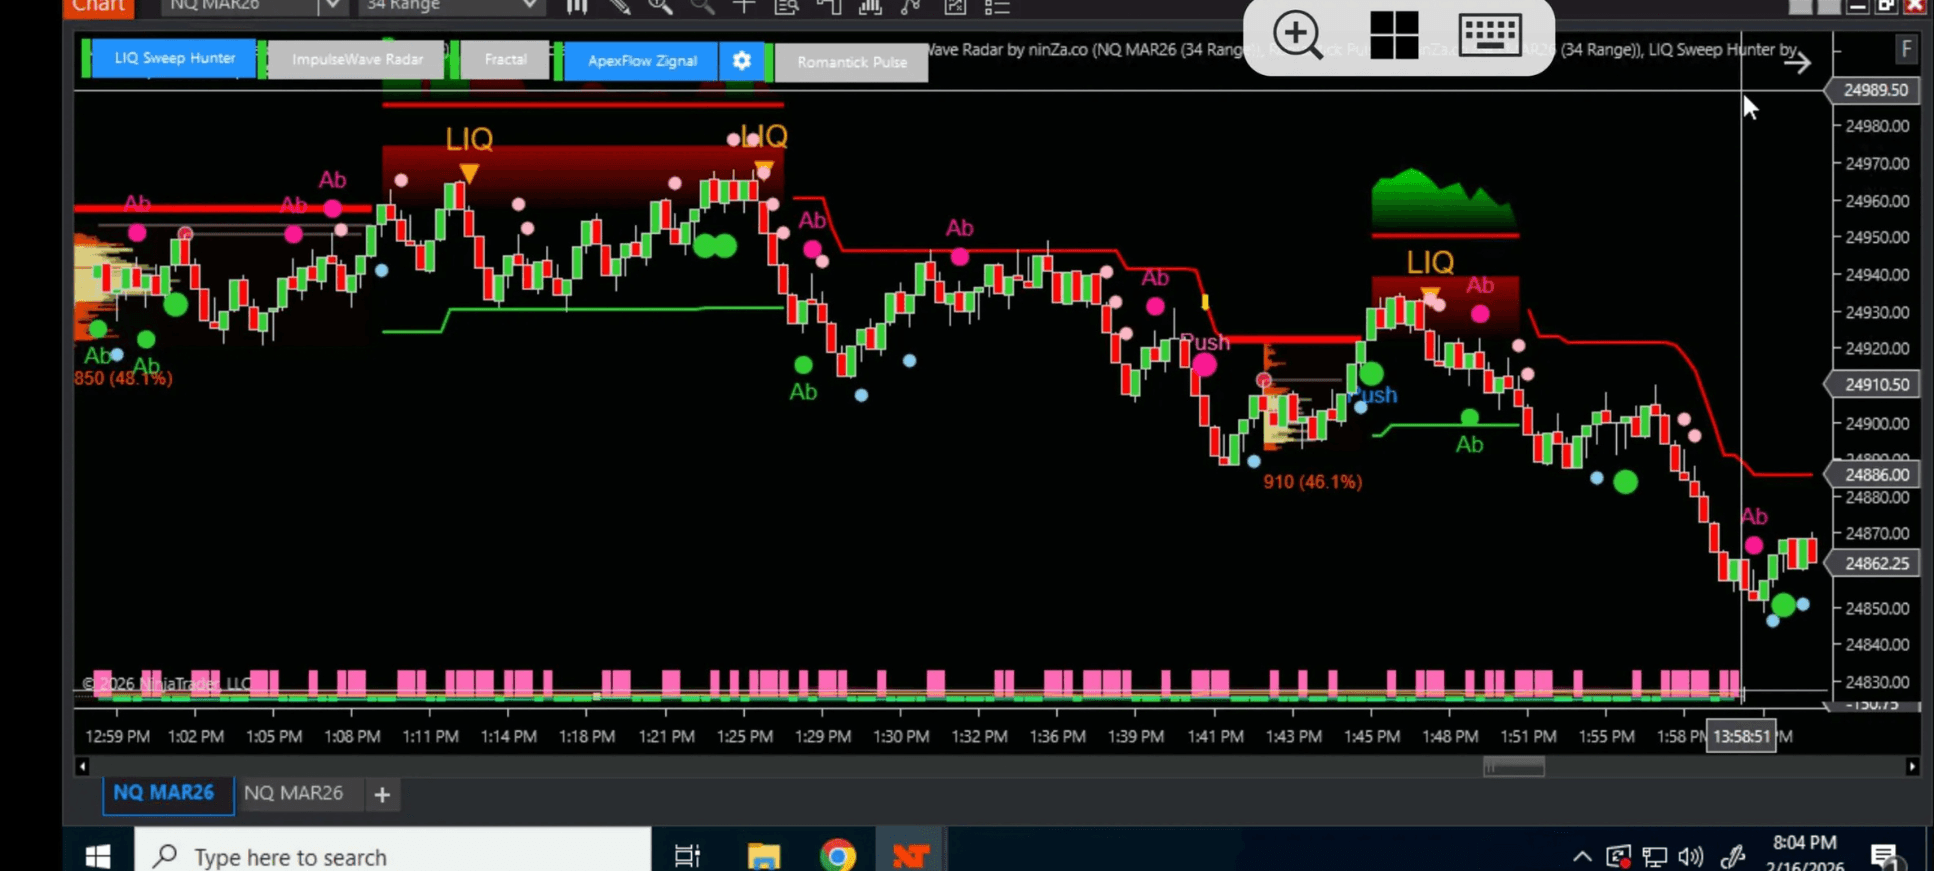
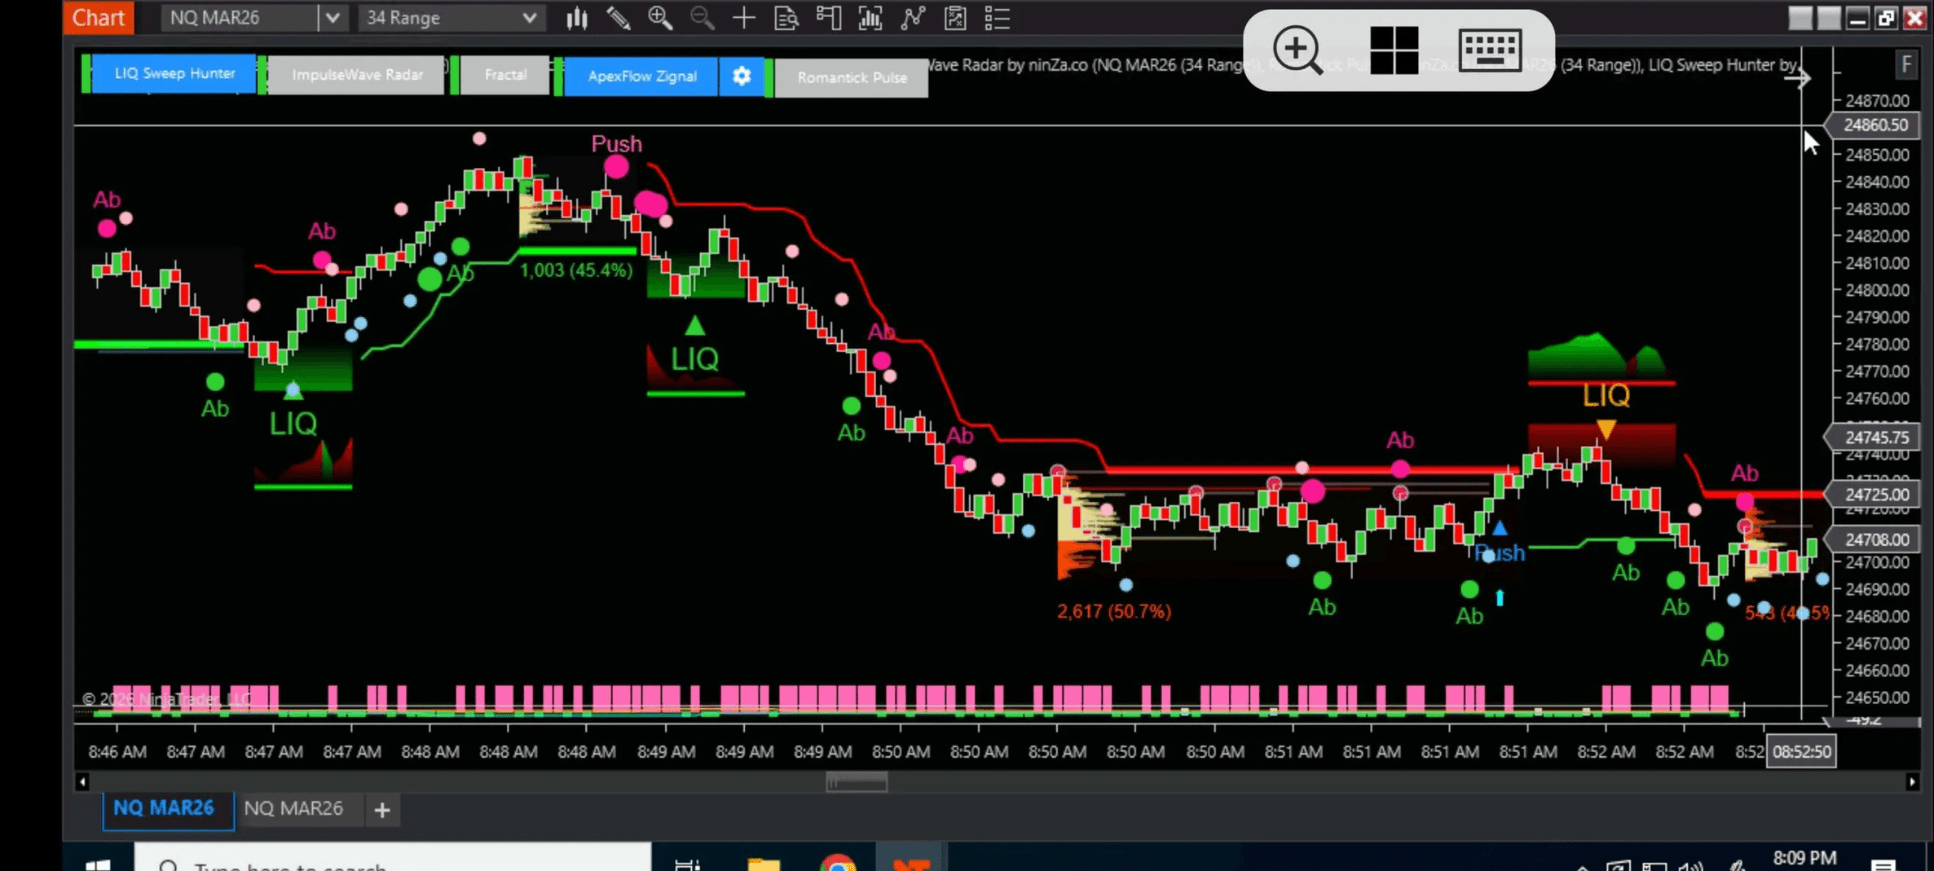
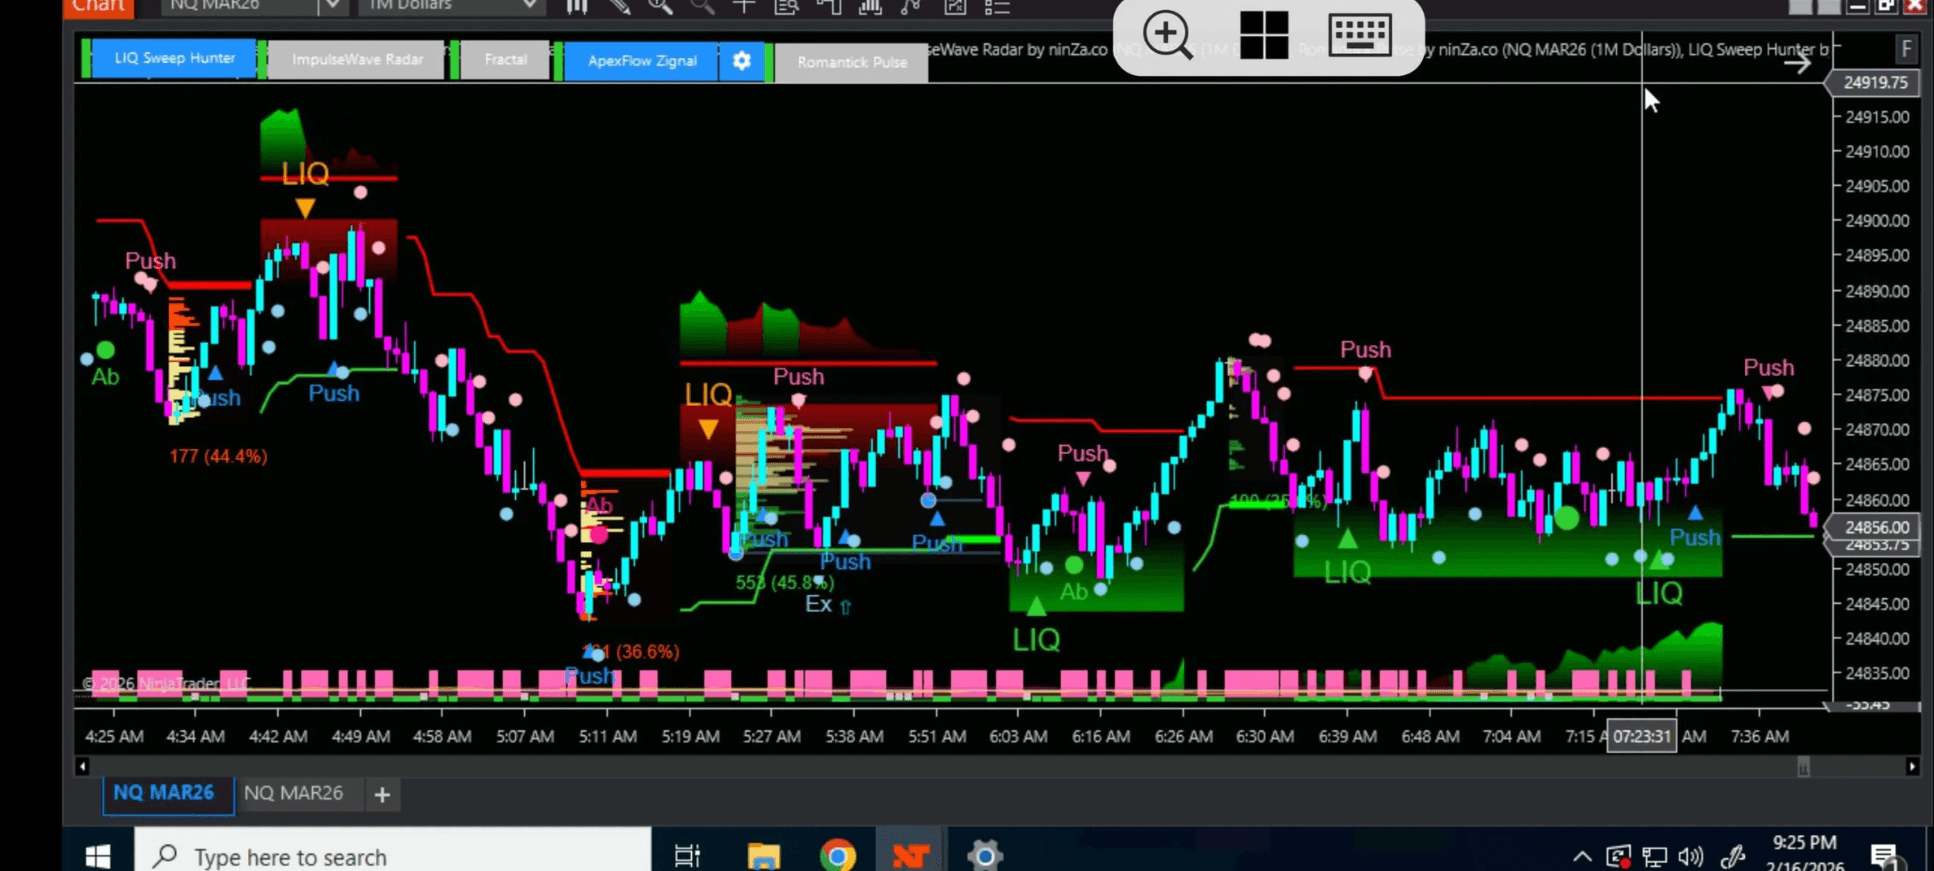
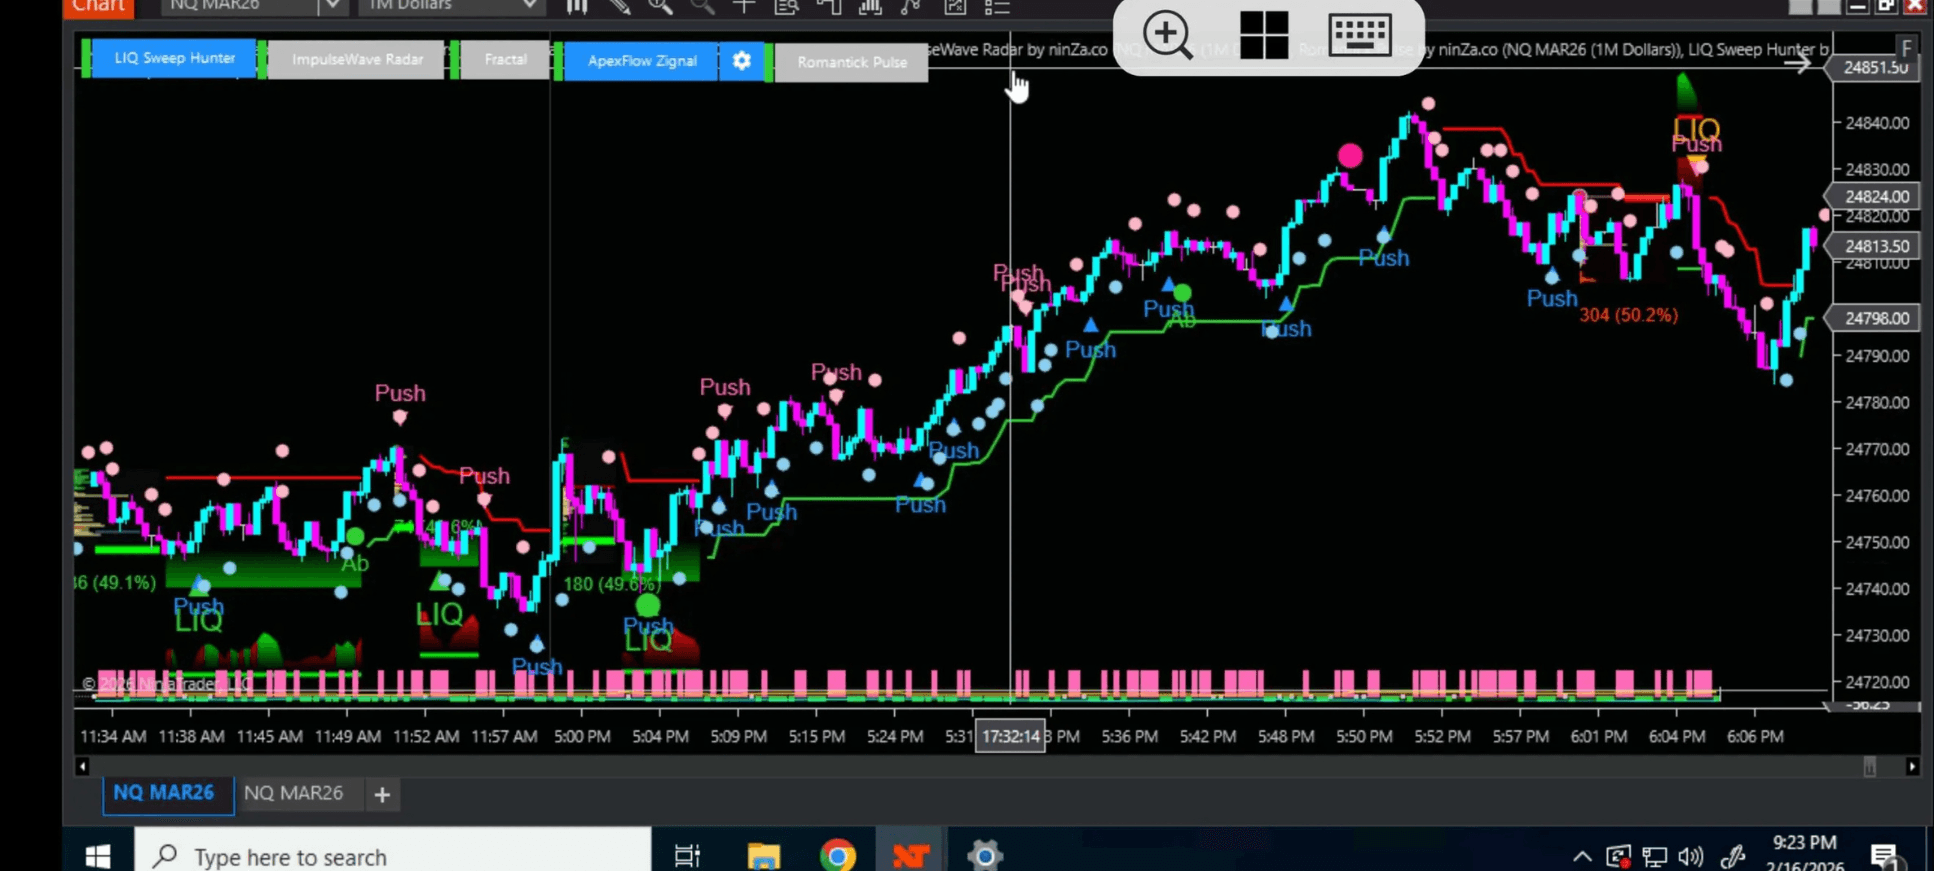
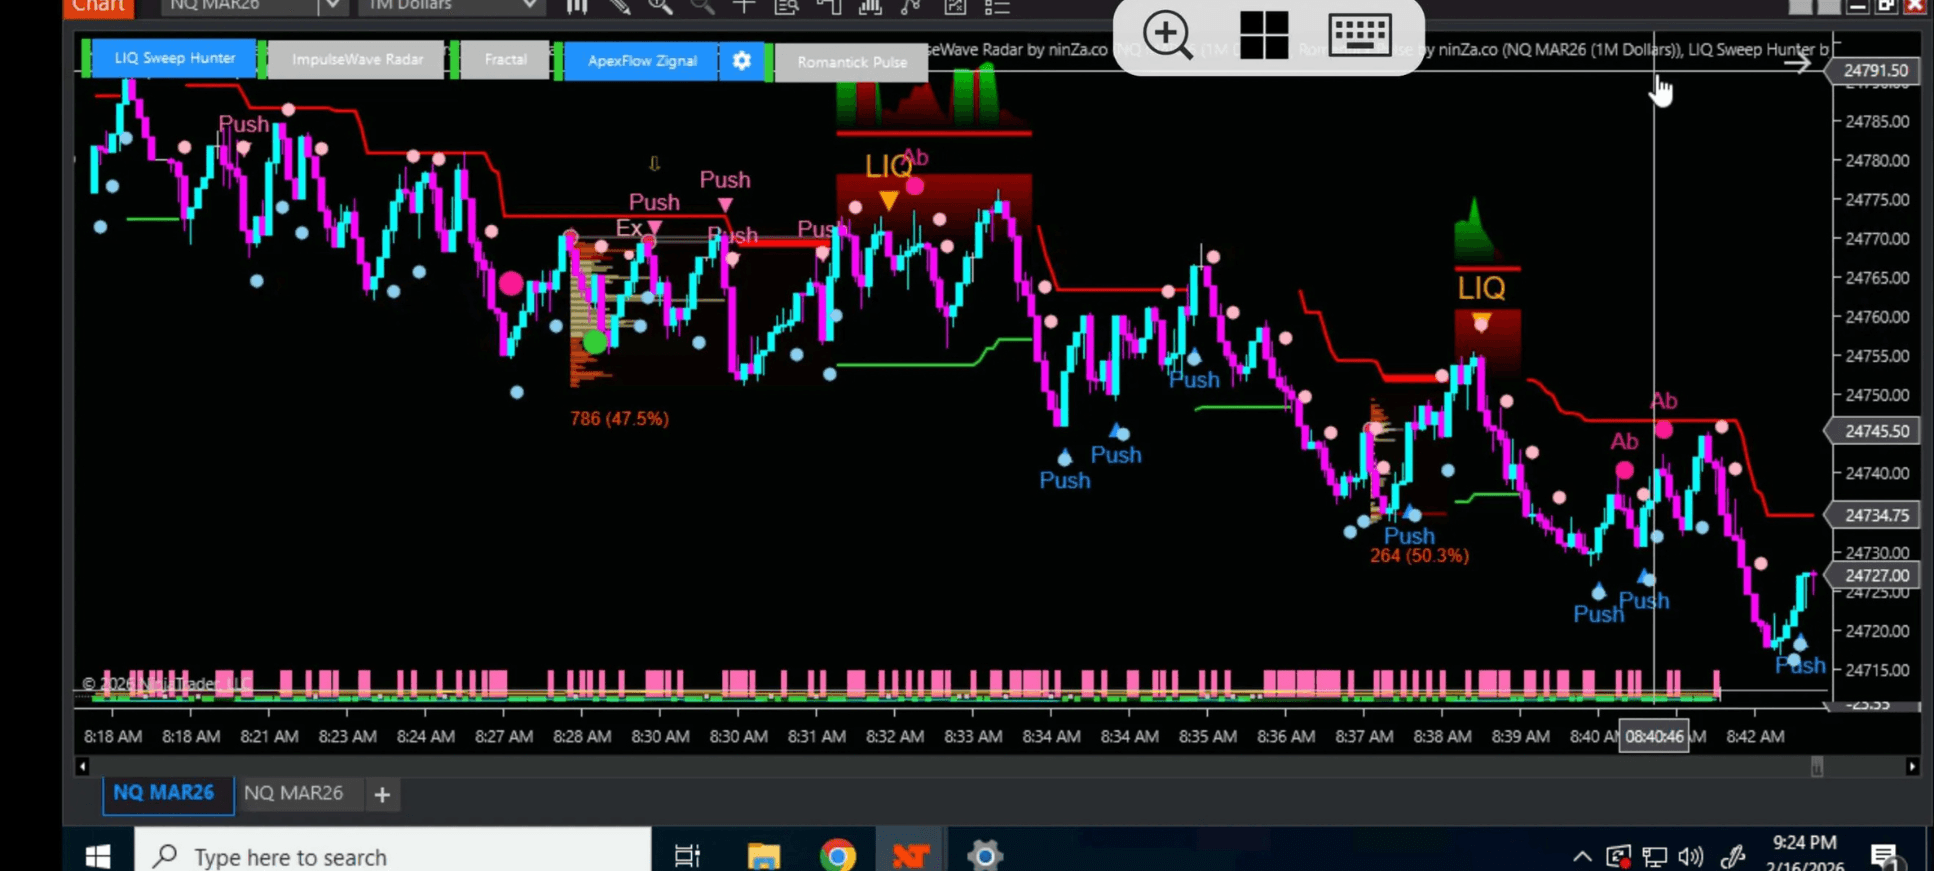
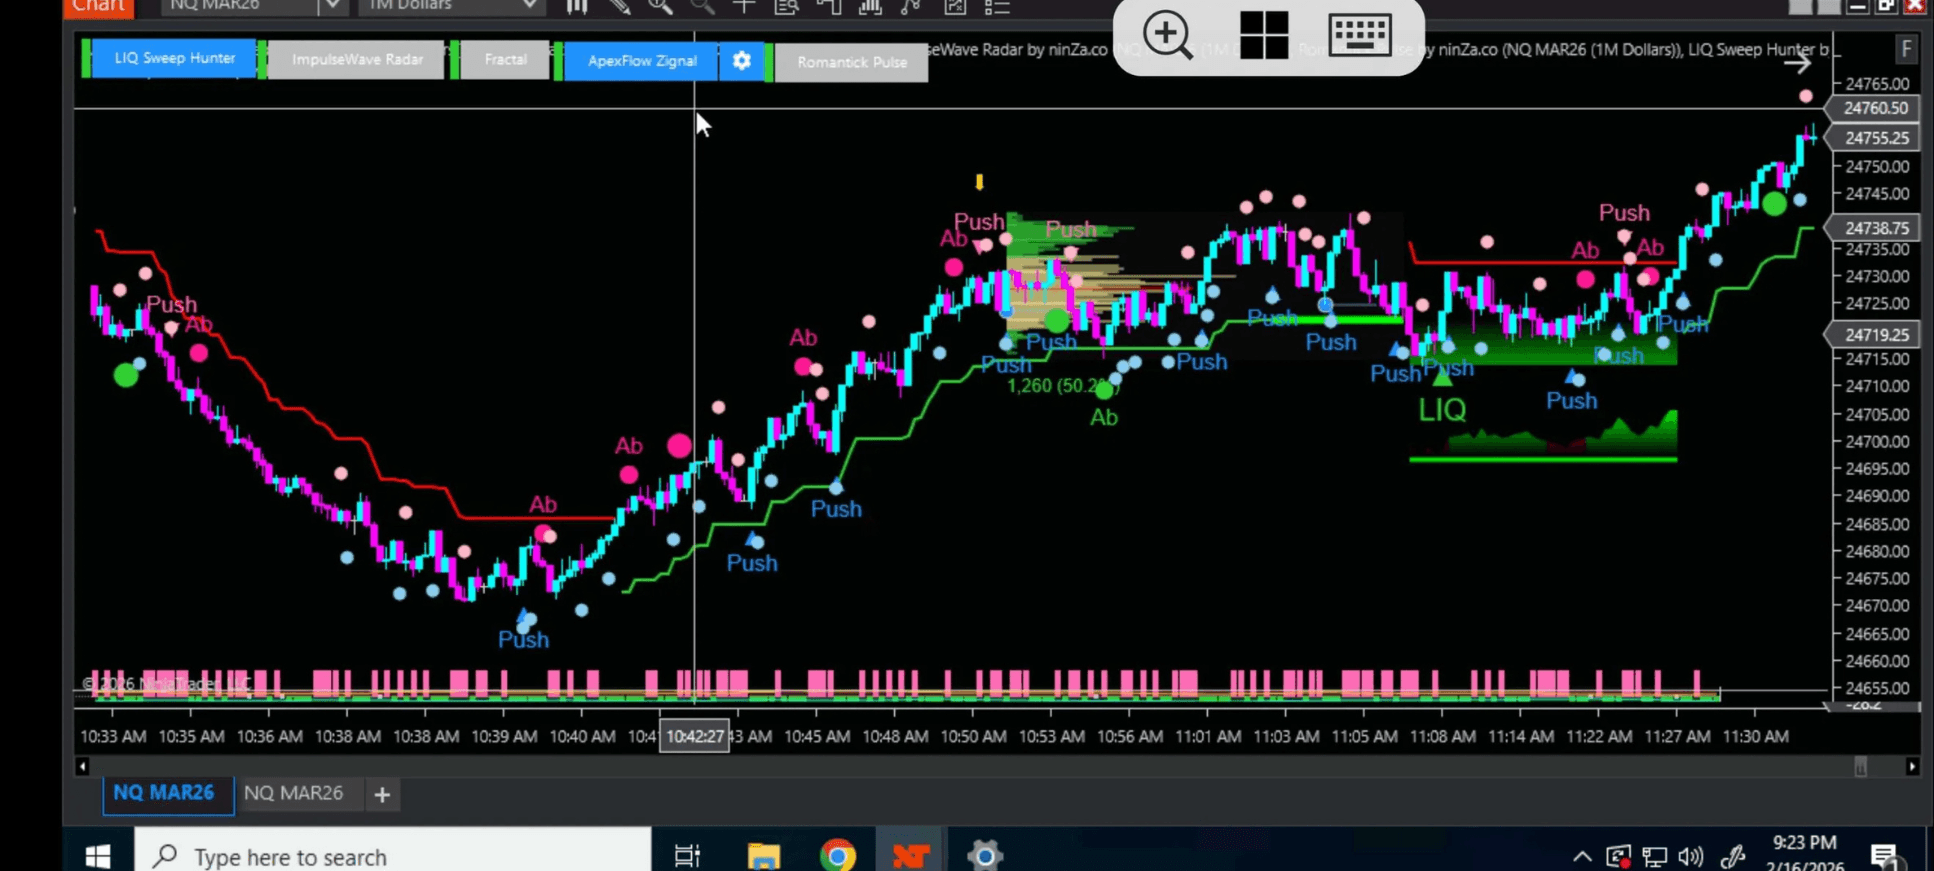
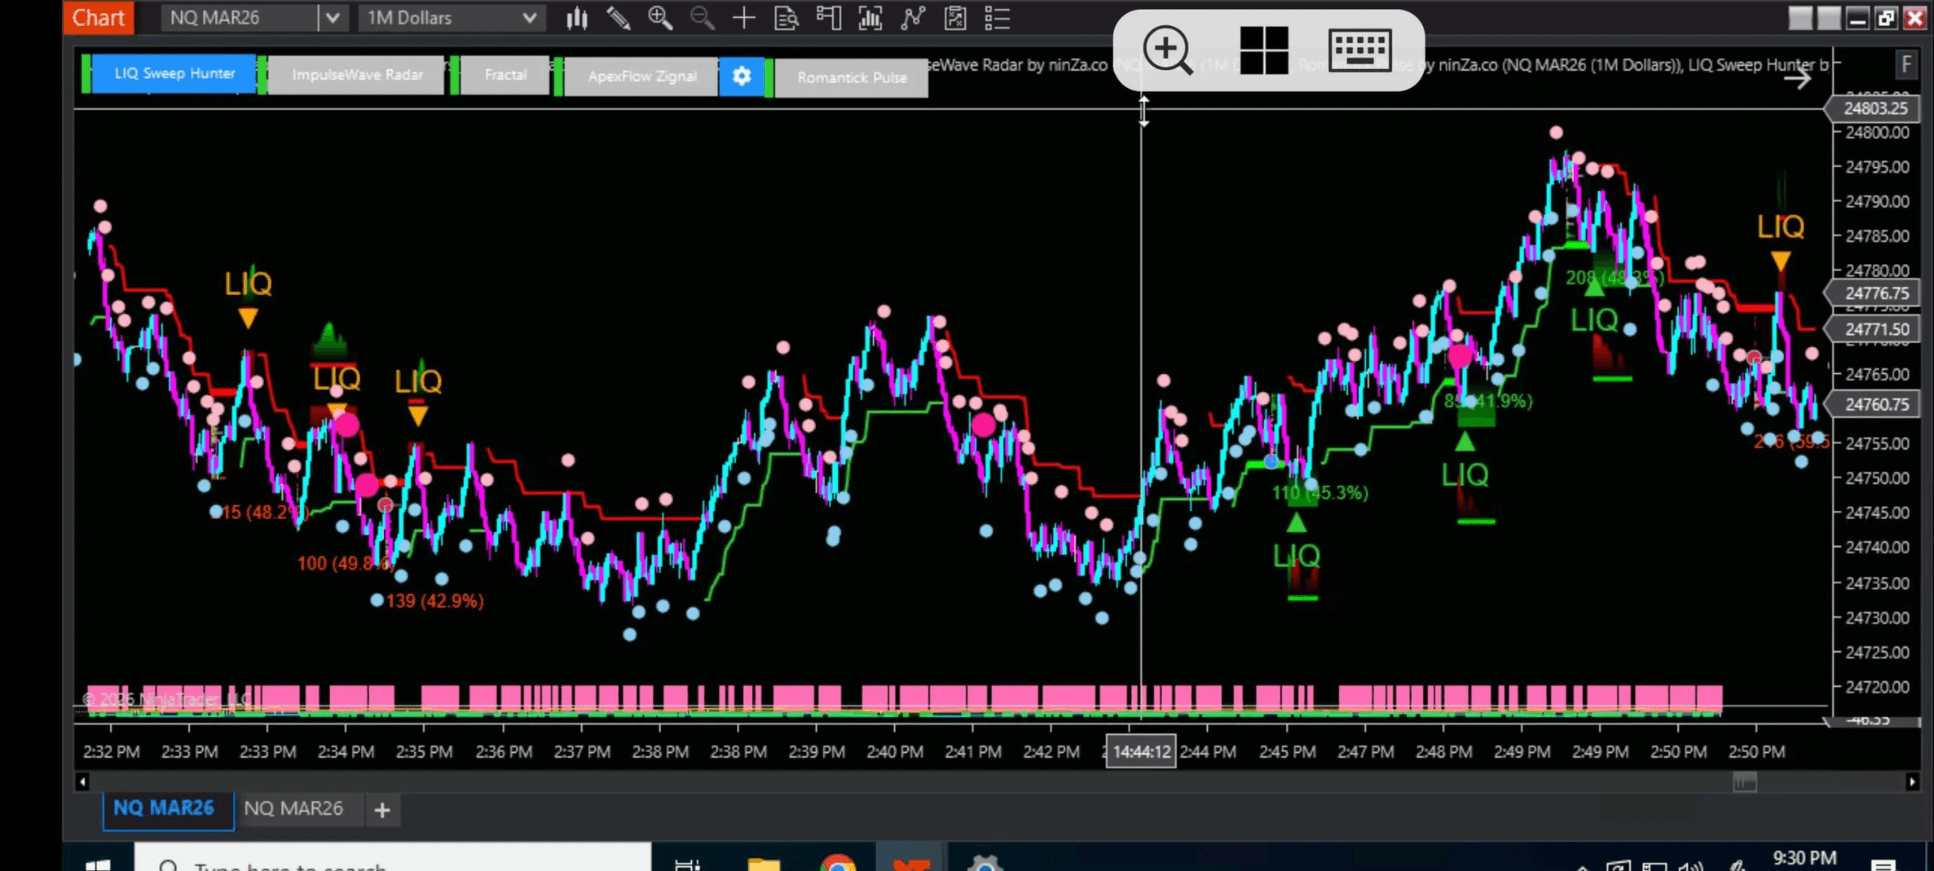
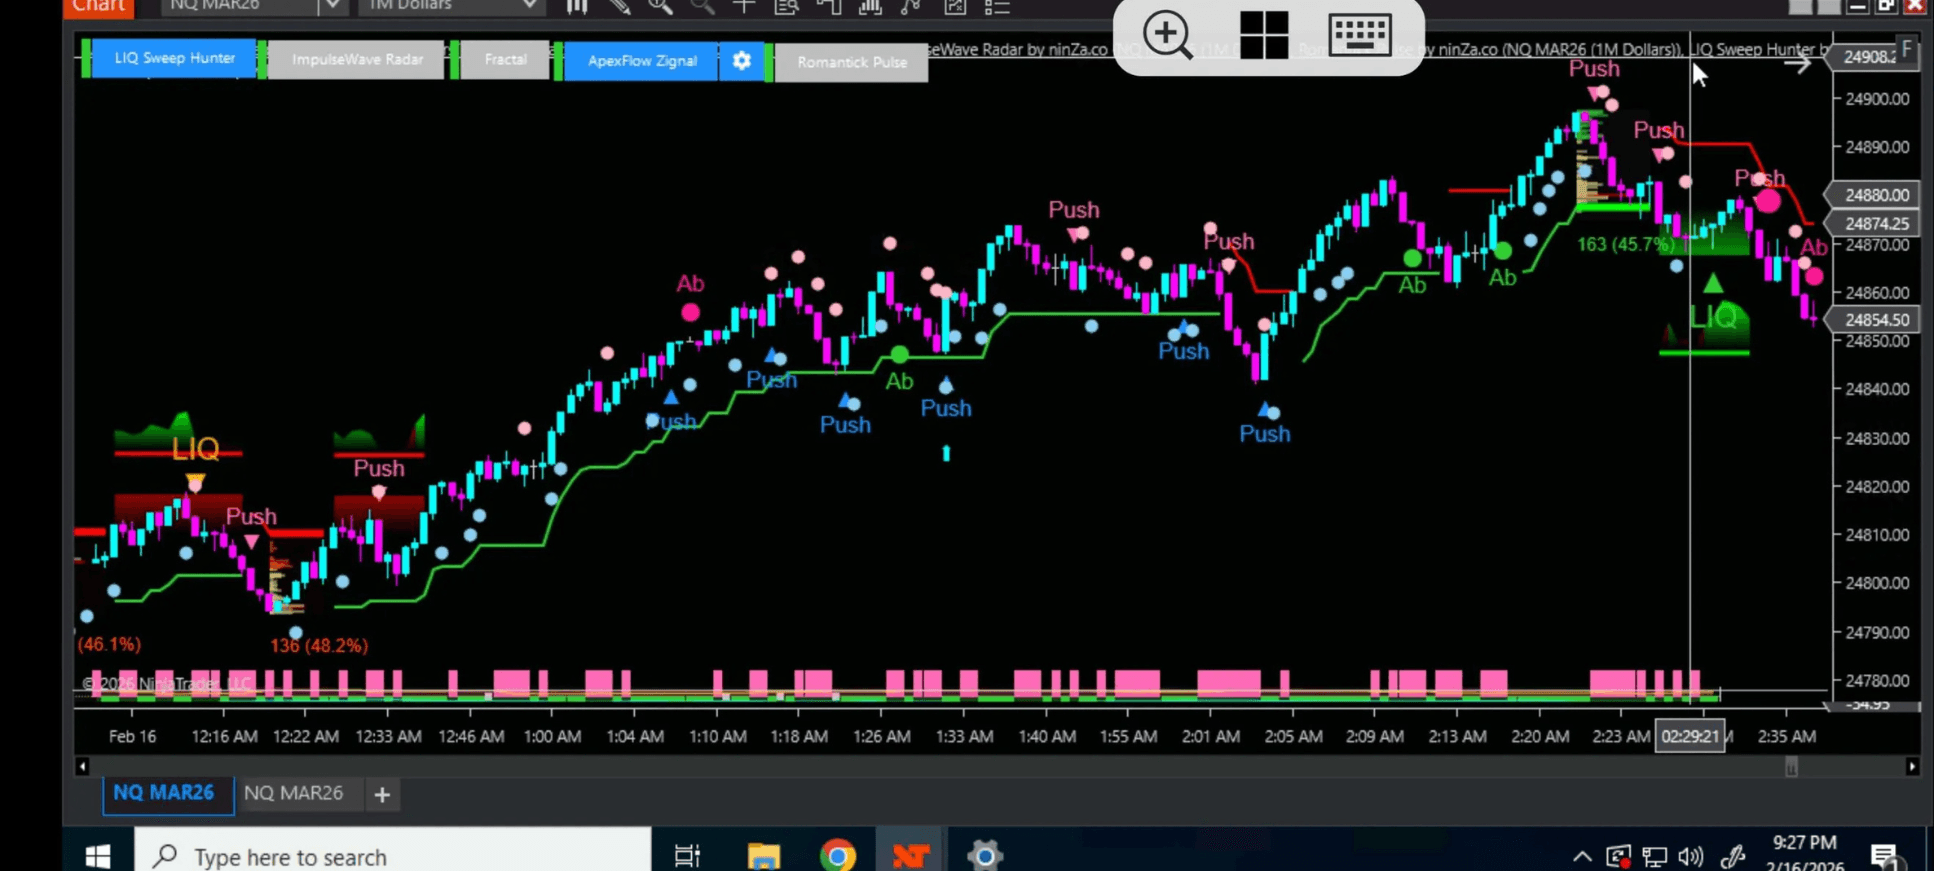
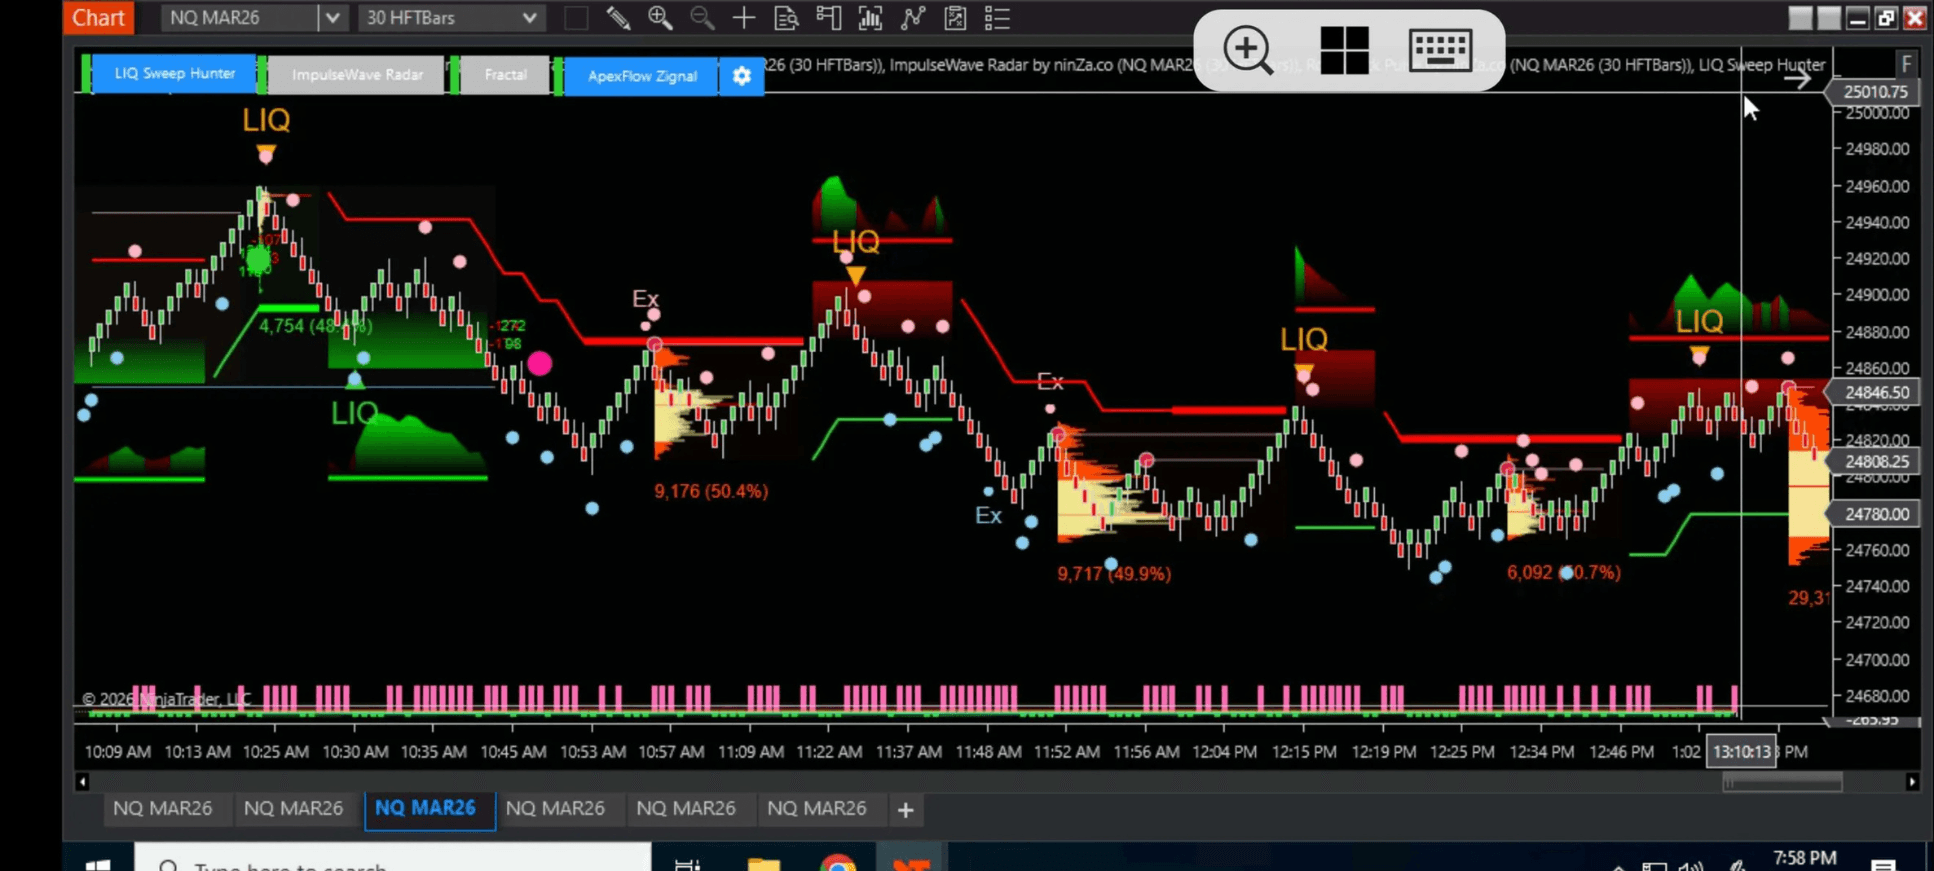
Let’s take a look at LIQ Sweep Hunter’s performance on the 1-minute NQ chart.
 2026_02_11 (3_45_56 AM)_1770892826662.png)
 2026_02_05 (9_11_10 PM)_1770892824014.png)
 2026_02_04 (3_43_43 AM)_1770892824012.png)
 2026_02_11 (3_45_36 AM)_1770892826528.png)
 2026_02_09 (3_47_07 AM)_1770892824574.png)
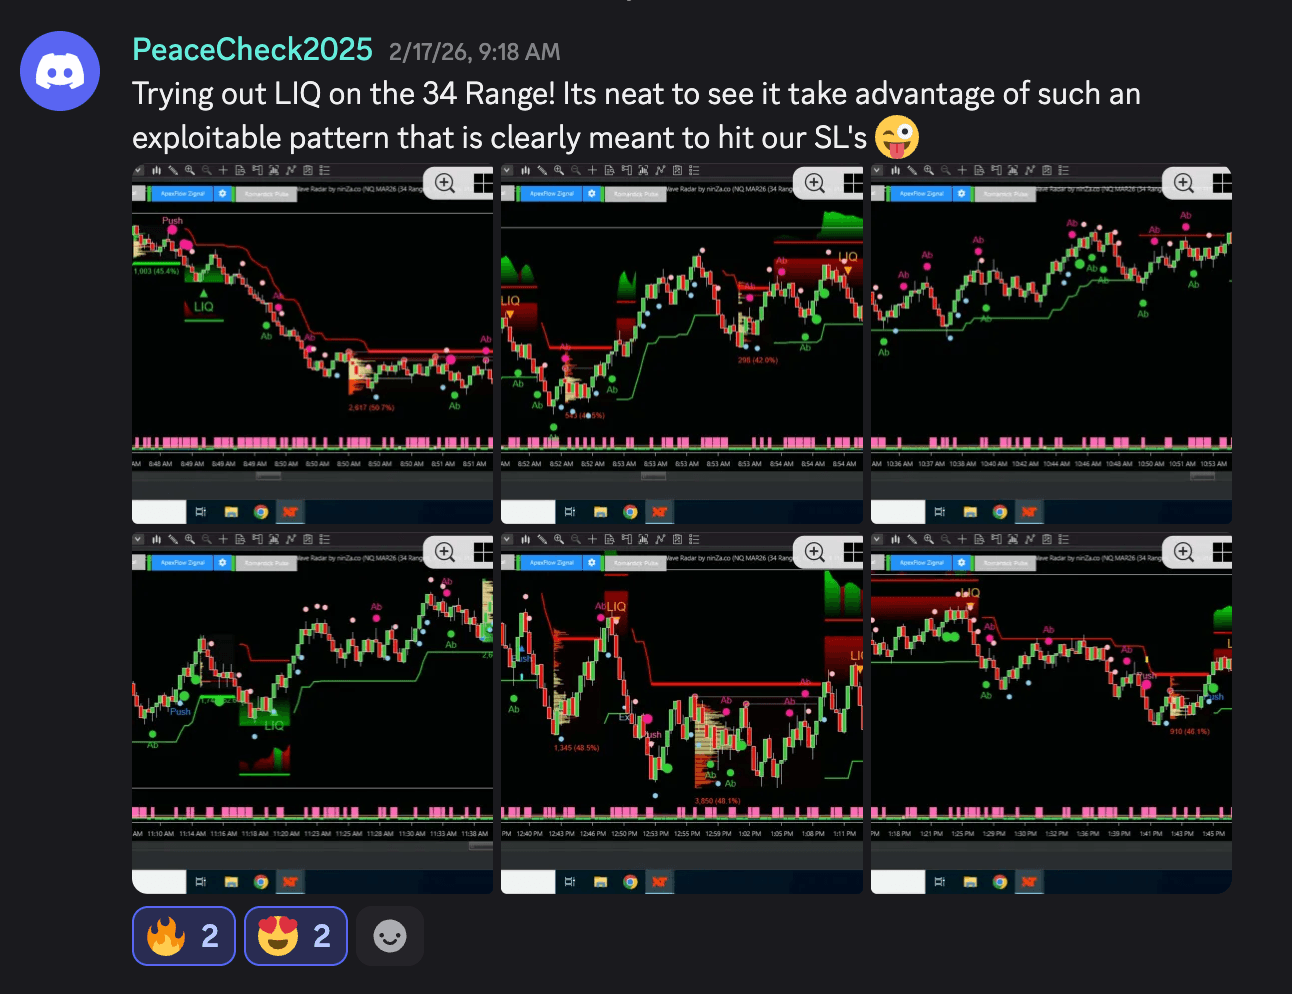
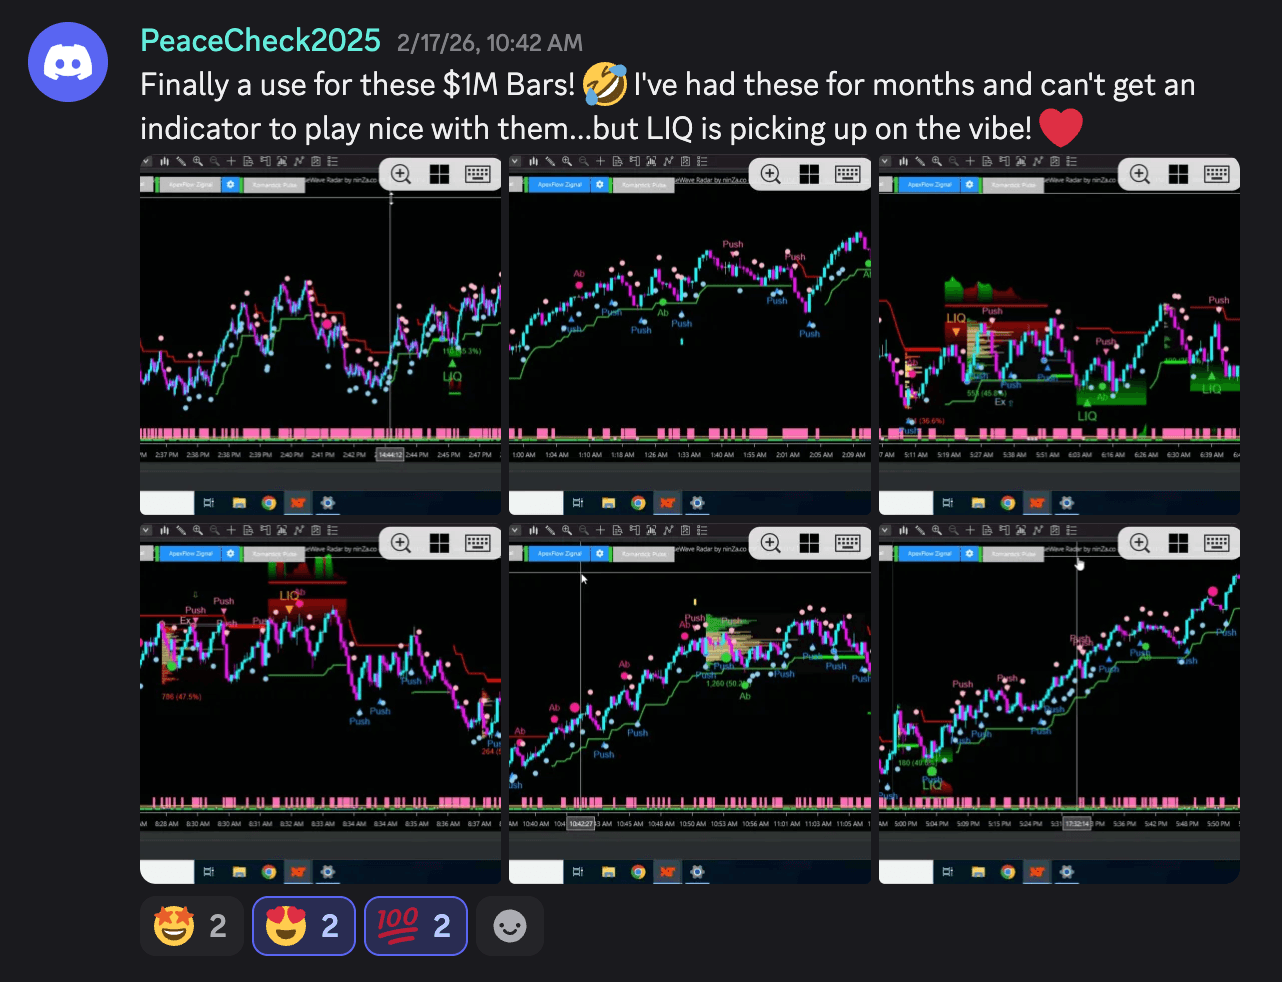
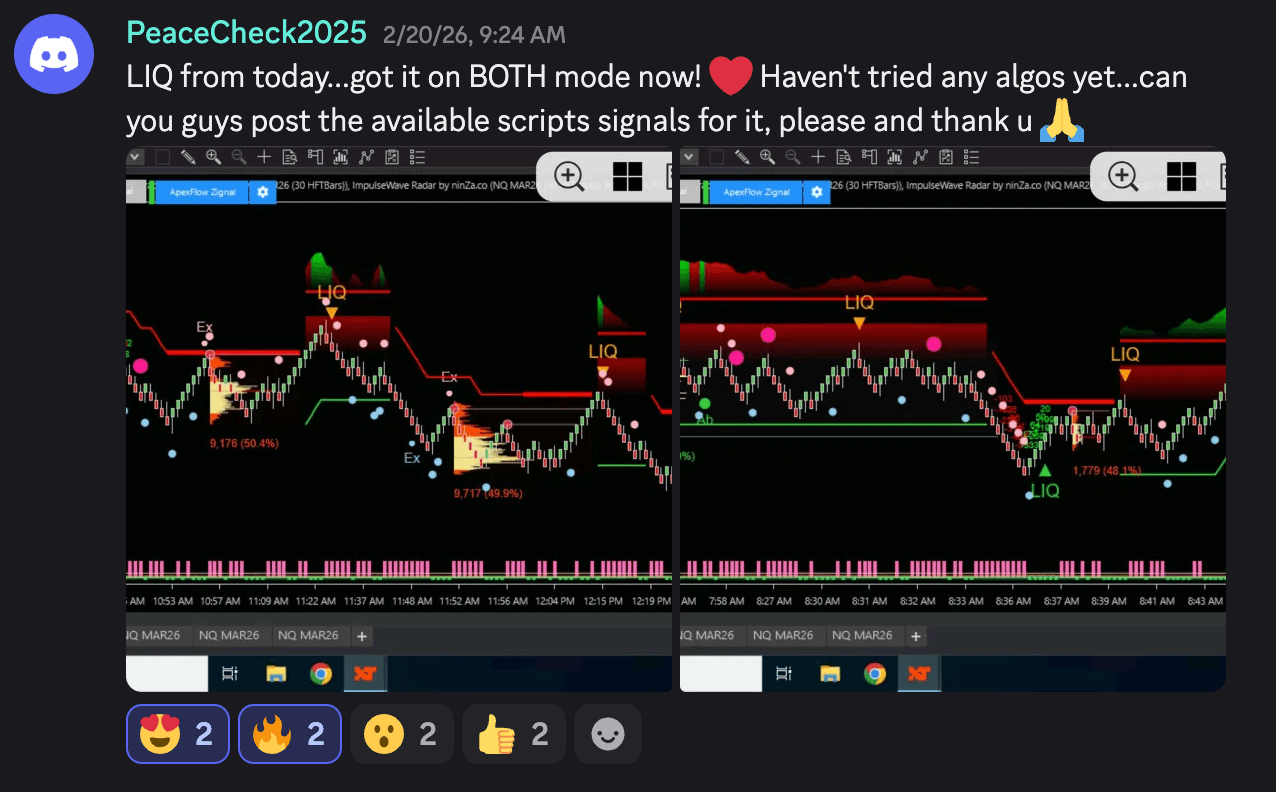
Curious what pro traders think about this indicator? Let’s take a look at what they’re saying.
Practical questions Traders often ask
That’s a fair question. Many liquidity tools rely on Level 2 or depth-of-market feeds.
LIQ Sweep Hunter does not rely on pending orders or order book visibility. It analyzes price behavior & order flow response to detect liquidity sweeps — not the resting liquidity itself.
Stop losses are market orders. When they are triggered, they leave measurable footprints in price and Delta. The model focuses on what cannot be hidden:
• Price displacement after clustered stops are triggered
• Delta shifts during and after the sweep
• Control transition inside the Liquidity Pool
These reactions occur regardless of whether you have Level 2 data. After testing it in live conditions, if you feel the indicator does not provide enough clarity on its own, you’re covered by our 30-day exchange policy.
That makes sense. Not every trader follows SMC or ICT concepts.
Liquidity sweeps are not a strategy — they’re a market behavior. Stops cluster around obvious highs, lows, breakouts, and trailing levels no matter what system you trade. When those stops trigger, price reacts.
The indicator tracks that reaction through price and order flow. You can use the indicator to avoid entering into stop runs or to filter weak breakouts — without changing your core strategy.
Traders using price action, VWAP models, and breakout systems use it as a structural filter, helping them avoid obvious liquidity traps.
We provide direct support to help you optimize the indicator settings or integrate it into your existing strategy via email or remote session. All inquiries are typically addressed within 24 hours.
In trading, simple often gets mistaken for simplistic. The Counter Direction mode is simple by design — because a liquidity sweep itself is mechanically simple.
Stops are market orders. Market orders move price. Limit orders provide liquidity — they don’t push the market. And stop placement is rarely random.
They cluster around obvious highs, lows, breakout levels, and trailing stops.
When those stops are triggered, the market leaves measurable evidence in price and order flow. Acceptance or rejection becomes visible in the reaction that follows.
That reaction is enough to determine whether a sweep is real.
In live testing on NQ and ES, particularly on the 1-hour and 4-hour charts, the indicator consistently provided clearer identification of major swing levels and filtered out structurally weak breakouts.
Instead of reacting to every break of a prior high or low, traders were able to distinguish between genuine continuation and liquidity-driven traps.
If you find that the signals don’t hold up across different volatility environments, you can exchange it within 30 days.
Choose your special pricing options
Select the setup that matches your trading style – from manual execution to full automation.
LIQ Sweep Hunter only
- (1) License of LIQ Sweep Hunter: $600 value
- Personalized support: $100 value
- 1-year product update: $120 value
- Trader's manual & templates: $100 value
Now only: $300
Core Power bundle
- (1) LIQ Sweep Hunter license: $600 value
- (1) Multi-Timeframe Fu$ion license: $700 value
- Personalized support: $100 value
- 1-year product update: $260 value
- Trader's manual & templates: $100 value
Now only: $550
Liquidity Sweep Automation bundle
- (1) LIQ Sweep Hunter license: $600 value
- (1) Multi-Timeframe Fu$ion license: $700 value
- (1) Infinity Algo Engine$ license: $1,700 value
- Personalized support: $100 value
- 1-year product update: $600 value
- Trader's manual & templates: $100 value
Now only: $1200
The Automated bundle
- (1) License of LIQ Sweep Hunter: $600 value
- (1) License of Infinity Algo Engine$: $1,700 value
- Personalized support: $100 value
- 1-year product update: $460 value
- Trader's manual & templates: $200 value
Now only: $950
Download ~ 40 FREE indicators & reach more useful resources !!!
See Highway Fractal Zone in real market conditions
→ Watch it scalp NQ with 9 winning trades in under 3 minutes.
ninZa.co Indicators
0 online
![]()
ninZa.co is an official member of NinjaTrader Ecosystem together with 600+ industry-leading professionals that provide traders with quality trading products & services.


even more payment methods
Quick Links
Instructions
Support
Resources & Information
© Copyright 2026 All Rights Reserved

![]()

Because software products may be copied and stored easily, we will NOT issue refunds of any kind. ALL SALES ARE FINAL & NON-REFUNDABLE!
Futures, foreign currency, and options trading contains substantial risk and is not for every investor. An investor could potentially lose all or more than the initial investment. Risk capital is money that can be lost without jeopardizing one's financial security or lifestyle. Only risk capital should be used for trading and only those with sufficient risk capital should consider trading. Past performance is not necessarily indicative of future results.
Hypothetical performance results have many inherent limitations, some of which are described below. No representation is being made that any account will or is likely to achieve profits or losses similar to those shown; in fact, there are frequently sharp differences between hypothetical performance results and the actual results subsequently achieved by any particular trading program. One of the limitations of hypothetical performance results is that they are generally prepared with the benefit of hindsight. In addition, hypothetical trading does not involve financial risk, and no hypothetical trading record can completely account for the impact of financial risk of actual trading. For example, the ability to withstand losses or to adhere to a particular trading program in spite of trading losses are material points which can also adversely affect actual trading results. There are numerous other factors related to the markets in general or to the implementation of any specific trading program which cannot be fully accounted for in the preparation of hypothetical performance results and all which can adversely affect trading results.
NinjaTrader® is a registered trademark of NinjaTrader Group, LLC. No NinjaTrader company has any affiliation with the owner, developer, or provider of the products or services described herein, or any interest, ownership or otherwise, in any such product or service, or endorses, recommends or approves any such product or service.