New Horizon: 1.5-year forward & 9-year backtest

New Horizon: 1.5-year forward & 9-year backtest

9-year backtest: Profit Factor 1.26, over $348,000 in total profit.
1.5-year forward test: Profit Factor improved to 1.30, with more than $119,000 in profit.

👉 Take a closer look at the performance behind these results.

★ Freedom Trading Workflow ★

★ Freedom Trading Workflow ★

Build a trading workflow that's truly your own

👉 Start building your setup today

Fully Automted Order Flow

Fully Automted Order Flow

Enter with confirmed Order Flow strength. Exit when the edge starts to fade.

➡️ See the full workflow on the chart.

2 indicators. 1 structured CCI workflow

2 indicators. 1 structured CCI workflow

Double CCI combines CCI Trend Pro and Easy Trend into one structured CCI workflow

👉 See the framework in action

Daily Specials

Daily Specials

Access selected trading solutions under our most favorable release conditions.

Explore current opportunities →

[July Exclusive] Liberty Edge Bundle

[July Exclusive] Liberty Edge Bundle

From market analysis to trade execution — in one structured workflow.

→ Explore Liberty Edge bundle

Auction Axis

Read value before price expands.

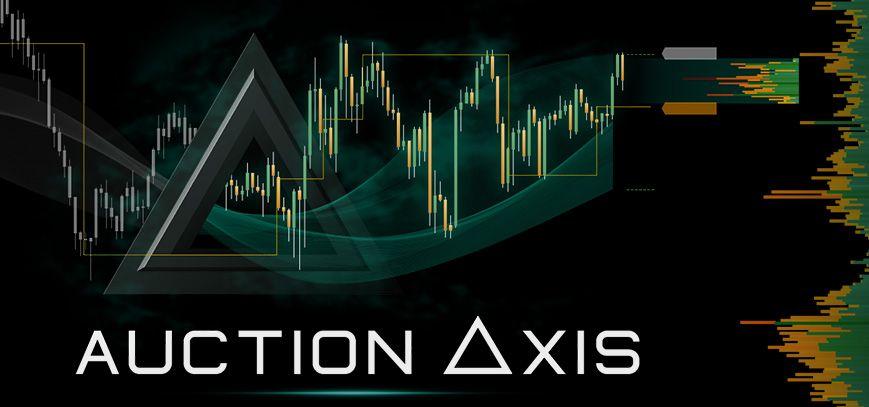
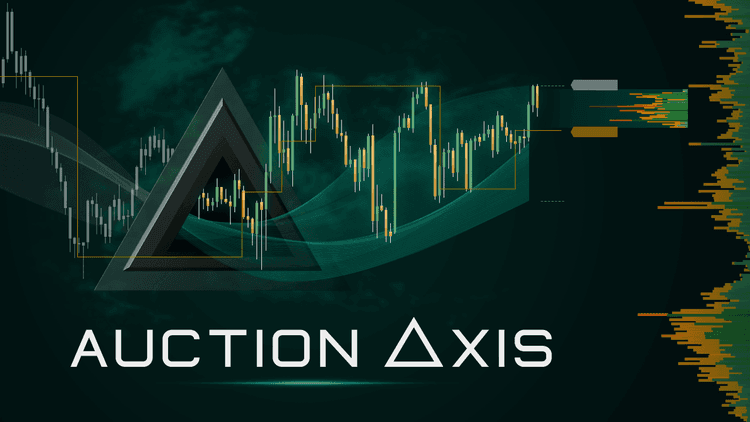
Auction Δxis helps traders understand the market through value acceptance, value concentration, and value migration. By connecting POC, volume distribution, and VWAP-based value zones, it reveals where value is forming, where liquidity is concentrating, and when conditions may be shifting toward expansion.

Volume profile VWAP · POC
POC 238.4
VWAP 236.1

Where most analysis stops

Most traders read price, but not the Auction behind it

Modern trading tools give traders more information than ever before: moving averages, momentum indicators, Fibonacci levels, market structure, and countless ways to analyze price action.

At the same time, several fundamental questions remain among traders:

  • Why do some breakouts develop into sustained moves while others quickly return to balance?

  • Why do support and resistance levels seem to change with every timeframe or indicator setting?

  • And why does a strong trend sometimes reverse even though price still appears bullish?

The problem is that most trading tools focus on price movements, but price is only the visible result of a deeper process – the market's continuous auction for value.

Without understanding how the market establishes, accepts, and transfers value, traders are often reacting to what has already happened instead of recognizing the conditions that drive the next move.

Value-First Framework

Markets are continuous auctions for value

Auction Δxis is built on the belief that markets are continuous auctions for value. Price reflects the outcome of that process, while value reveals where the market establishes acceptance, concentrates participation, and transitions into new opportunities.

By understanding how value forms and migrates, traders gain an analytical edge when interpreting market structure, trend development, and market expansion. This philosophy forms the foundation of the Value-First Framework used by Auction Δxis.

The framework focuses on 3 essential market dynamics: value acceptance, value concentration, and value migration.

01

Value acceptance

02

Value concentration

03

Value migration

These dynamics are visualized through POC migration, volume distribution, and VWAP-based value zones, helping traders distinguish between balanced markets, emerging expansions, and shifts in underlying market value.

Trading intelligence

4 trading intelligences revealed by Auction Δxis

Auction Δxis is not just a trading system – it is a market framework that helps traders uncover market insights that are not always visible through price action and traditional indicators alone.

01 Core insight

Support & Resistance are market properties, not indicator settings

Support and resistance do not originate from moving averages, Fibonacci levels, or indicator settings. They emerge from how the market distributes volume and establishes value.

That is why:

– Change the timeframe
– Change the indicator
– Change the settings
→ The support and resistance levels change with them.

In other words, analytical choices can produce different structures, while the market itself maintains a single underlying liquidity profile.

Auction Δxis introduces the concept of Objective Support & Resistance. These levels emerge from the market's distribution of volume and value, providing a consistent view of where liquidity concentrates and value is accepted, regardless of timeframe or analytical preferences.

Instead of searching for better settings, traders can focus on a single market reality: how value is established and where liquidity truly resides.

02

Big moves begin with value concentration

Before expansion occurs, markets often go through a period of value concentration, where 3 important elements begin to converge:

  • The current trading activityPrice
  • Fair valueVWAP
  • High liquidityPOC

Auction Δxis highlights these moments of Price–VWAP–POC alignment, revealing the conditions that often exist before a Big move unfolds.

The goal is not to predict direction, but to recognize the conditions that typically precede significant expansion.

03

Trends reflect value migration

Most trend analysis focuses on price structure: higher highs and lower lows, moving average slopes, EMA crossovers, ADX and price action.

Auction Δxis adds another perspective: is market value moving higher or lower?

As value migrates upward, the market establishes an uptrend. As value migrates lower, the underlying trend begins to change.

Auction Δxis visualizes this process through evolving VWAP and POC-based value zones, providing another dimension for understanding market direction.

04

Price is always relative to value

Most traders ask where price is going. Few ask: is price currently trading at a premium, a discount, or near fair value?

Markets continuously establish value through participation and acceptance. Price moves around that value, while value defines what the market considers fair.

Auction Δxis reveals this evolving value through VWAP & POC-based value zones, making market valuation visible throughout the session.

On the chart

How Auction Δxis makes those insights observable

Track POC migration, not static levels

Track the movement of POC as it develops, making changes in market participation and value acceptance immediately visible.

Automatically plot volume profiles

Automatically create and update volume profiles as POC begins to flatten, eliminating the need to manually choose where to draw them.

Display daily volume distribution

Display a daily volume profile that reveals trading activity across different price levels throughout the session.

Visualize market value through dual value lines

Build dynamic value zones from the opening VWAP and a migrating VWAP that recalculates with each significant POC transition.

Identify Support & Resistance through POC

Map Day POC and secondary POC levels formed during periods of POC consolidation, creating a structured view of evolving market acceptance.

Highlight Price–VWAP–POC alignment

Mark candles where price, VWAP, and POC converge, making value concentration ahead of potential big moves immediately visible.

What changes

What changes when you read value first

Remove the guesswork from support and resistance

  • Identify objective support and resistance levels rooted in market participation.
  • Reduce dependence on timeframe, period, and indicator configurations.
  • Automatically identify key market zones and important areas of supply and demand.

Avoid chasing price

Evaluate whether price is trading at a premium, a discount, or near fair value in real time.

Position for potential big moves

Recognize value concentration conditions that often precede significant market moves.

Track trends through value migration

Interpret trends through value migration rather than short-term price fluctuations.

Ideal combo

Read value first. Use order-flow signals second.

Auction Δxis + ApexFlow Zignal gives traders a cleaner way to move from market context to signal confirmation.

Auction Δxis helps identify where value is forming, where liquidity is concentrating, and when market conditions may be shifting. ApexFlow Zignal then adds an order-flow signal layer, helping traders observe absorption, exhaustion, and push behavior inside that value context.

01

Start with value context

Auction Δxis helps traders understand the auction structure behind price through POC migration, volume distribution, and VWAP-based value zones.

02

Confirm with order-flow behavior

ApexFlow Zignal translates buy/sell pressure, volume behavior, absorption, exhaustion, and push activity into clear chart-based signals.

03

Build a context-to-signal workflow

Instead of reacting to isolated signals, traders can first read where value is developing, then evaluate whether order-flow behavior supports the next trade opportunity.

Investment

Choose the Auction Δxis setup that fits your trading workflow

Start with Auction Δxis as a value-first market framework, or combine it with additional workflow flexibility and order-flow signal confirmation.

Each option includes the license, personalized support, and trader resources to help you apply the framework with more clarity.

Auction Δxis
Best for traders who want to start with the core value-first framework.
Today's access price
$450
Included value
  • Auction Δxis license$1,000 value
  • Personalized support$100 value
  • Trader's manual & templates$100 value

Access Auction Δxis

Auction Δxis + $500 Voucher-F
Best for traders who want Auction Δxis now with extra flexibility for their next setup.
Today's access price
$600
Included value
  • Auction Δxis license$1,000 value
  • Voucher-F$500 value
  • Personalized support$100 value
  • Trader's manual & templates$100 value

Choose Auction Δxis + Voucher-F

Before you decide

A clearer way to understand Auction Δxis before you decide

Is Auction Δxis just another support and resistance indicator?

It is reasonable to ask this, because many tools claim to identify key levels on the chart.

Auction Δxis is not built around fixed settings, moving averages, or manually selected zones. It approaches support and resistance as market properties formed through volume distribution, POC behavior, and value acceptance.

By tracking POC migration, daily volume distribution, and VWAP-based value zones, Auction Δxis helps reveal where liquidity is concentrating and where the market is establishing value.

You are not left to interpret the framework alone. The trader's manual, templates, and personalized support are included to help you understand how the value-first approach fits into your workflow.

Do I need to understand auction theory before using Auction Δxis?

Auction theory can sound technical, especially if you are used to reading price action, indicators, or trend structure in a more traditional way.

Auction Δxis is designed to make value behavior more observable on the chart. You do not need to start with advanced theory; you can begin by learning how value forms, concentrates, and migrates in real market conditions.

The framework visualizes key auction concepts through POC, volume distribution, and VWAP-based value zones, helping traders read value context without manually building every profile or calculation from scratch.

The included manual and templates give you a guided starting point, while personalized support helps you apply the framework more clearly as you build familiarity.

Will Auction Δxis tell me exactly when to enter a trade?

Many traders look for a tool that gives direct entries, especially in fast-moving markets.

Auction Δxis is primarily a value-first market framework. Its strength is not in forcing every decision into a simple buy or sell signal, but in helping traders understand where market value is forming, where liquidity is concentrating, and when conditions may be shifting toward expansion.

This makes it especially useful as the context layer of a trading workflow. Traders can use Auction Δxis to read market structure and value conditions first, then combine it with their preferred signal, execution, or order-flow confirmation method.

If you want a more complete context-to-signal workflow, the Auction Δxis + ApexFlow Zignal option is available, combining value-based market reading with order-flow signal confirmation.

Choose the Auction Δxis setup that fits your trading workflow

Read value first. Use order-flow signals second.

Download ~ 40 FREE indicators & reach more useful resources !!!

Your most-used email

See Highway Fractal Zone in real market conditions
Watch it scalp NQ with 9 winning trades in under 3 minutes.


Join server
discord-avatar

ninZa.co Indicators

0 online