
Adapting Greenz to today's reality
A long-term commitment for Captain Optimus Strong v2 owners
![[Only 2 days left] Liberty Edge Bundle](https://forestcms.nyc3.digitaloceanspaces.com/media/small_Liberty Edge Bundle banner ver 2 (1280 x 720)_1785319144728.jpg)
[Only 2 days left] Liberty Edge Bundle
See the market. Shape the trade. Execute with clarity.
(Available through July 31)
_1784772815601.jpg)
“Zaccess” for traders navigating challenging times
Receive up to $500 in purchase assistance toward eligible products.
![[NEW execution tool] RapidShape Ordering](https://forestcms.nyc3.digitaloceanspaces.com/media/small_RapidShape Ordering banner (1280x720)_1785138140452.jpg)
[NEW execution tool] RapidShape Ordering
Place pending orders with a single drawing
![[Webinar replay] Auction Axis](https://forestcms.nyc3.digitaloceanspaces.com/media/small_webinar-repay-auction-axisihdhđ_1785126444244.png)
[Webinar replay] Auction Axis
James Buchman explains how he sets his bias before entering trades.
![[NEW trading strategy] BigTrade Sweep + LIQ Sweep Hunter](https://forestcms.nyc3.digitaloceanspaces.com/media/small_Thumbnail LIQ Sweep Hunter + Big Trade Sweep_1784773279263.jpg)
[NEW trading strategy] BigTrade Sweep + LIQ Sweep Hunter
What causes a Big Reversal? Liquidity isn’t enough
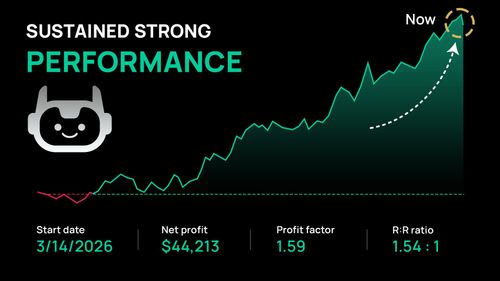
Passed Bulenox with a 3-month backtest
See how this 100% automated trading system performed on both MNQ and NQ.
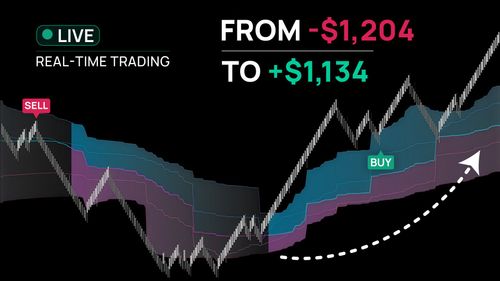
Recovering from a $1,100 drawdown
Watch how 25+ live trades using VWAP helped rebuild the account step by step.
When do trends begin? Insights from pro traders!
Spotting the start of a trend is a common challenge for traders. There's no universal formula, but pro traders have strategies to enhance their chances of spotting trend formations.
One method seasoned traders often use to predict trend beginnings is analyzing the correlation between the strength of bulls and bears.
So imagine in a downtrend, how can you identify the signs of a potential uptrend?
- Condition 1: By analyzing volume, you can identify when bearish momentum is fading and bullish strength begins to surpass bearish pressure.
- Condition 2: When sellers are distributing prices and the successive lower lows show decreasing price differentials, it suggests a potential weakening of the downtrend.
- Condition 3: Subsequently, buyers trigger a surge in both price and volume, resulting in a decisive breakout above resistance (trendline).
- Condition 4: The emergence of higher highs and higher lows indicates the formation of a new trend.

What are our solutions for detecting these conditions?
- W-Wave Volume Pro: This indicator captures total buy and sell volume, enabling you to effectively identify Conditions 1 and 3.
- Divergence Engine$ and Superior RSI: These indicators identify divergences, providing critical confirmation for Condition 2.
- Trendline Autom@ton: This indicator helps you identify Condition 3 by detecting price breakouts that exceed trendline resistance.
- Z-Trend Plus or Zigzag Swing Pro: This indicator highlights bullish and bearish structures, assisting in the confirmation of Condition 4.
All of them are currently available at 45% OFF
You can use them to recognize the beginnings of trends and also to explore another question: “When might trends come to an end?”
P.S. If you’re interested in any of our recommended products, please let us know! We’re here to help you optimize their use.
Download ~ 40 FREE indicators & reach more useful resources !!!
Why we are rebuilding NINZA
The most important long-term decision we have made in years →
ninZa.co Indicators
0 online
![]()
ninZa.co is an official member of NinjaTrader Ecosystem together with 600+ industry-leading professionals that provide traders with quality trading products & services.


even more payment methods
Quick Links
Instructions
Support
Resources & Information
© Copyright 2026 All Rights Reserved

![]()

Because software products may be copied and stored easily, we will NOT issue refunds of any kind. ALL SALES ARE FINAL & NON-REFUNDABLE!
Futures, foreign currency, and options trading contains substantial risk and is not for every investor. An investor could potentially lose all or more than the initial investment. Risk capital is money that can be lost without jeopardizing one's financial security or lifestyle. Only risk capital should be used for trading and only those with sufficient risk capital should consider trading. Past performance is not necessarily indicative of future results.
Hypothetical performance results have many inherent limitations, some of which are described below. No representation is being made that any account will or is likely to achieve profits or losses similar to those shown; in fact, there are frequently sharp differences between hypothetical performance results and the actual results subsequently achieved by any particular trading program. One of the limitations of hypothetical performance results is that they are generally prepared with the benefit of hindsight. In addition, hypothetical trading does not involve financial risk, and no hypothetical trading record can completely account for the impact of financial risk of actual trading. For example, the ability to withstand losses or to adhere to a particular trading program in spite of trading losses are material points which can also adversely affect actual trading results. There are numerous other factors related to the markets in general or to the implementation of any specific trading program which cannot be fully accounted for in the preparation of hypothetical performance results and all which can adversely affect trading results.
NinjaTrader® is a registered trademark of NinjaTrader Group, LLC. No NinjaTrader company has any affiliation with the owner, developer, or provider of the products or services described herein, or any interest, ownership or otherwise, in any such product or service, or endorses, recommends or approves any such product or service.