
Zuture Flex
Access premium trading products with more payment flexibility
![[Auction Δxis] A comprehensive overview of Auction Δxis](https://forestcms.nyc3.digitaloceanspaces.com/media/small_Thumbnail New release Auction ∆XIS_1784002540029.jpg)
[Auction Δxis] A comprehensive overview of Auction Δxis
Support & Resistance is not a property of indicators. It is a property of the market itself.
_1784001871922.jpg)
Summer Privilege event
More flexibility for your next trading upgrade
Receive up to $500 in Voucher-F
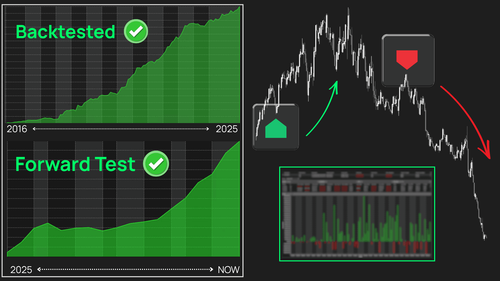
Review the optimized backtest results
- $48,000+ backtested profit for the funded account template.
- $3,200+ backtested profit on MNQ over the last four months.
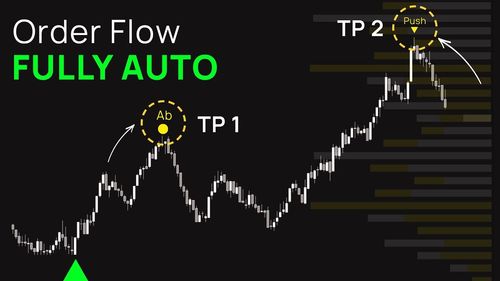
Fully Automated Order Flow
Enter with confirmed Order Flow strength. Exit when the edge starts to fade.
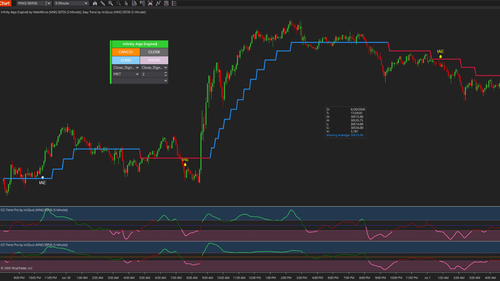
2 indicators. 1 structured CCI workflow
Double CCI combines CCI Trend Pro and Easy Trend into one structured CCI workflow
![[July Exclusive] Liberty Edge Bundle](https://forestcms.nyc3.digitaloceanspaces.com/media/small_liberty-edge-bundle-hdhdh_1783139262484.png)
[July Exclusive] Liberty Edge Bundle
From market analysis to trade execution — in one structured workflow.
[AbsP] ICT PhantomTrace
Understand where liquidity is being sought – before price movement becomes obvious
Gain a clearer view of liquidity collection, market structure transitions, and directional objectives using a framework designed to organize multiple ICT concepts into a more structured decision-making process.
ICT PhantomTrace tracks recurring liquidity behaviors that frequently appear before reversals and continuations, helping traders place market structure, imbalance, and liquidity objectives within a single framework.
What traders see is often the result, not the cause
Traders are often presented with a clear view of what price has already done: Trends, breakouts, reversals, and structural shifts.
What is often less visible is the liquidity activity behind those movements.
A strong breakout may appear to signal the beginning of a new trend. But it may simply reflect the market moving toward a concentration of liquidity resting ahead.
A market structure shift may appear decisive. Yet its significance often depends on the liquidity event that preceded it and the liquidity objective that still remains ahead.
Modern charts provide no shortage of information and technical signals.
The challenge is understanding how those signals fit within the broader flow of liquidity.
As a result, trading decisions can appear perfectly logical on the chart while still producing inconsistent outcomes.
They are often based on where price has been rather than where liquidity is currently being sought.
If liquidity matters, where is it found?
Liquidity tends to gather around highly visible price levels where large numbers of traders are likely to place orders.
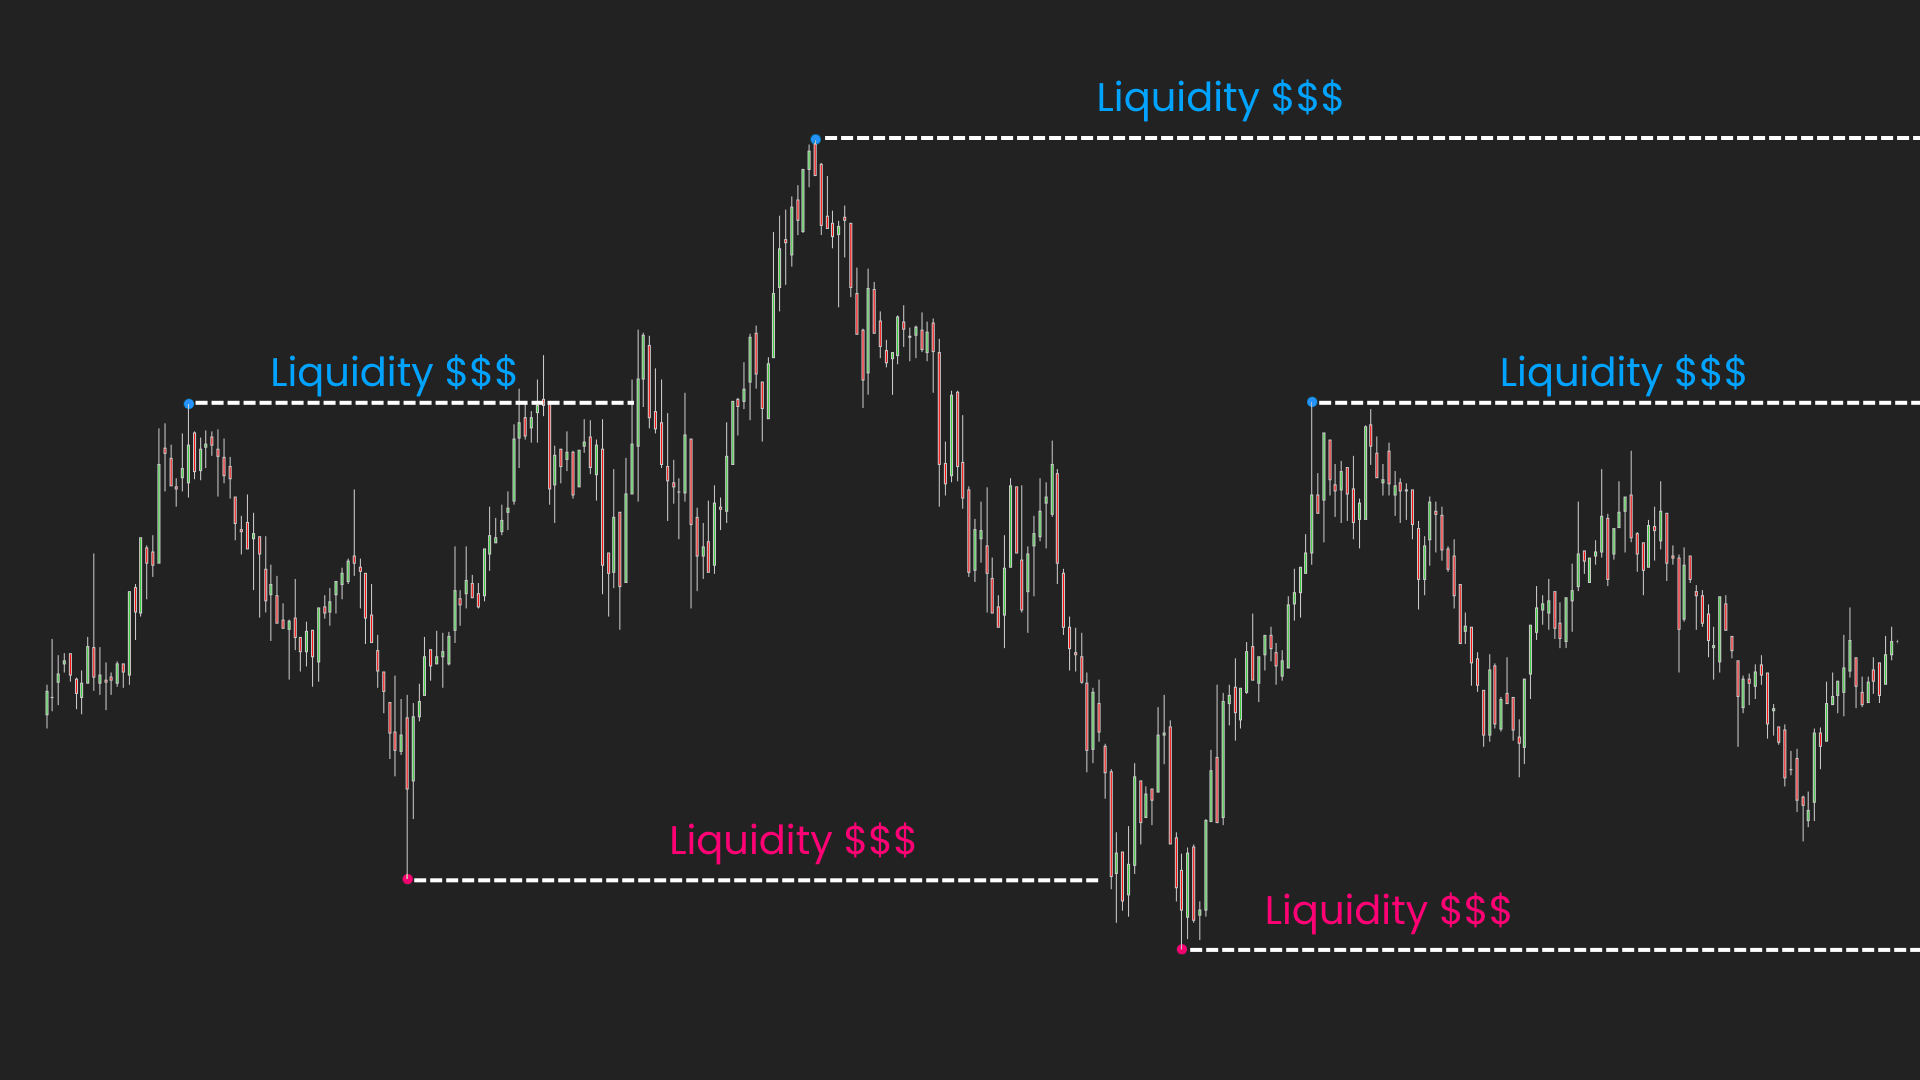
These locations often include:
Because so many orders are concentrated around these areas, they frequently become important liquidity pools.
For larger market participants, these pools provide the liquidity required to enter or exit positions efficiently.
As a result, price often gravitates toward them, making them important reference points when analyzing future market movement.
 2026_04_26 (4_46_42 AM)_1781264971341.png)
 2026_06_04 (4_47_57 AM)_1781264971340.png)
 2026_06_02 (4_48_13 AM)_1781264970530.png)
 2026_04_28 (4_46_29 AM)_1781264970531.png)
Can liquidity movement be tracked?
Across many high-probability ICT setups, 2 recurring liquidity behaviors appear repeatedly.
When liquidity is taken and order flow begins to shift.
When the market continues seeking liquidity toward a larger objective.
Although these behaviors appear in different forms, they often represent 2 important states of market flow.
These 2 recurring states eventually became the foundation of ICT PhantomTrace.
When liquidity begins to shift
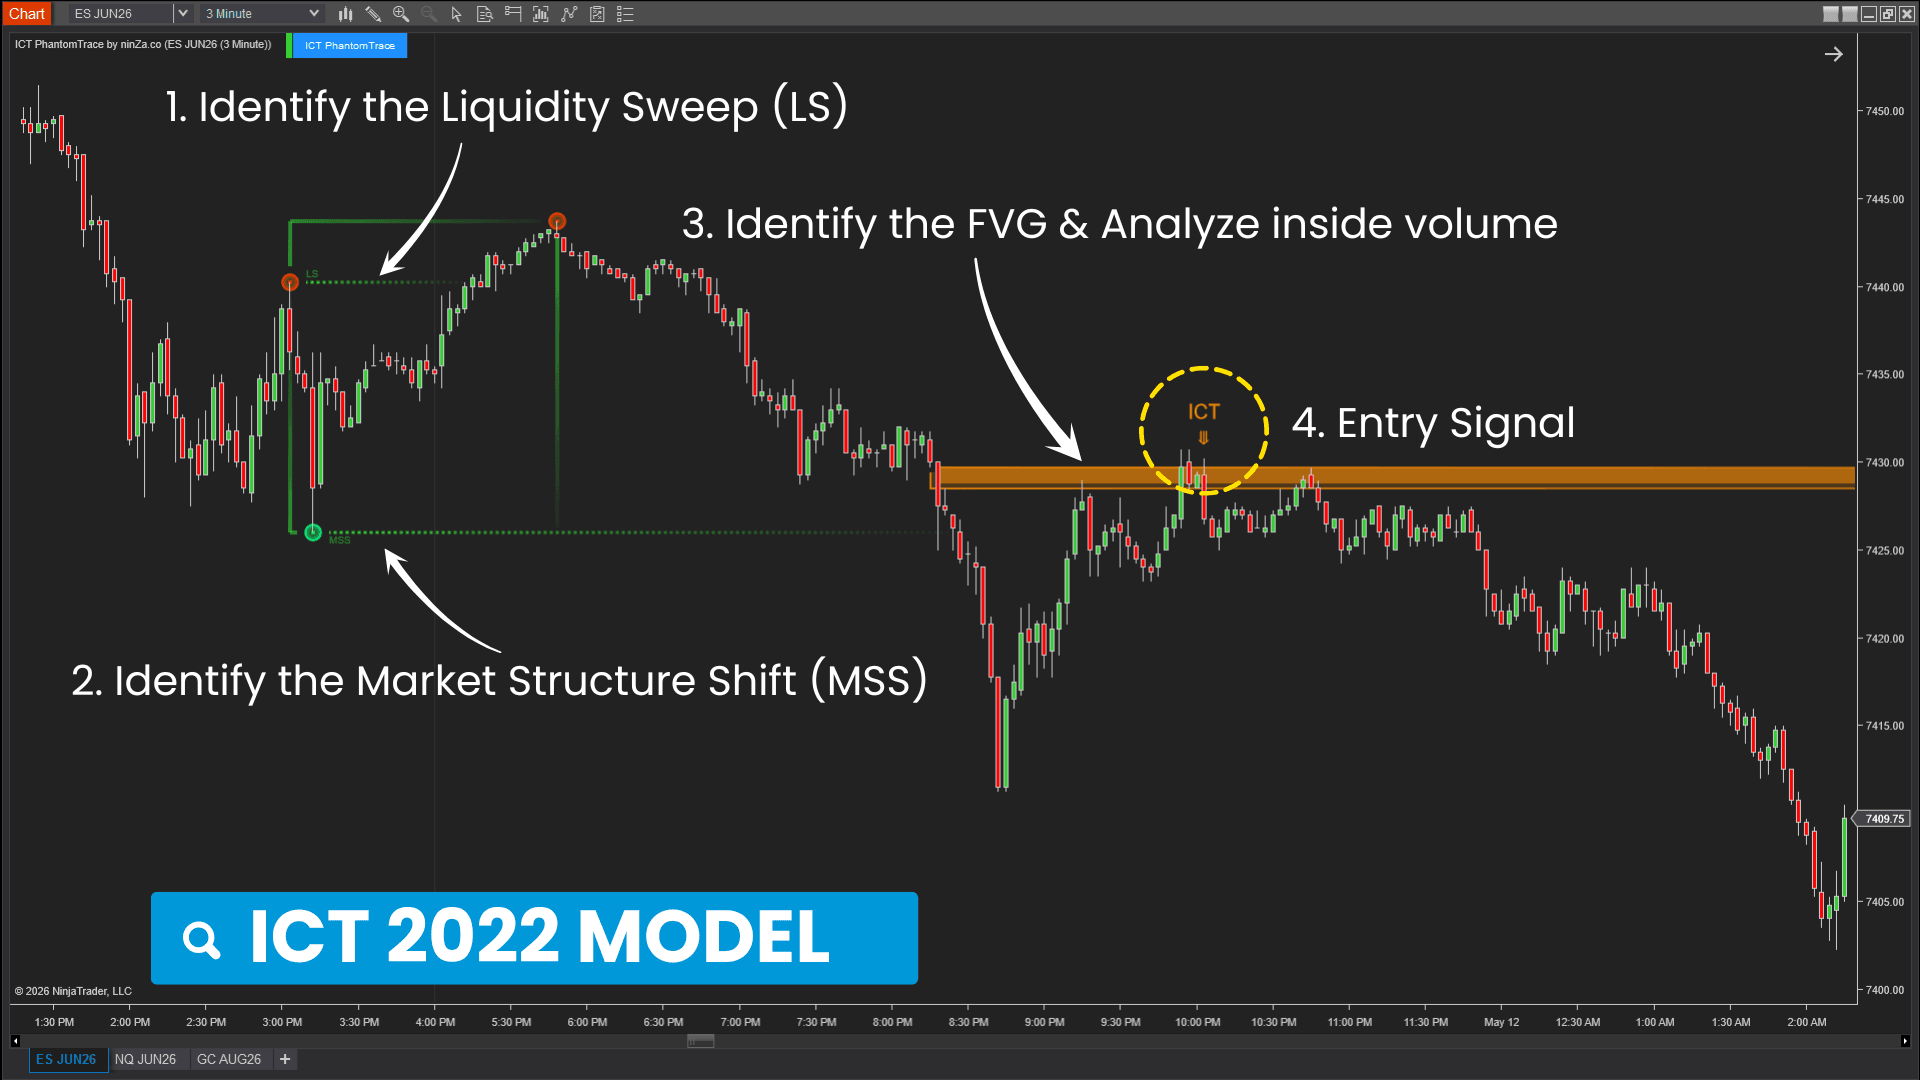
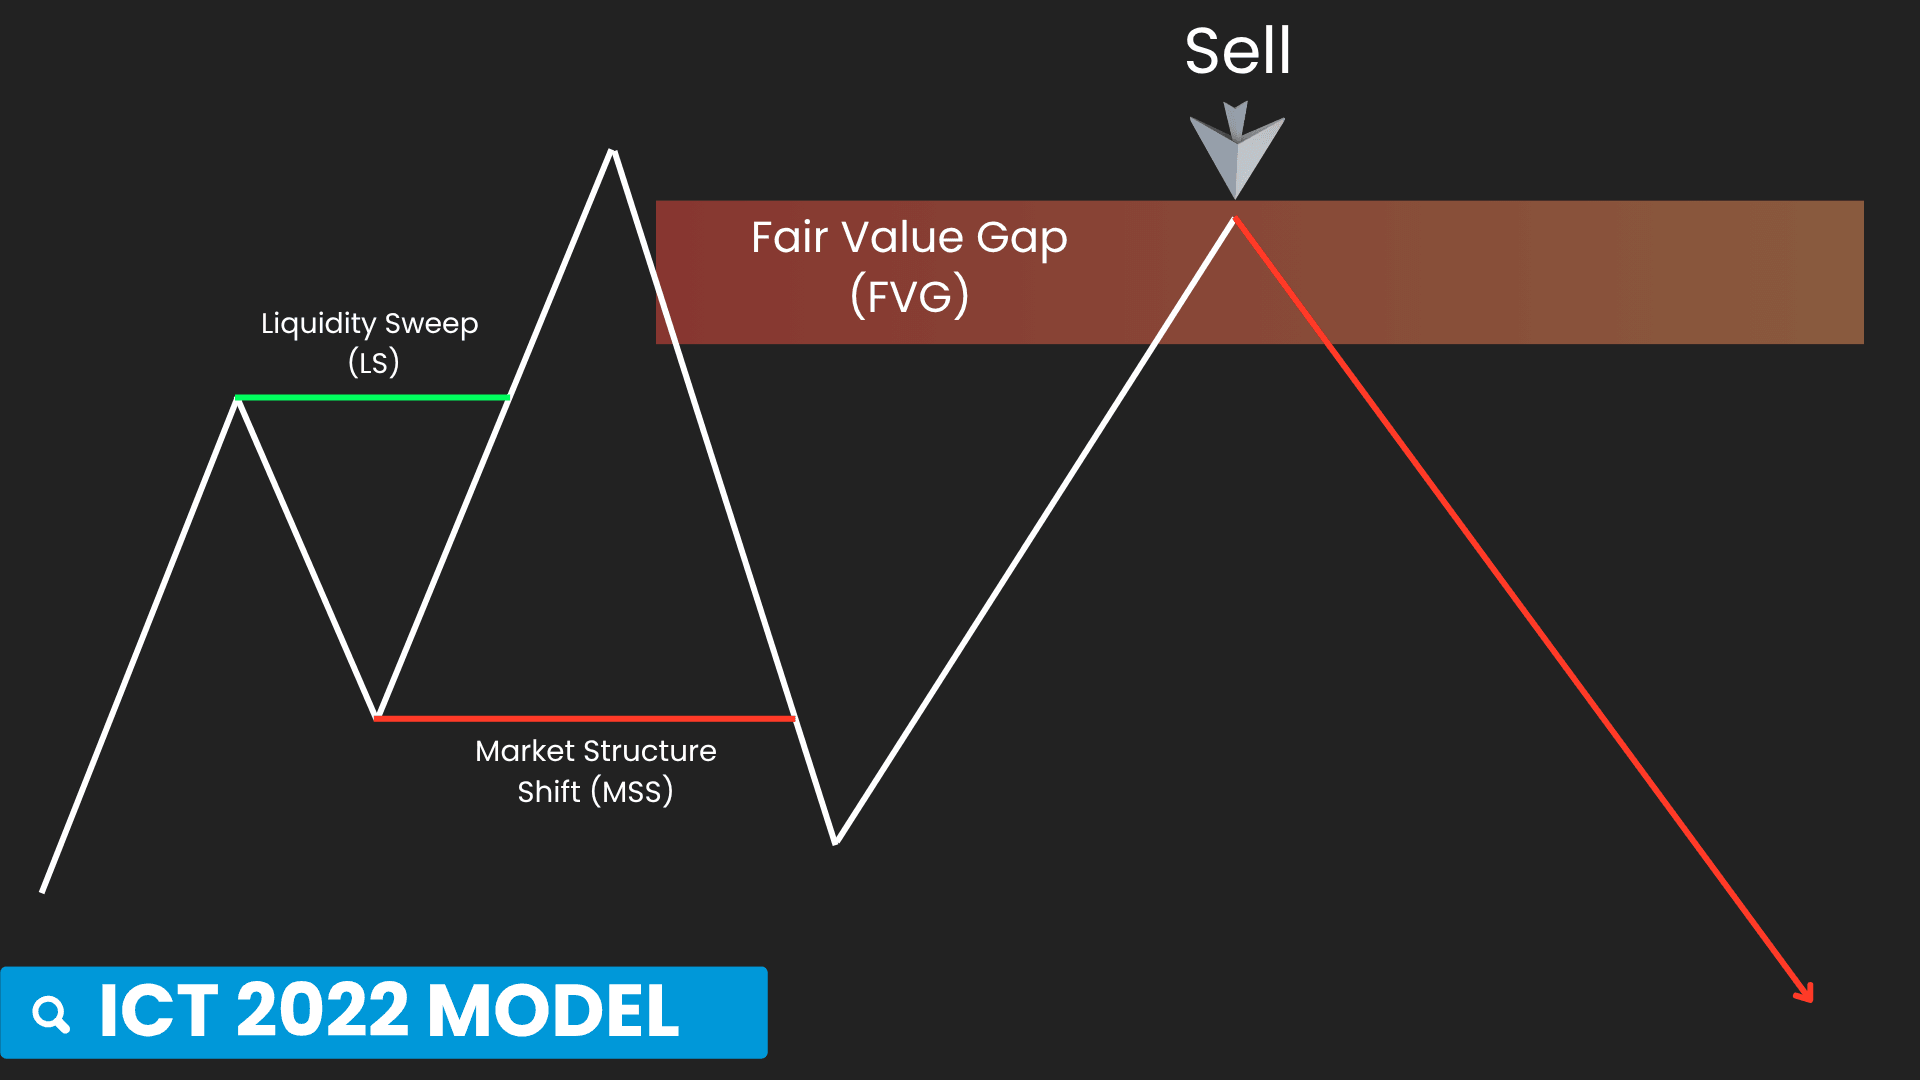
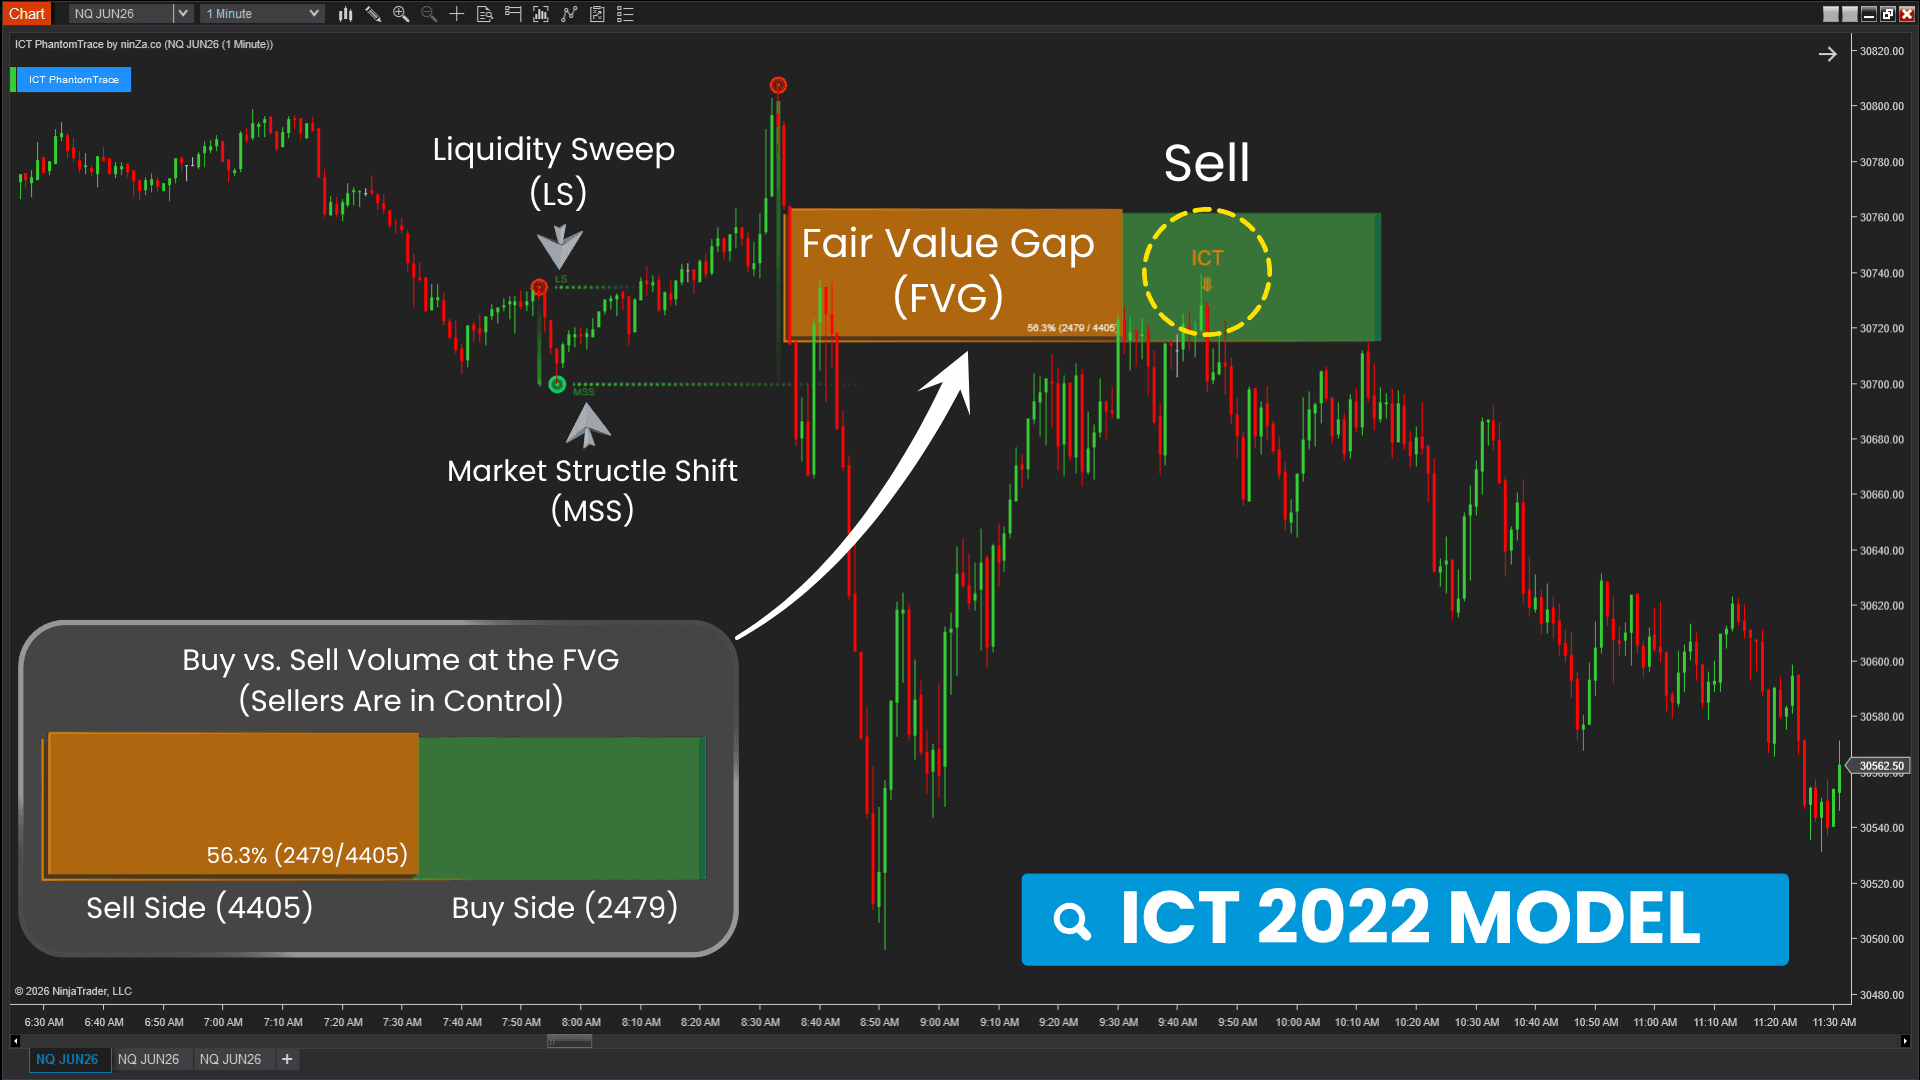
When liquidity is taken, the market does not immediately reverse. Instead, a transition process often begins.
High-probability reversals rarely begin with a single event. They begin with a process.
First, liquidity is taken. Then the existing structure begins to lose validity.
A displacement move creates an imbalance. Price later returns to that imbalance before continuing in the new direction.
ICT 2022 Model is built around this sequence, viewing a reversal not as a single event, but as a process of liquidity transition.
Understanding this process provides additional context for evaluating potential reversals by placing liquidity, structure, and imbalance within a single framework.
ICT PhantomTrace automatically tracks this process by:
When liquidity continues toward its objective
When liquidity has already been taken and direction has already been established, the next question becomes:
Where is the market likely seeking liquidity next?
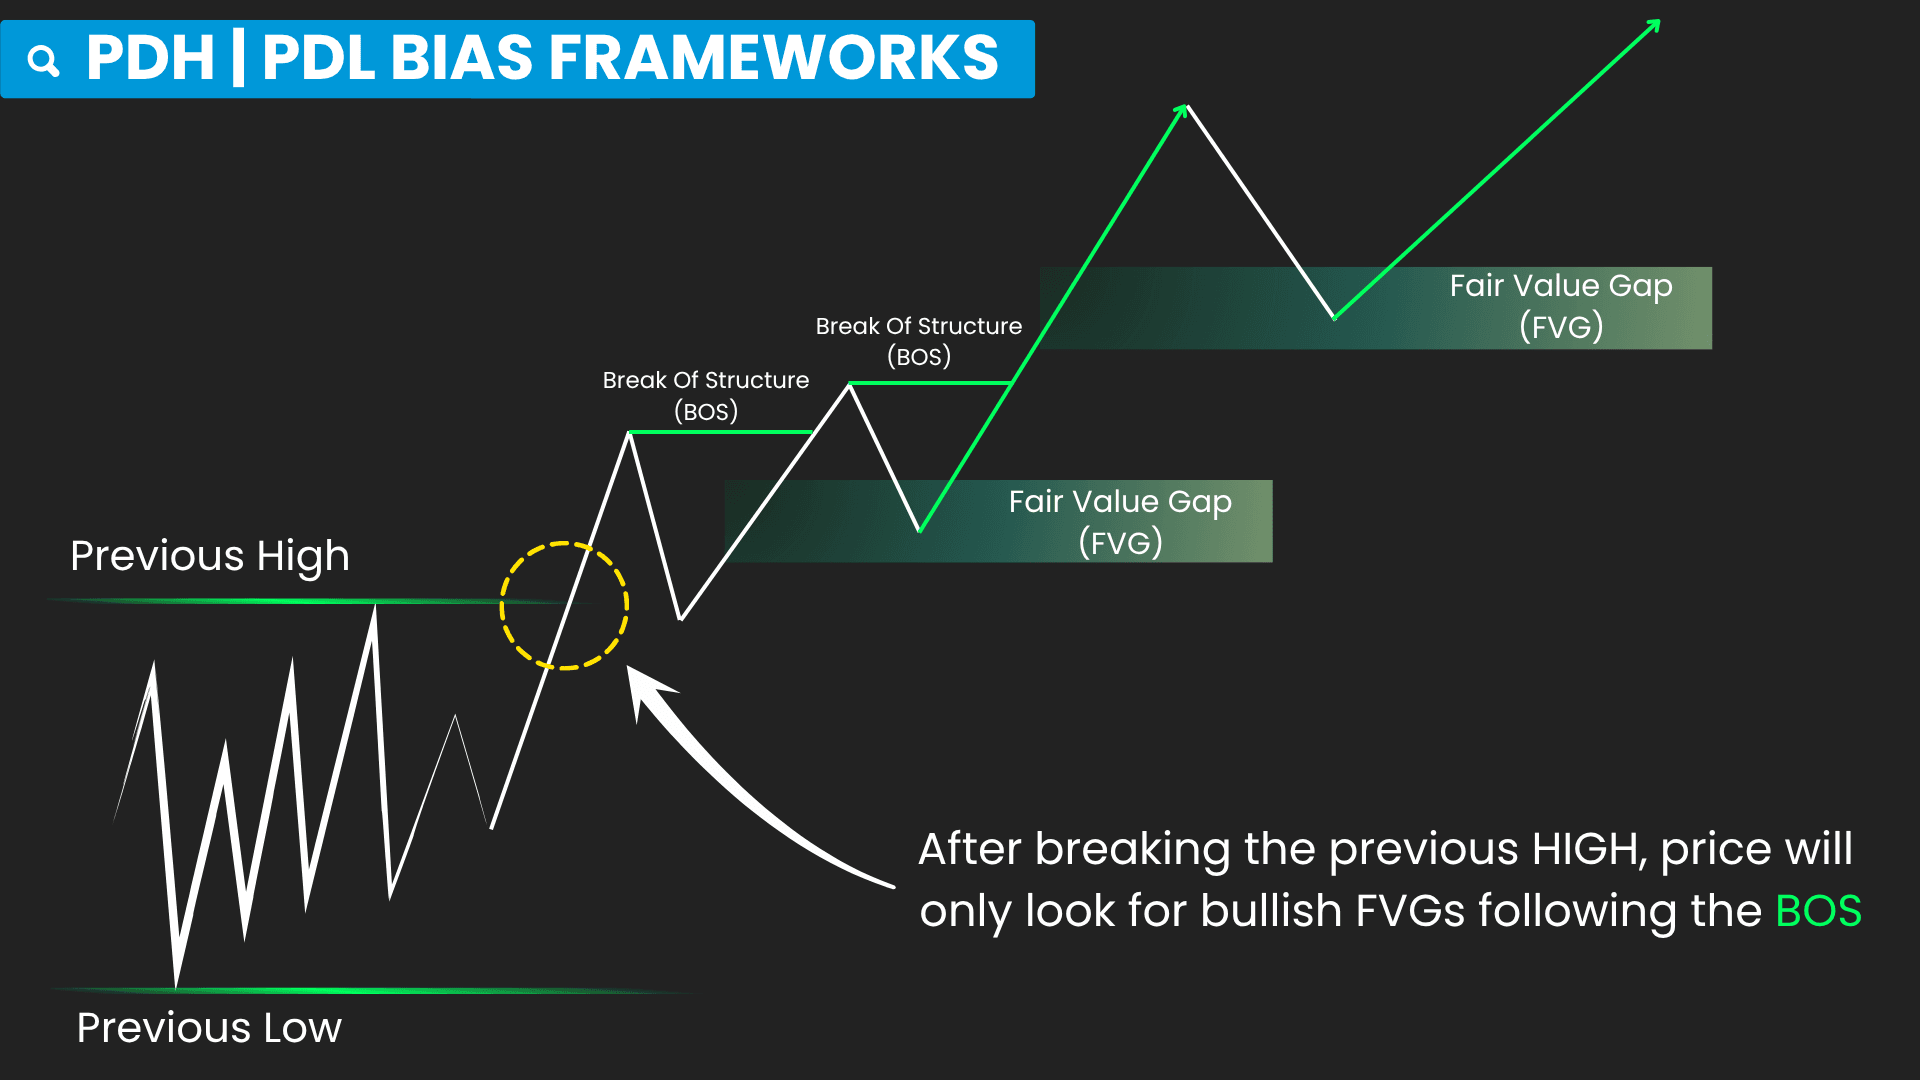
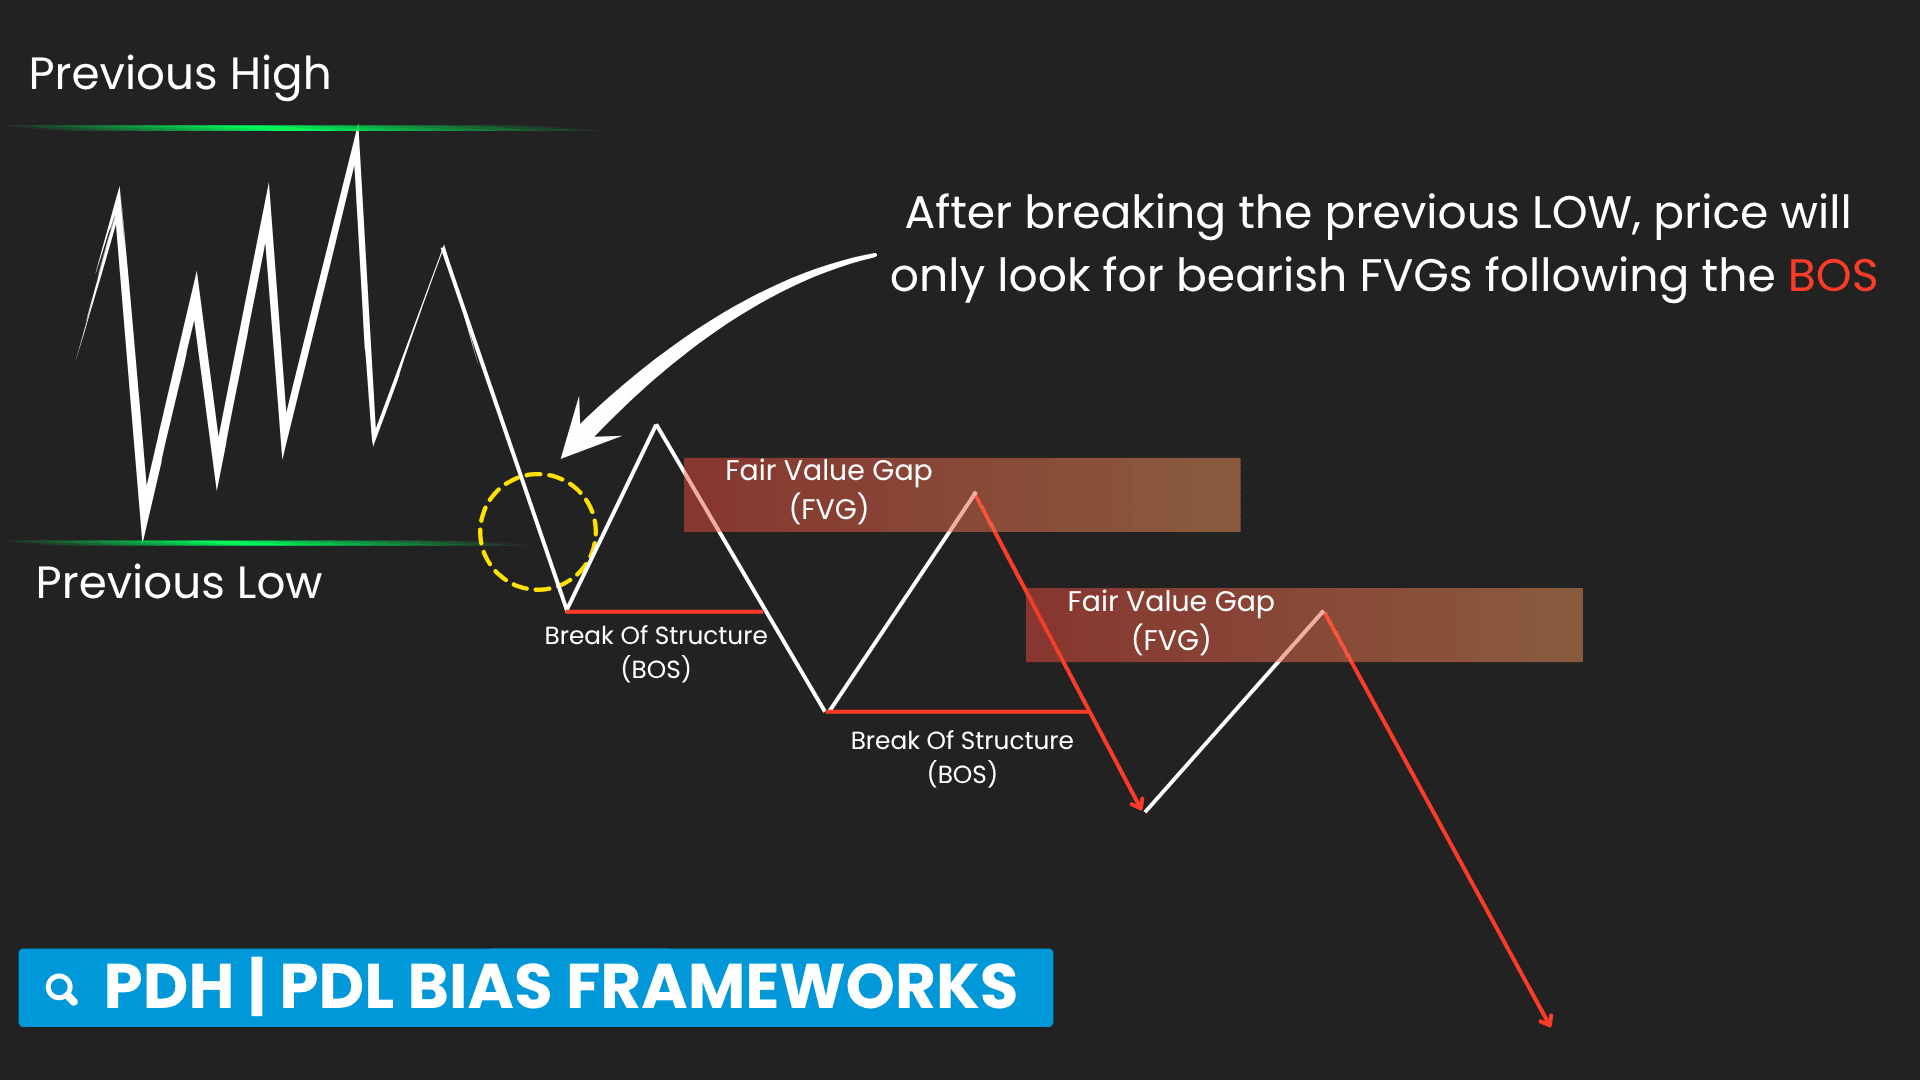
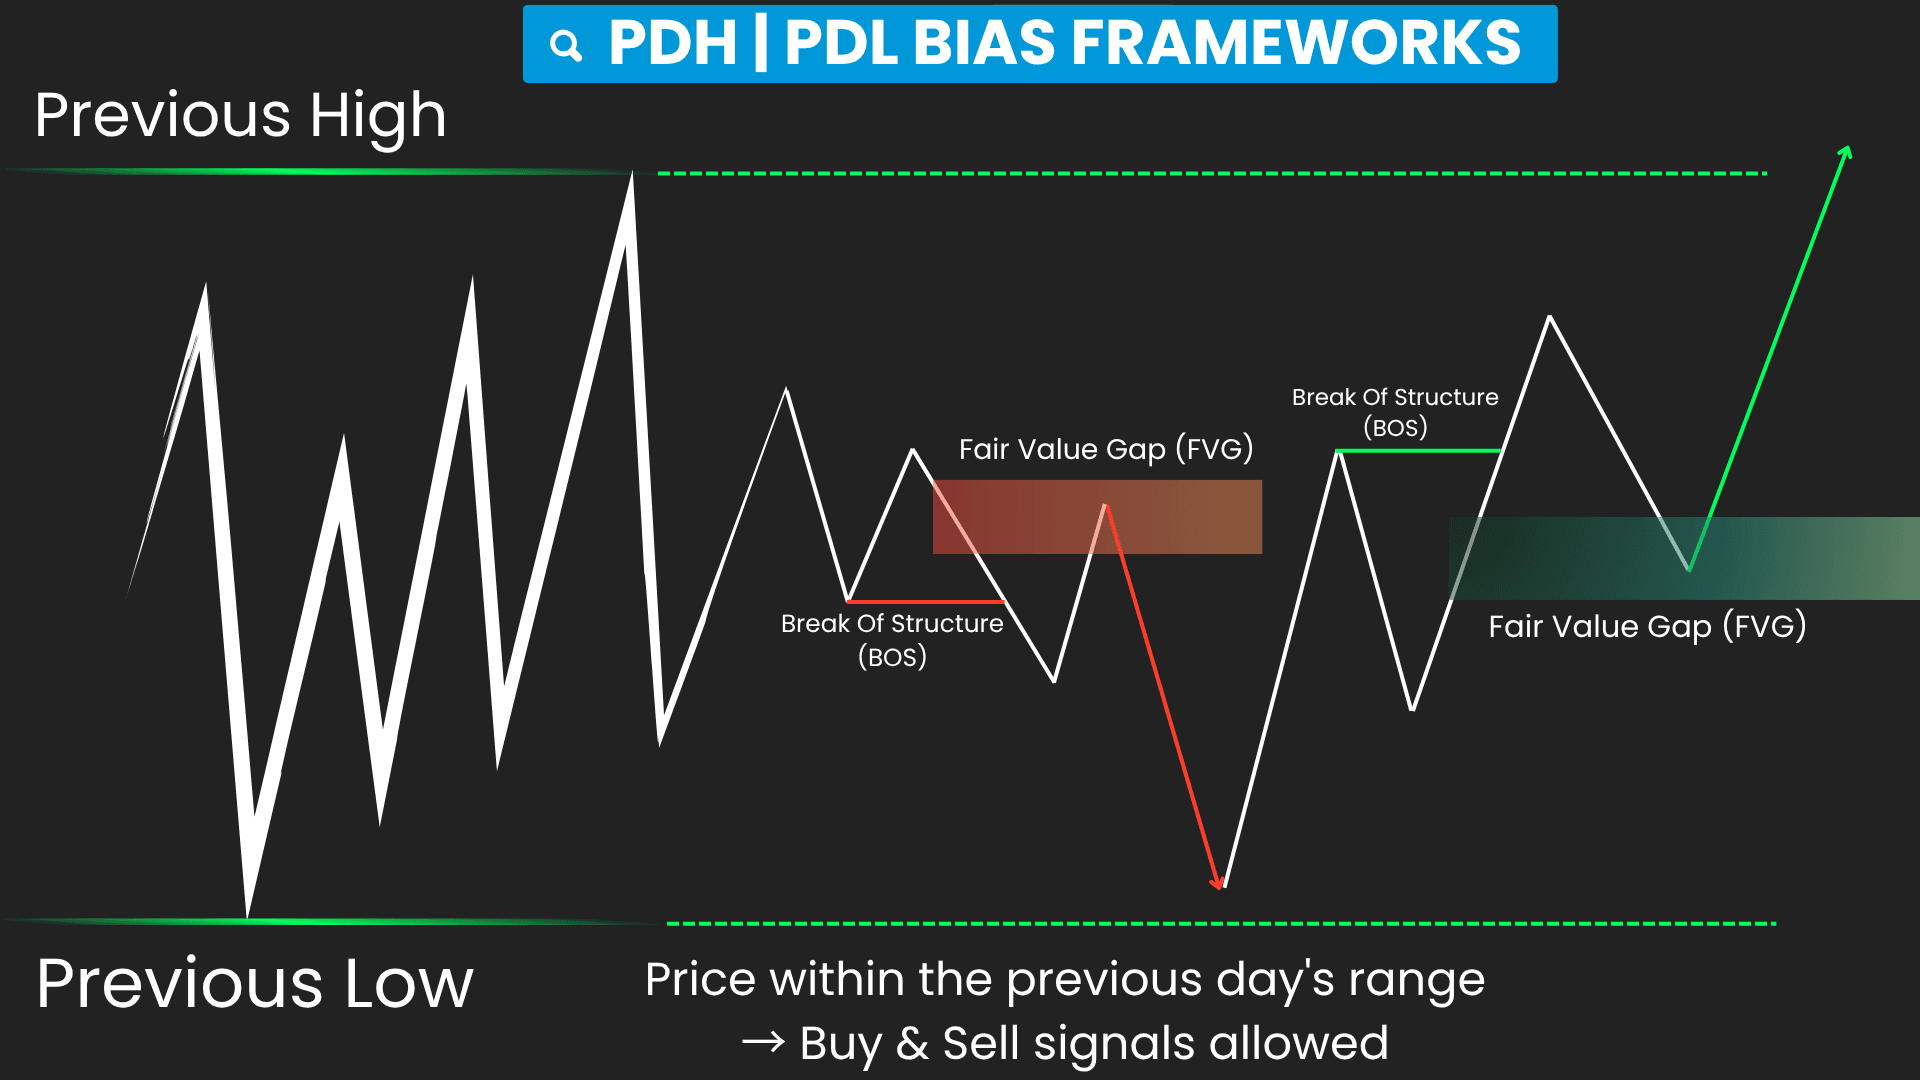
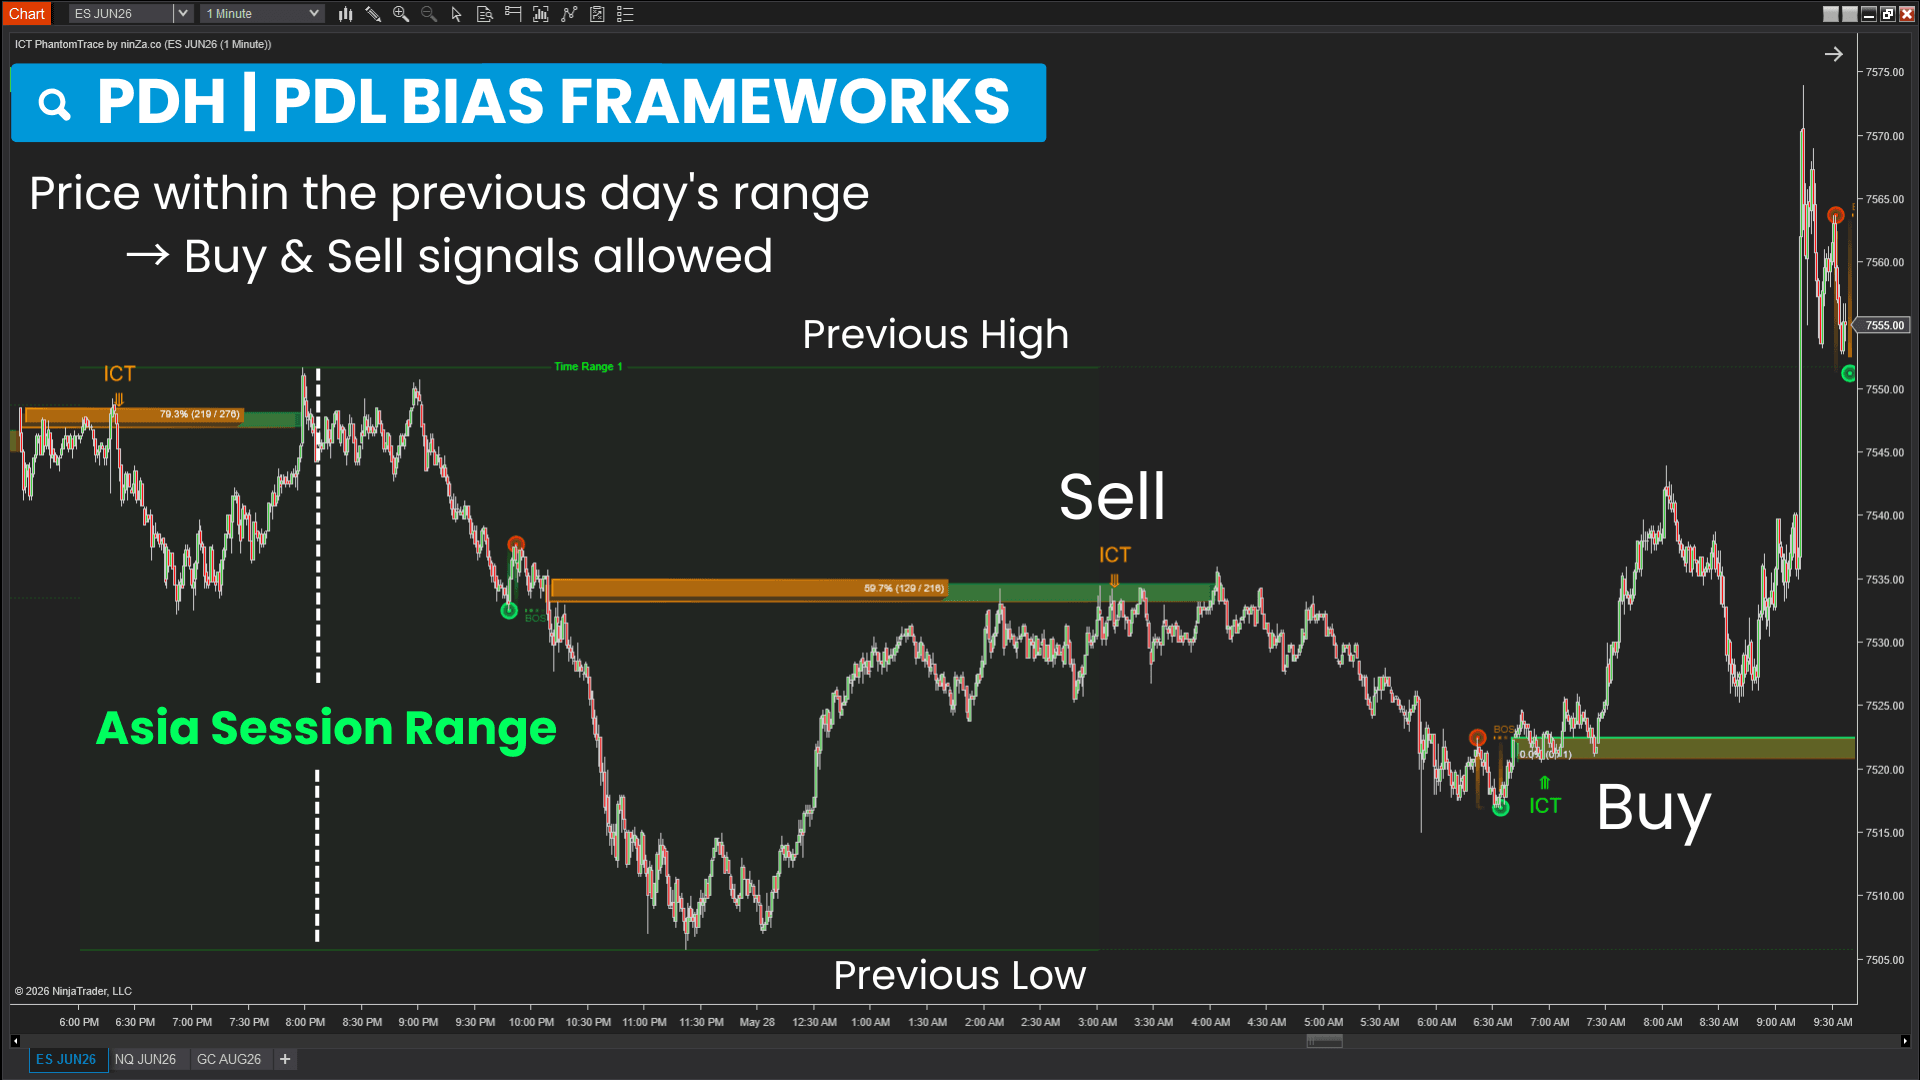
Price often gravitates toward major liquidity pools, particularly Previous Day High (PDH) and Previous Day Low (PDL).
These levels frequently become important objectives for future price movement.
This continuation provides the underlying logic behind PDH / PDL Bias Framework.
Rather than treating every Break of Structure equally, the framework focuses on identifying which side of liquidity the market is currently pursuing.
Recognizing which liquidity pool the market is pursuing helps place continuation signals within a broader market context.
ICT PhantomTrace automatically applies this framework by:
 2026_05_26 (4_48_45 AM)_1781263712170.png)
 2026_05_11 (4_49_41 AM)_1781263711906.png)
 2026_06_02 (4_48_13 AM)_1781263711265.png)
 2026_05_22 (4_48_56 AM)_1781263710665.png)
 2026_05_17 (4_42_07 AM)_1781263710613.png)
 2026_05_08 (4_49_53 AM)_1781263710632.png)
 2026_05_07 (4_41_52 AM)_1781263710415.png)
 2026_06_08 (4_40_58 AM)_1781263710371.png)
 2026_05_27 (4_48_36 AM)_1781263708366.png)
 2026_06_02 (1_55_05 AM)_1781263710286.png)
What changes in your trading process?
Instead of reacting to individual signals, you can analyze market movement through liquidity behavior — creating a clearer and more structured decision process.
 2026_05_08 (4_45_48 AM)_1781265042090.png)
 2026_05_06 (4_46_06 AM)_1781265040607.png)
 2026_05_27 (4_45_10 AM)_1781265040450.png)
Reduces signal overload
Helps you filter out premature signals and focus on setups supported by liquidity context.
Creates a more structured trading process
Turns subjective ICT analysis into a repeatable workflow based on liquidity behavior.
Reduces analysis complexity
Eliminates the need to manually track multiple ICT concepts by automatically organizing liquidity, structure, and imbalance into one framework.
Improves market timing awareness
Helps you recognize when market conditions are shifting from liquidity collection into meaningful price movement.
Improves focus on high-relevance areas
Guides you toward price zones that align with the market’s current liquidity objective.
Webinar replay: Apply ICT the way pro traders do
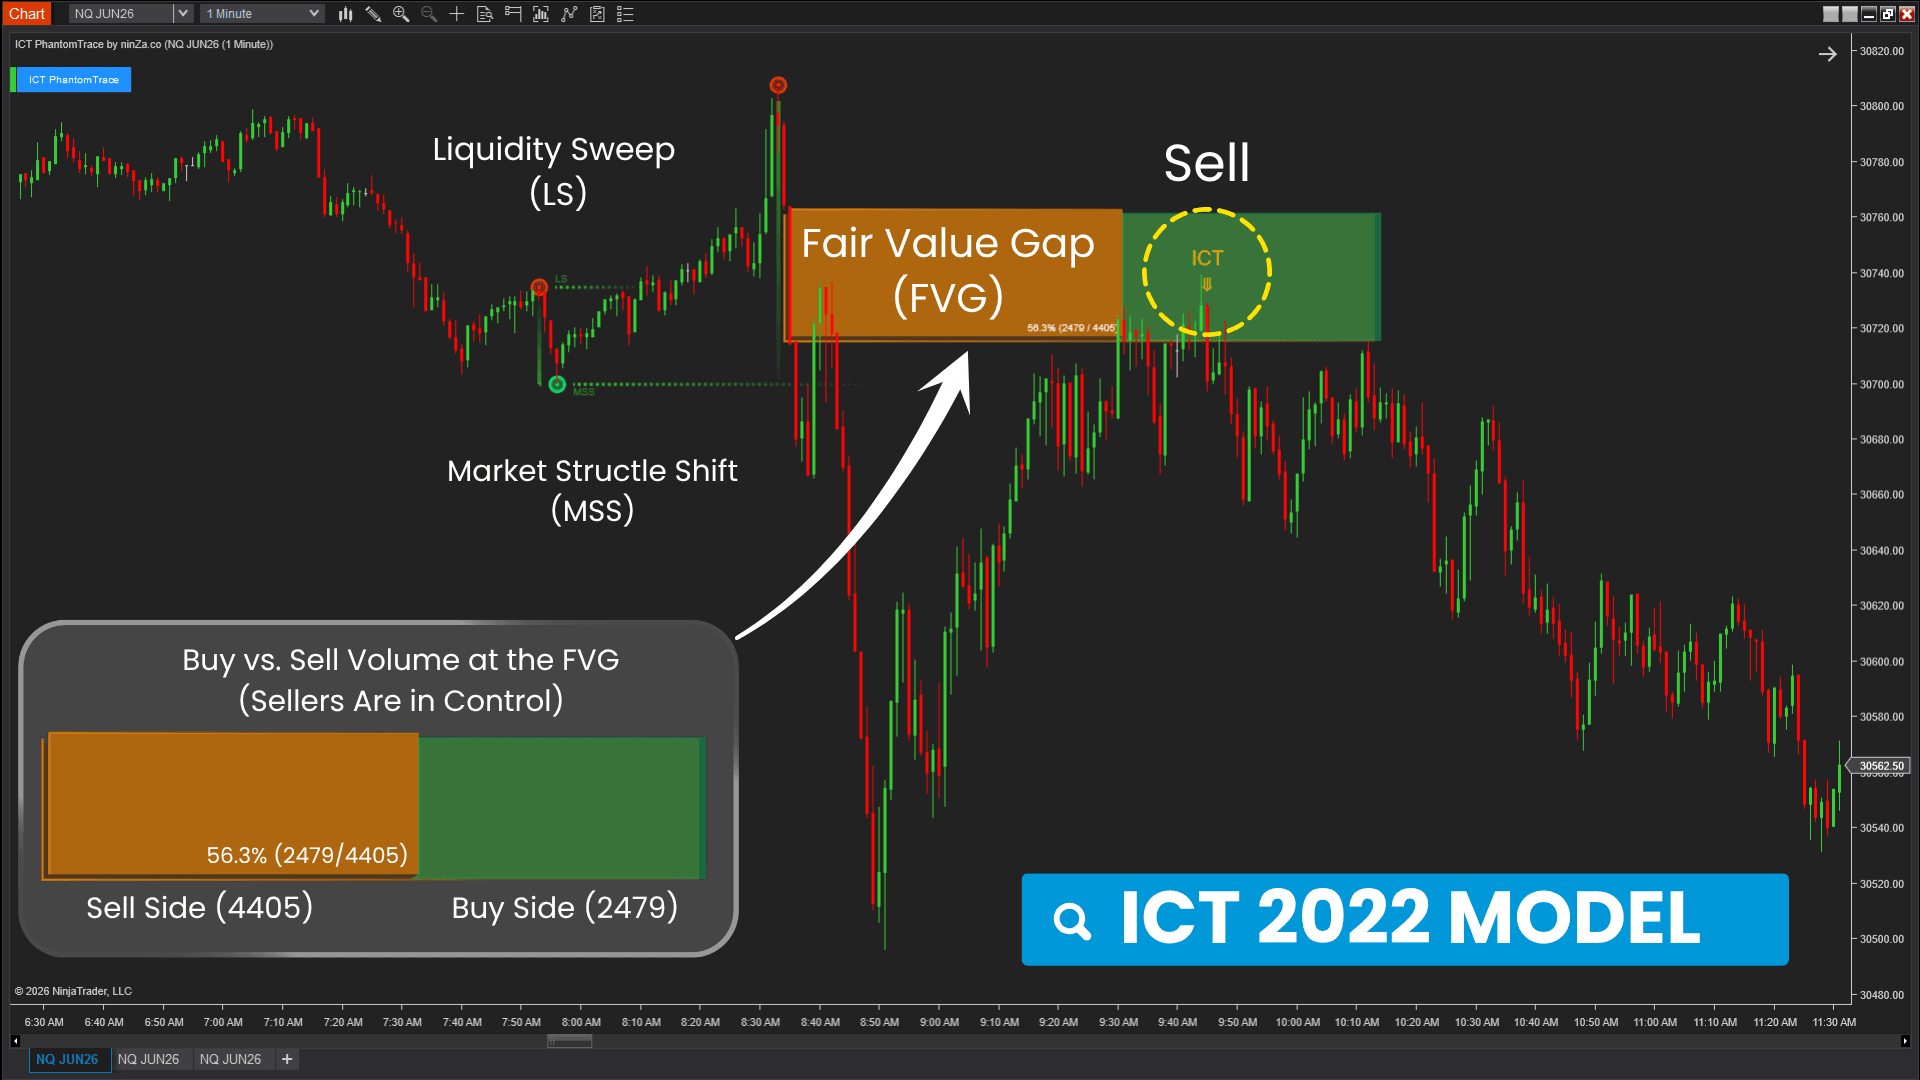
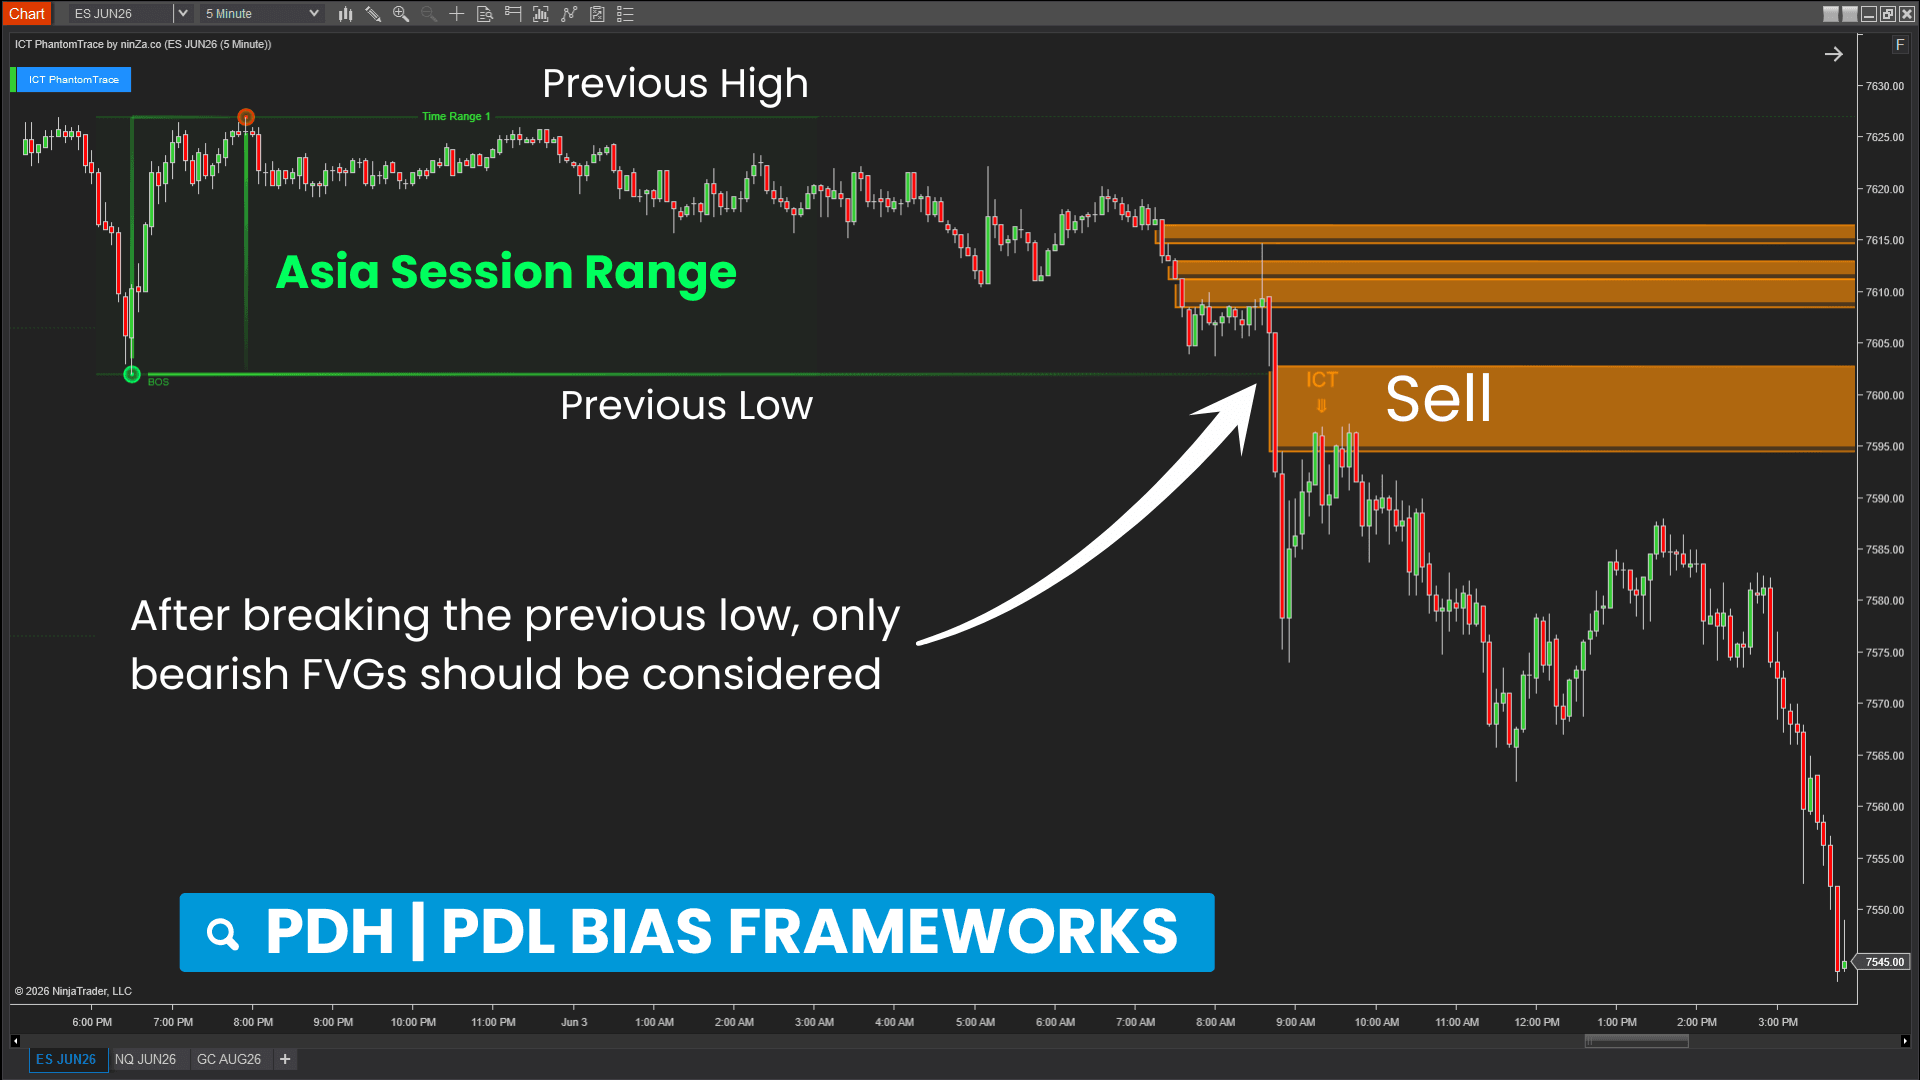
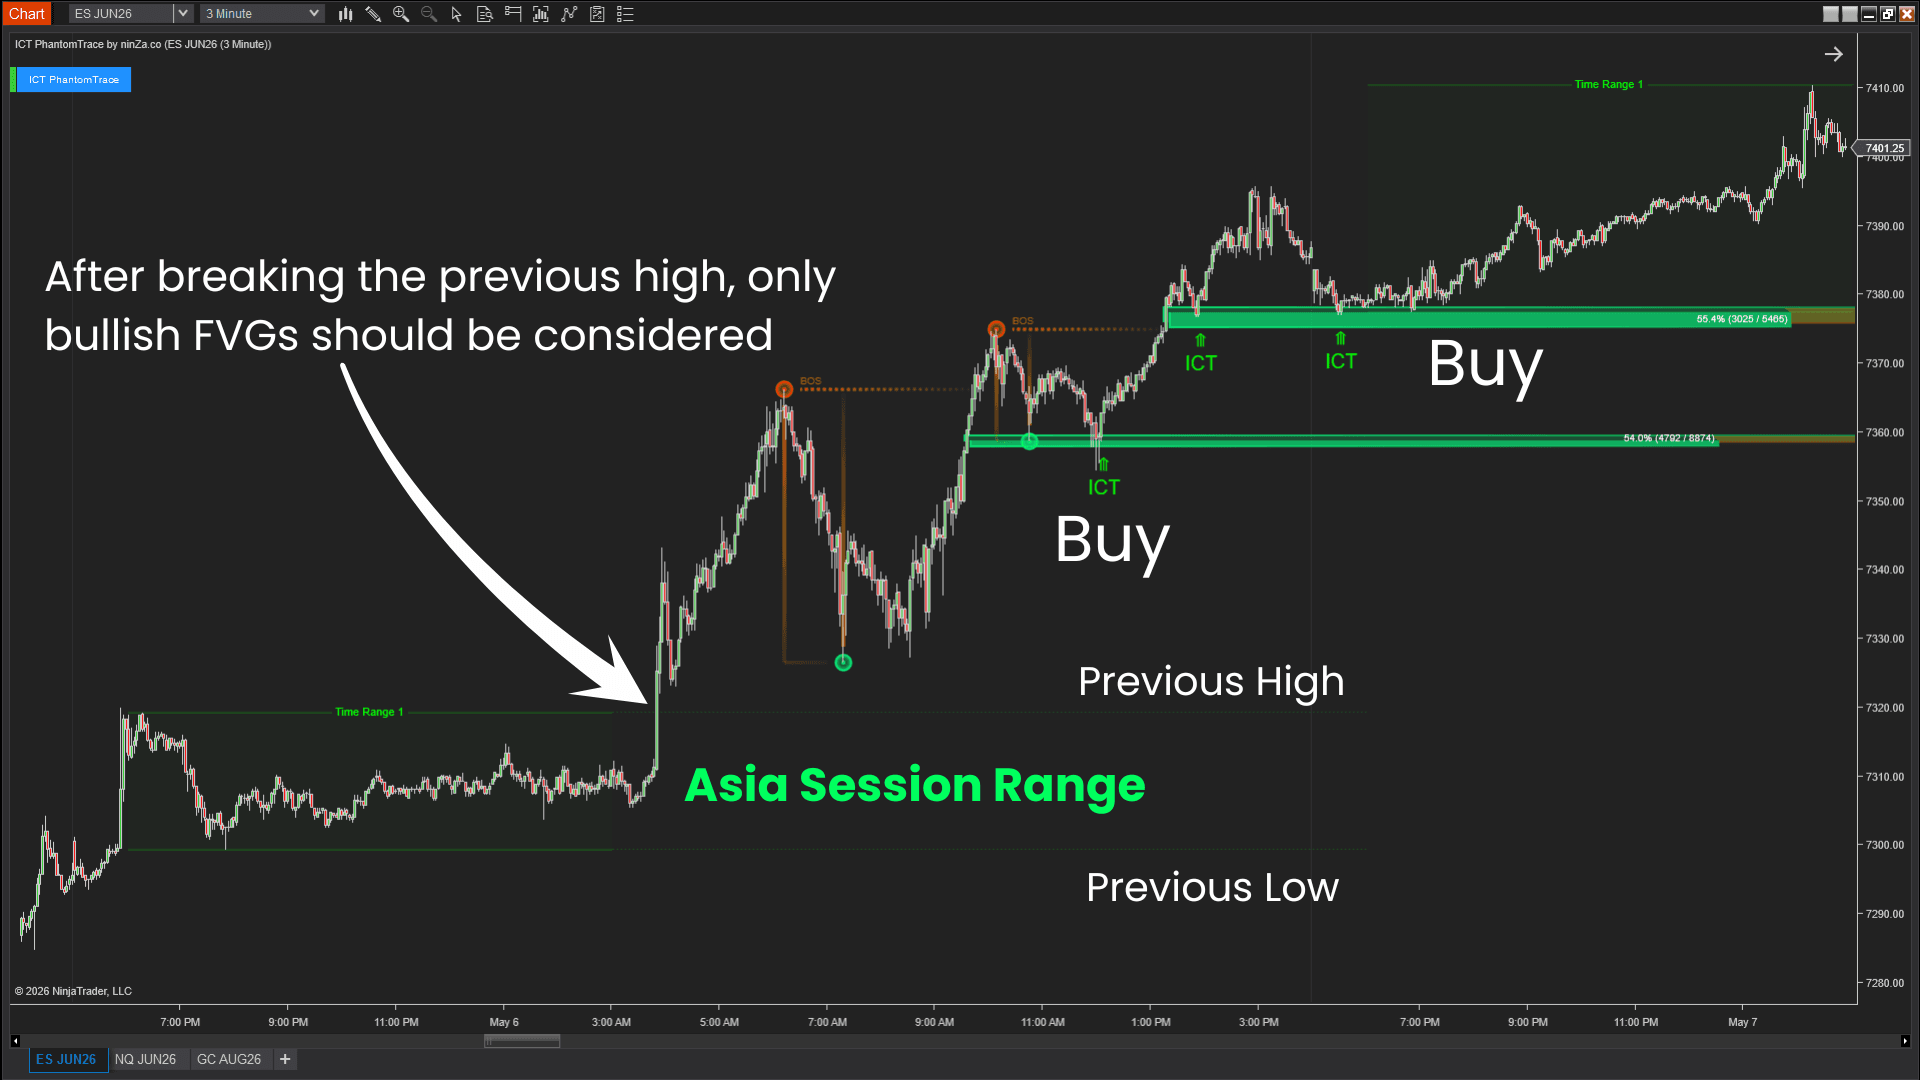
In this replay, James Buchman walks through ICT PhantomTrace on live NQ and ES charts, focusing on how traders can read market structure, liquidity sweeps, BOS areas, and fair value gap retests in real time.
He also explains how these levels helped identify when buyers or sellers were in control during the session, including examples from a sharp sell-off, abullish recovery, and later short-side conditions on the 5-minute chart.
Get [AbsP] ICT PhantomTrace + AAA+ Trend Sync ↓
See how liquidity behavior unfolds in live markets
This video shows how ICT PhantomTrace helps traders move from raw ICT concepts to a clearer, more structured chart-reading workflow.
You’ll see how the indicator filters meaningful FVGs using liquidity sweeps, MSS/BOS, volume data, entry confirmation, and PDL/PDH bias – helping traders focus on cleaner reversal and continuation scenarios instead of reacting to every imbalance on the chart.
In this video, we review several live trading opportunities using ICT 2022 Model while analyzing multiple timeframes to build market bias and identify potential setups.
We also discuss liquidity, fair value gaps, trend continuation, and range-trading conditions as the market unfolds in real time.
This video shows how ICT PhantomTrace helps traders move beyond basic buy/sell signals by visualizing liquidity sweeps, market structure shifts, and institutional price zones.
It gives traders clearer market context, helping them understand who is in control and where higher-probability trade opportunities may develop.
In this video, we explore how liquidity sweeps, market structure shifts, and fair value gaps can help traders understand what the market may be doing next.
You'll also see a live trading session on 50-tick and 1-minute charts, including real trade examples, multi-timeframe analysis, and over 1,000 ticks captured from just 4 trades.
A few questions worth exploring
1. ICT has so many models and setups. Why focus on just these two?
Rather than attempting to cover every setup, the focus is placed on 2 frameworks that can be applied across a wide range of market conditions and trading styles.
ICT 2022 Model helps identify when liquidity begins to shift, while PDH / PDL Bias Framework helps identify where liquidity is likely to be pursued next. Together, they provide a structured view of both market transitions and continuations.
If this approach doesn't fit the way you analyze the market, you're covered by our 30-day exchange guarantee.
2. Why aren't Order Blocks included?
This framework was intentionally built around Fair Value Gaps because they play a central role in both liquidity transitions and liquidity continuation.
Rather than combining multiple ICT concepts into a more complex process, the framework focuses on liquidity, market structure, and price imbalance to create a more structured approach to market analysis.
You'll receive detailed guides, video tutorials, and practical examples designed to help you understand not just how the framework works, but why it works.
3. Does this framework use Kill Zones?
Rather than focusing solely on liquidity sweeps from a previous session, the framework places greater emphasis on identifying the direction liquidity is currently being pursued during the Kill Zone.
Once a liquidity objective has been established, the framework helps you focus on opportunities that align with that objective.
This can provide more trading opportunities than waiting exclusively for sweep-based setups to develop.
We're always available to assist with setup, configuration, and practical guidance. Simply reply, and we'll be happy to help you apply this framework more effectively in your live trading.
4. Is ICT suitable for scalping?
Both frameworks were designed to focus on recurring liquidity behaviors that can be observed across different timeframes, including lower-timeframe environments commonly used by scalpers.
The ICT 2022 Model focuses on liquidity transitions, while the PDH / PDL Bias Framework focuses on liquidity continuation.
Together, they can help identify trading opportunities throughout different phases of market movement rather than relying on a small number of highly specific setups.
If these frameworks aren't a good fit for the way you trade, you're covered by our 30-day exchange guarantee.
Choose the level of support that best matches how you plan to implement the framework
ICT PhantomTrace is currently available through Standard Access, Premium Access, or a combined option with AAA+ Trend Sync.
Select the option that best fits how you want to implement the framework in your trading process.
Designed for traders who are comfortable implementing the framework independently and primarily need access to the software itself.
Combine ICT PhantomTrace with AAA+ Trend Sync to add stronger trend alignment to your liquidity-based trading framework.
Apply ICT PhantomTrace in your own market conditions
Use the framework for up to 30 days. If you decide another trading framework is a better fit for the way you analyze the market, we'll help you exchange ICT PhantomTrace with little or no additional investment.
Determine how you want to implement the framework
[AbsP] ICT PhantomTrace + AAA+ Trend Sync is currently $400.
Standard Access is currently $275.
Select the access level that best fits your implementation preferences.
Download ~ 40 FREE indicators & reach more useful resources !!!
ninZa.co Indicators
0 online
![]()
ninZa.co is an official member of NinjaTrader Ecosystem together with 600+ industry-leading professionals that provide traders with quality trading products & services.


even more payment methods
Quick Links
Instructions
Support
Resources & Information
© Copyright 2026 All Rights Reserved

![]()

Because software products may be copied and stored easily, we will NOT issue refunds of any kind. ALL SALES ARE FINAL & NON-REFUNDABLE!
Futures, foreign currency, and options trading contains substantial risk and is not for every investor. An investor could potentially lose all or more than the initial investment. Risk capital is money that can be lost without jeopardizing one's financial security or lifestyle. Only risk capital should be used for trading and only those with sufficient risk capital should consider trading. Past performance is not necessarily indicative of future results.
Hypothetical performance results have many inherent limitations, some of which are described below. No representation is being made that any account will or is likely to achieve profits or losses similar to those shown; in fact, there are frequently sharp differences between hypothetical performance results and the actual results subsequently achieved by any particular trading program. One of the limitations of hypothetical performance results is that they are generally prepared with the benefit of hindsight. In addition, hypothetical trading does not involve financial risk, and no hypothetical trading record can completely account for the impact of financial risk of actual trading. For example, the ability to withstand losses or to adhere to a particular trading program in spite of trading losses are material points which can also adversely affect actual trading results. There are numerous other factors related to the markets in general or to the implementation of any specific trading program which cannot be fully accounted for in the preparation of hypothetical performance results and all which can adversely affect trading results.
NinjaTrader® is a registered trademark of NinjaTrader Group, LLC. No NinjaTrader company has any affiliation with the owner, developer, or provider of the products or services described herein, or any interest, ownership or otherwise, in any such product or service, or endorses, recommends or approves any such product or service.