_1784772815601.jpg)
“Zaccess” for traders navigating challenging times
Receive up to $500 in purchase assistance toward eligible products.
![[NEW trading strategy] BigTrade Sweep + LIQ Sweep Hunter](https://forestcms.nyc3.digitaloceanspaces.com/media/small_Thumbnail LIQ Sweep Hunter + Big Trade Sweep_1784773279263.jpg)
[NEW trading strategy] BigTrade Sweep + LIQ Sweep Hunter
What causes a Big Reversal? Liquidity isn’t enough
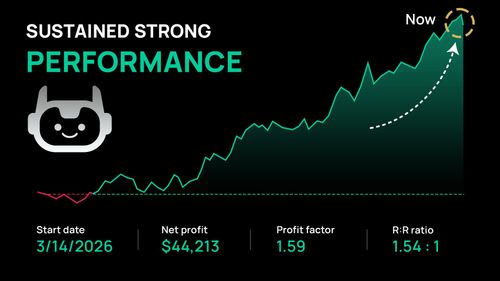
Passed Bulenox with a 3-month backtest
See how this 100% automated trading system performed on both MNQ and NQ.
![[LIVE trading] Reading market balance with Auction ∆xis](https://forestcms.nyc3.digitaloceanspaces.com/media/small_Thumbnail Live trading Auction ∆xis (James)_1784773724325.jpg)
[LIVE trading] Reading market balance with Auction ∆xis
Watch James Buchman use Auction ∆xis to identify key levels, trade live, and project price targets.
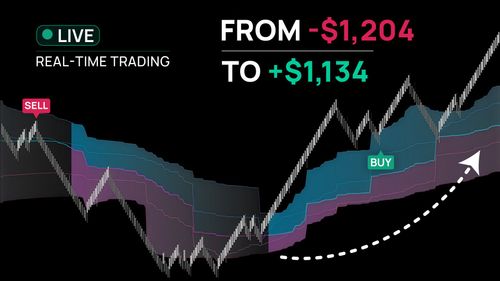
Recovering from a $1,100 drawdown
Watch how 25+ live trades using VWAP helped rebuild the account step by step.
![[July Exclusive] Liberty Edge Bundle](https://forestcms.nyc3.digitaloceanspaces.com/media/small_liberty-edge-bundle-hdhdh_1783139262484.png)
[July Exclusive] Liberty Edge Bundle
From market analysis to trade execution — in one structured workflow.
[AbsP] FlowVision
Turn complex order flow into a clear decision-making process
Track liquidity, participation, absorption, and imbalance in real time - without constantly reading every footprint number.

The problem
Most traders don't struggle because they lack information
Too much data, not enough clarity
You see liquidity sweeps, aggressive buying, and delta expansion – yet price still reverses. You spend too much time reading order flow and not enough time understanding what the market is actually doing.
More tools, same result
Footprints. Delta. DOM. Volume Profile. Liquidity concepts. More indicators. Yet clarity never seems to improve. The issue isn't which tool you're using – it's that each tool is being read in isolation.
Order flow is not about individual signals – it's about context
Liquidity. Participation. Absorption. Imbalance. Reaction. The real edge comes from understanding how these pieces interact, not from analyzing them separately. This framework was built around that idea.
The approach
Not another collection of indicators
The objective is not to generate more signals. The objective is to create a visual order flow language – a framework that helps traders read the interaction between market components, not study each one in isolation.
That interaction is often where the most valuable information exists.
→
Where is liquidity being targeted?
→
Who became aggressive after the sweep?
→
Is that aggression gaining acceptance?
→
Is participation being absorbed?
→
Is the move strong enough to continue?

A multi-layer order flow framework
5 complementary tools that work together
Each layer reveals a different aspect of market behavior. Together, they form a complete picture of what is happening beneath the candles.

LIQ Sweep Hunter
Markets require liquidity. Large participants cannot execute meaningful size without sufficient opposing orders. LIQ Sweep Hunter helps identify when liquidity has been activated, when a sweep has occurred, and whether the market accepts or rejects the move afterward.
Instead of chasing breakouts during the stop hunt, traders gain a structured view of what happens once liquidity has been collected.
 2026_02_09 (8_52_44 PM)_1781518645318.png)
 2026_02_10 (3_46_19 AM)_1781518644888.png)
 2026_02_09 (8_56_54 PM)_1781518643968.png)
 2026_02_10 (8_59_55 PM)_1781518643635.png)
 2026_02_09 (3_47_07 AM)_1781518643627.png)
 2026_02_09 (3_46_48 AM)_1781518643065.png)
 2026_02_05 (9_10_44 PM)_1781518642732.png)
 2026_02_05 (9_11_10 PM)_1781518642427.png)
- Buy-side liquidity sweeps
- Sell-side liquidity sweeps
- Hidden liquidity around trailing stops
- Confirmed continuation after sweeps
- Potential structural reversals
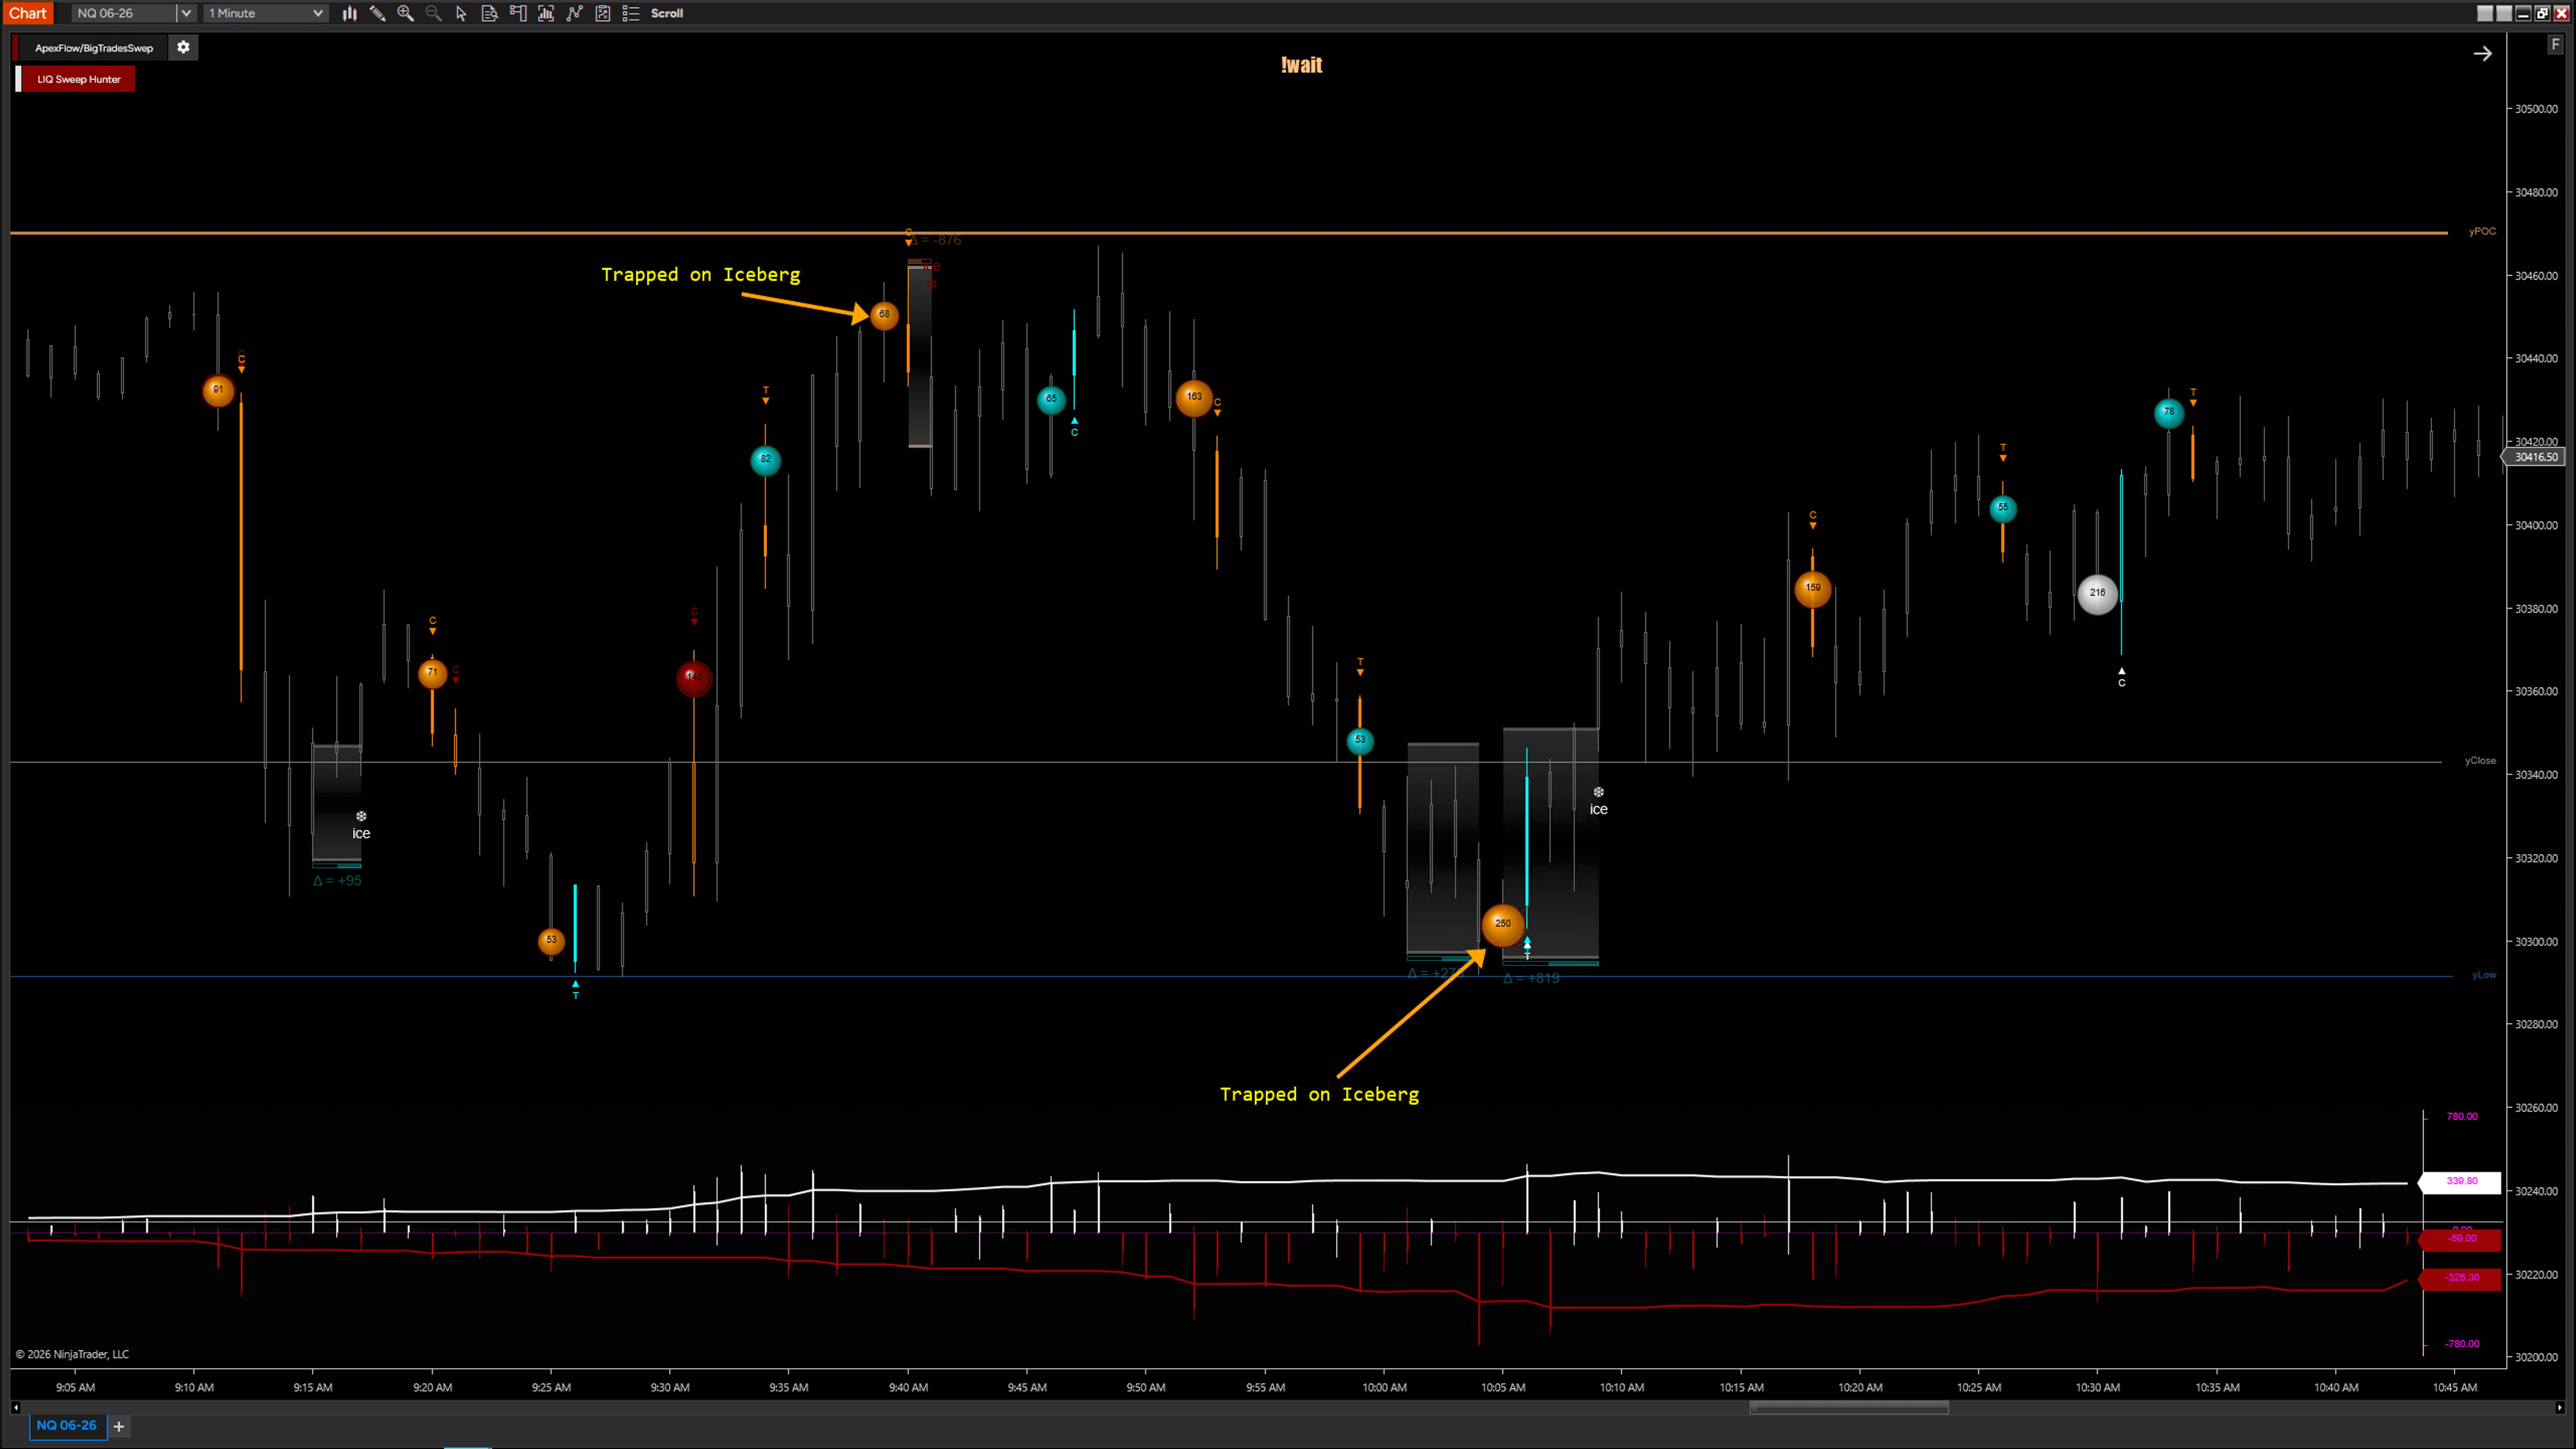
BigTrade Sweep
Volume alone rarely tells the entire story. What matters is where participation enters and how the market responds afterward. BigTrade Sweep analyzes tick-level execution data to identify concentrated bursts of aggressive buying and selling activity.
Through Volume Heat Bubbles and continuation/trap analysis, traders can quickly identify areas where meaningful participation enters the market.
 2026_05_27 (4_15_56 AM)_1781518696250.png)
 2026_05_27 (4_15_26 AM)_1781518695143.png)
 2026_05_27 (4_13_27 AM)_1781518693664.png)
 2026_05_27 (4_15_00 AM)_1781518693545.png)
 2026_05_27 (4_13_43 AM)_1781518693318.png)
 2026_05_27 (4_14_45 AM)_1781518693195.png)
 2026_05_27 (4_13_14 AM)_1781518692994.png)
 2026_05_27 (4_14_29 AM)_1781518692858.png)
- Aggressive buyers lifting the offer
- Aggressive sellers hitting the bid
- Areas of concentrated participation
- Continuation after heavy participation
- Potential trap conditions
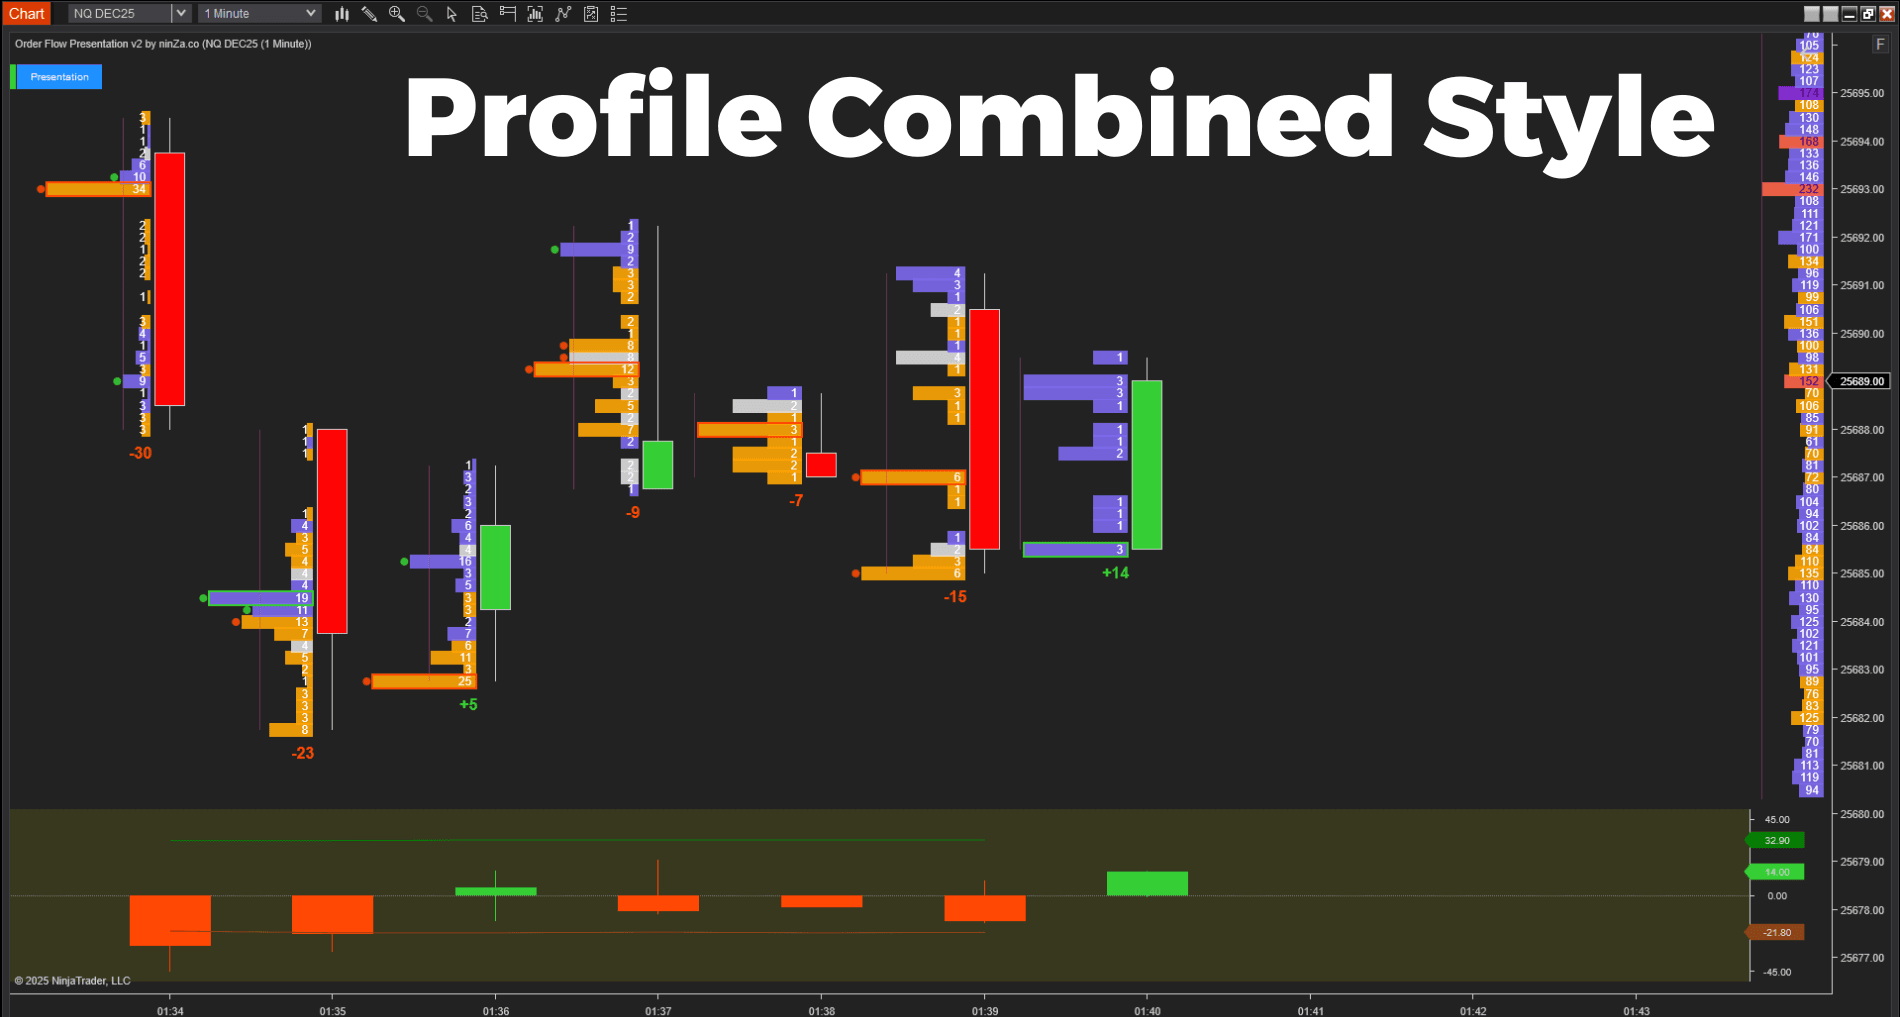
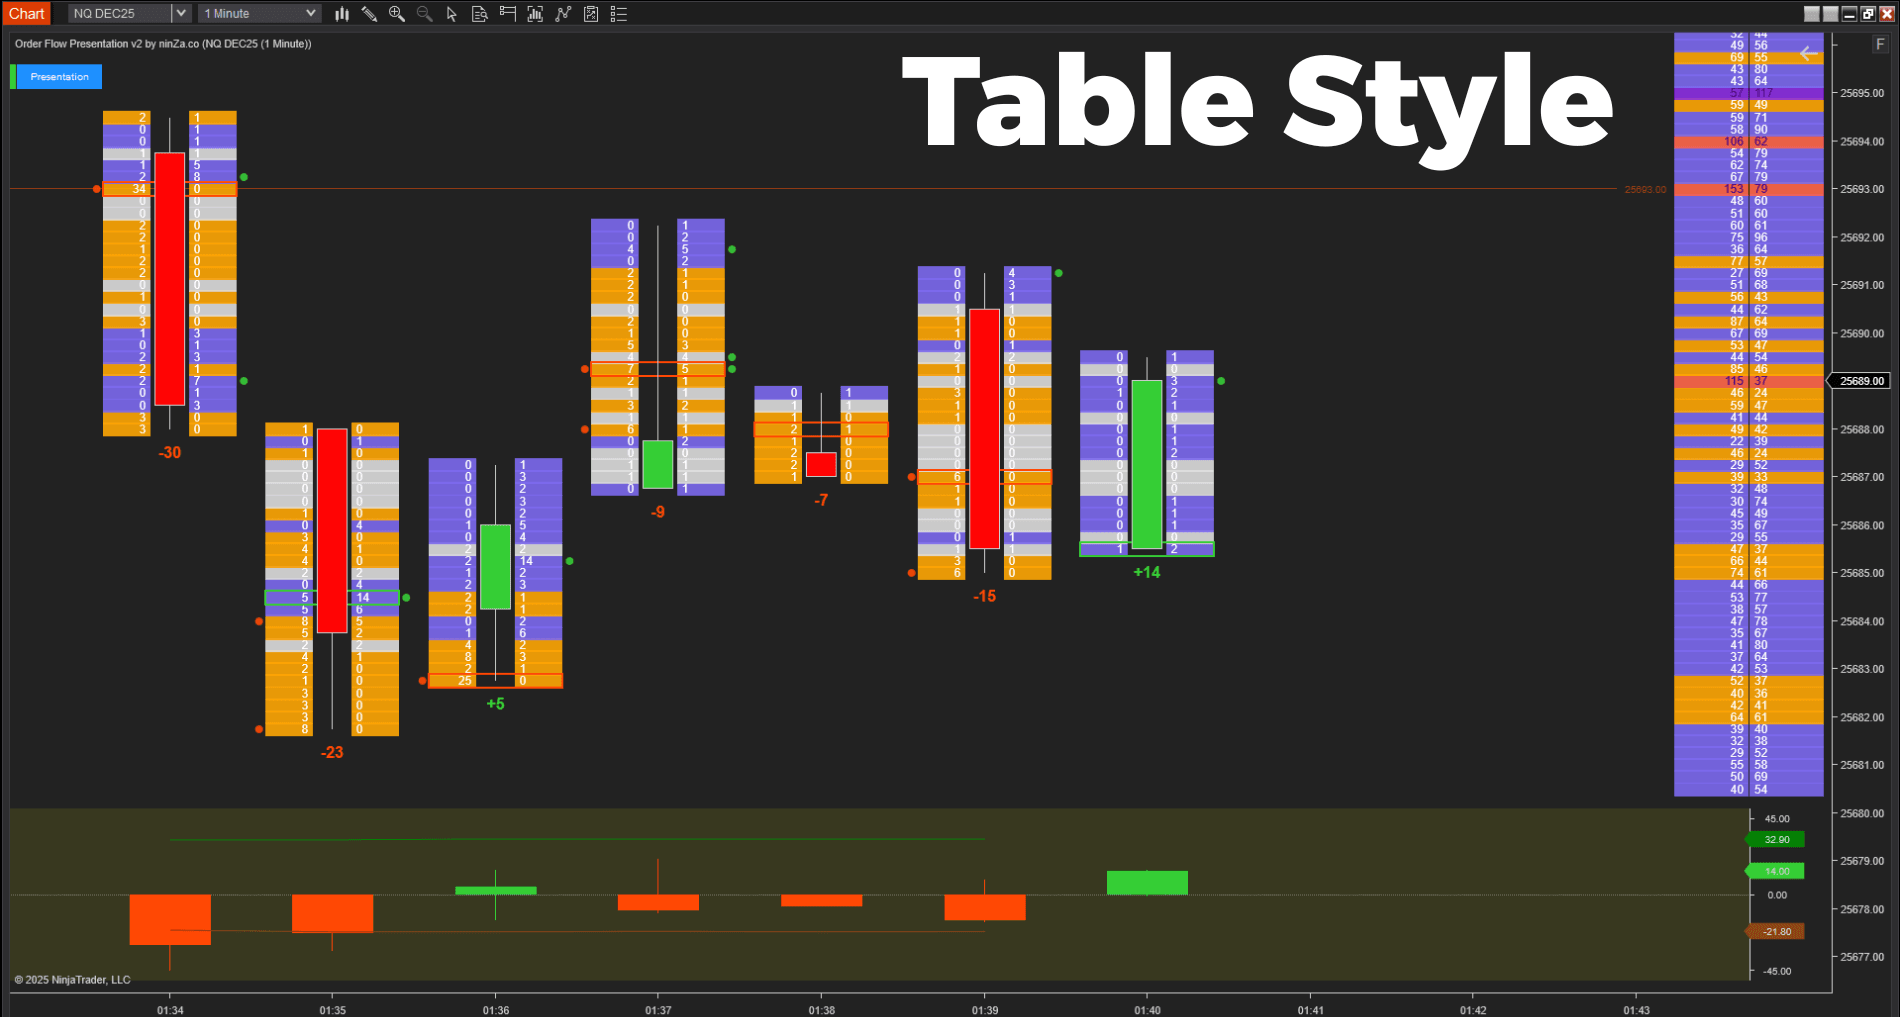
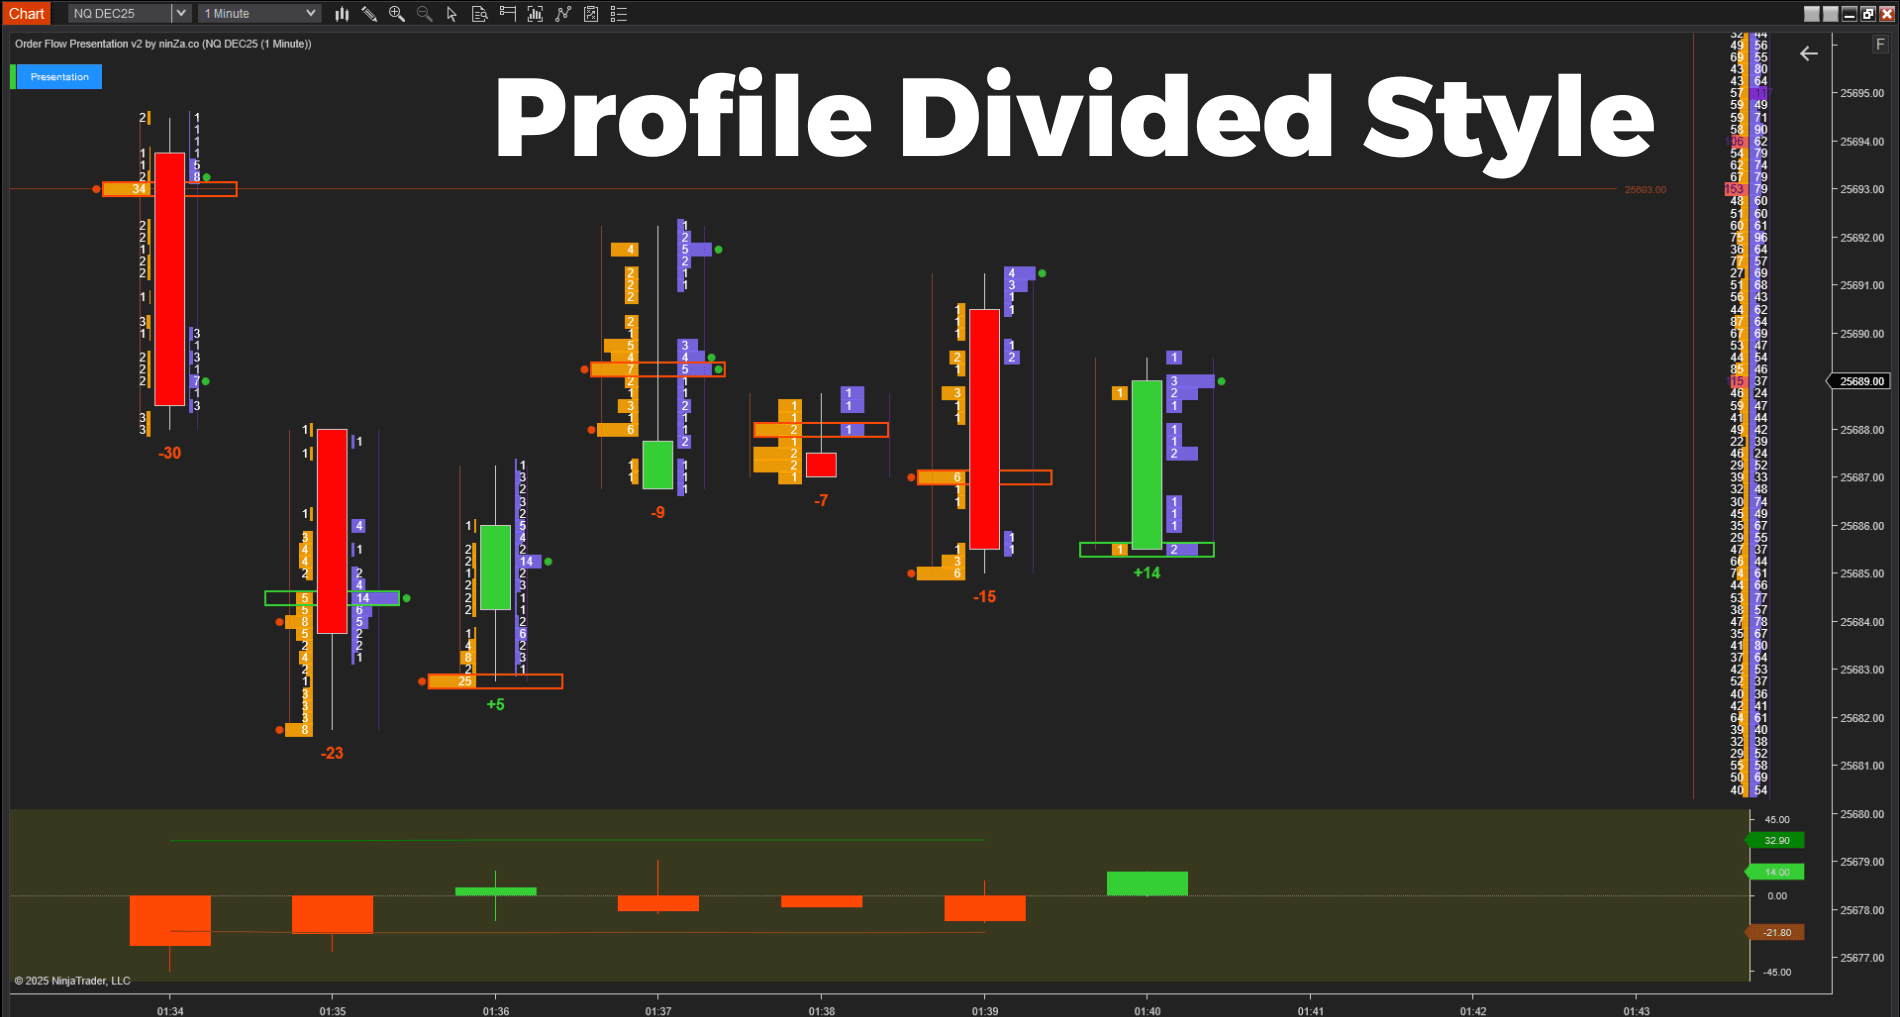
Order Flow Presentation v2
Order flow is not just about where activity occurred – it is also about how that activity develops. Order Flow Presentation v2 reveals the internal structure of buying and selling pressure through advanced delta analysis across both time and price.
Rather than focusing only on the final result, traders gain insight into how participation evolves throughout the auction.
_1781518829734.png)
_1781518827935.png)
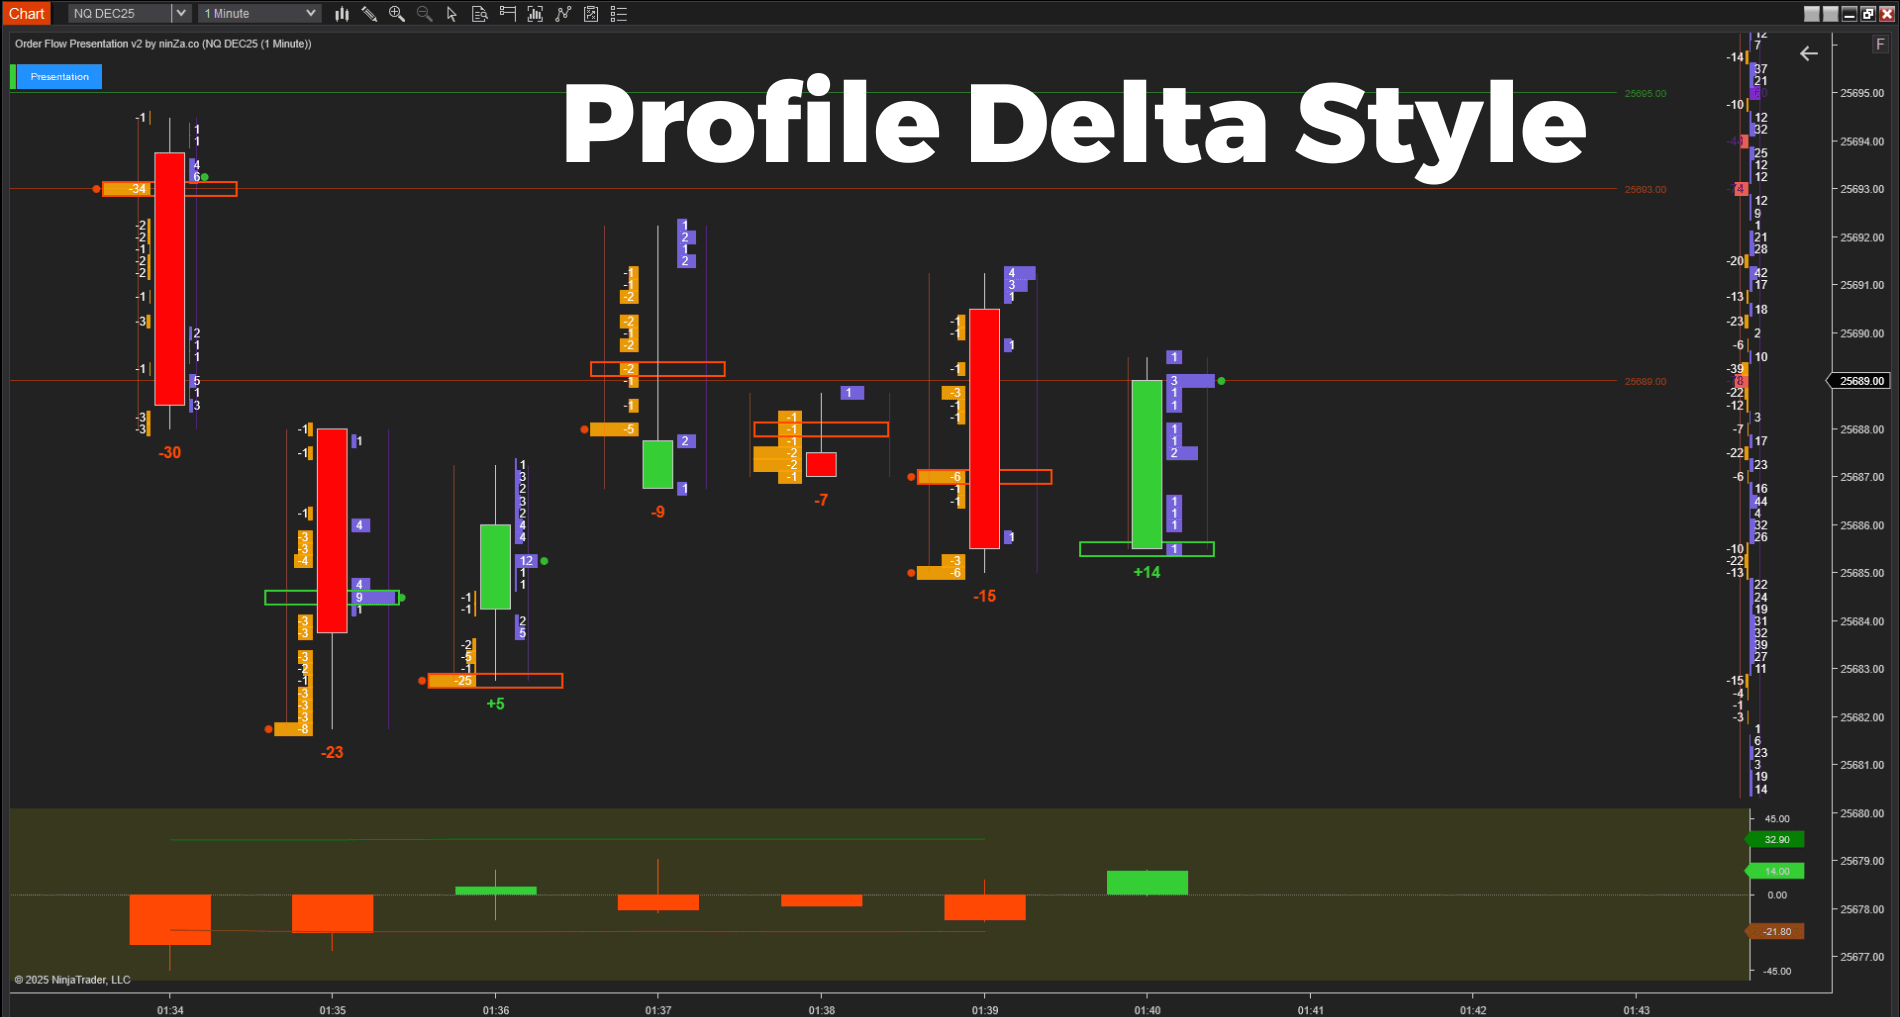
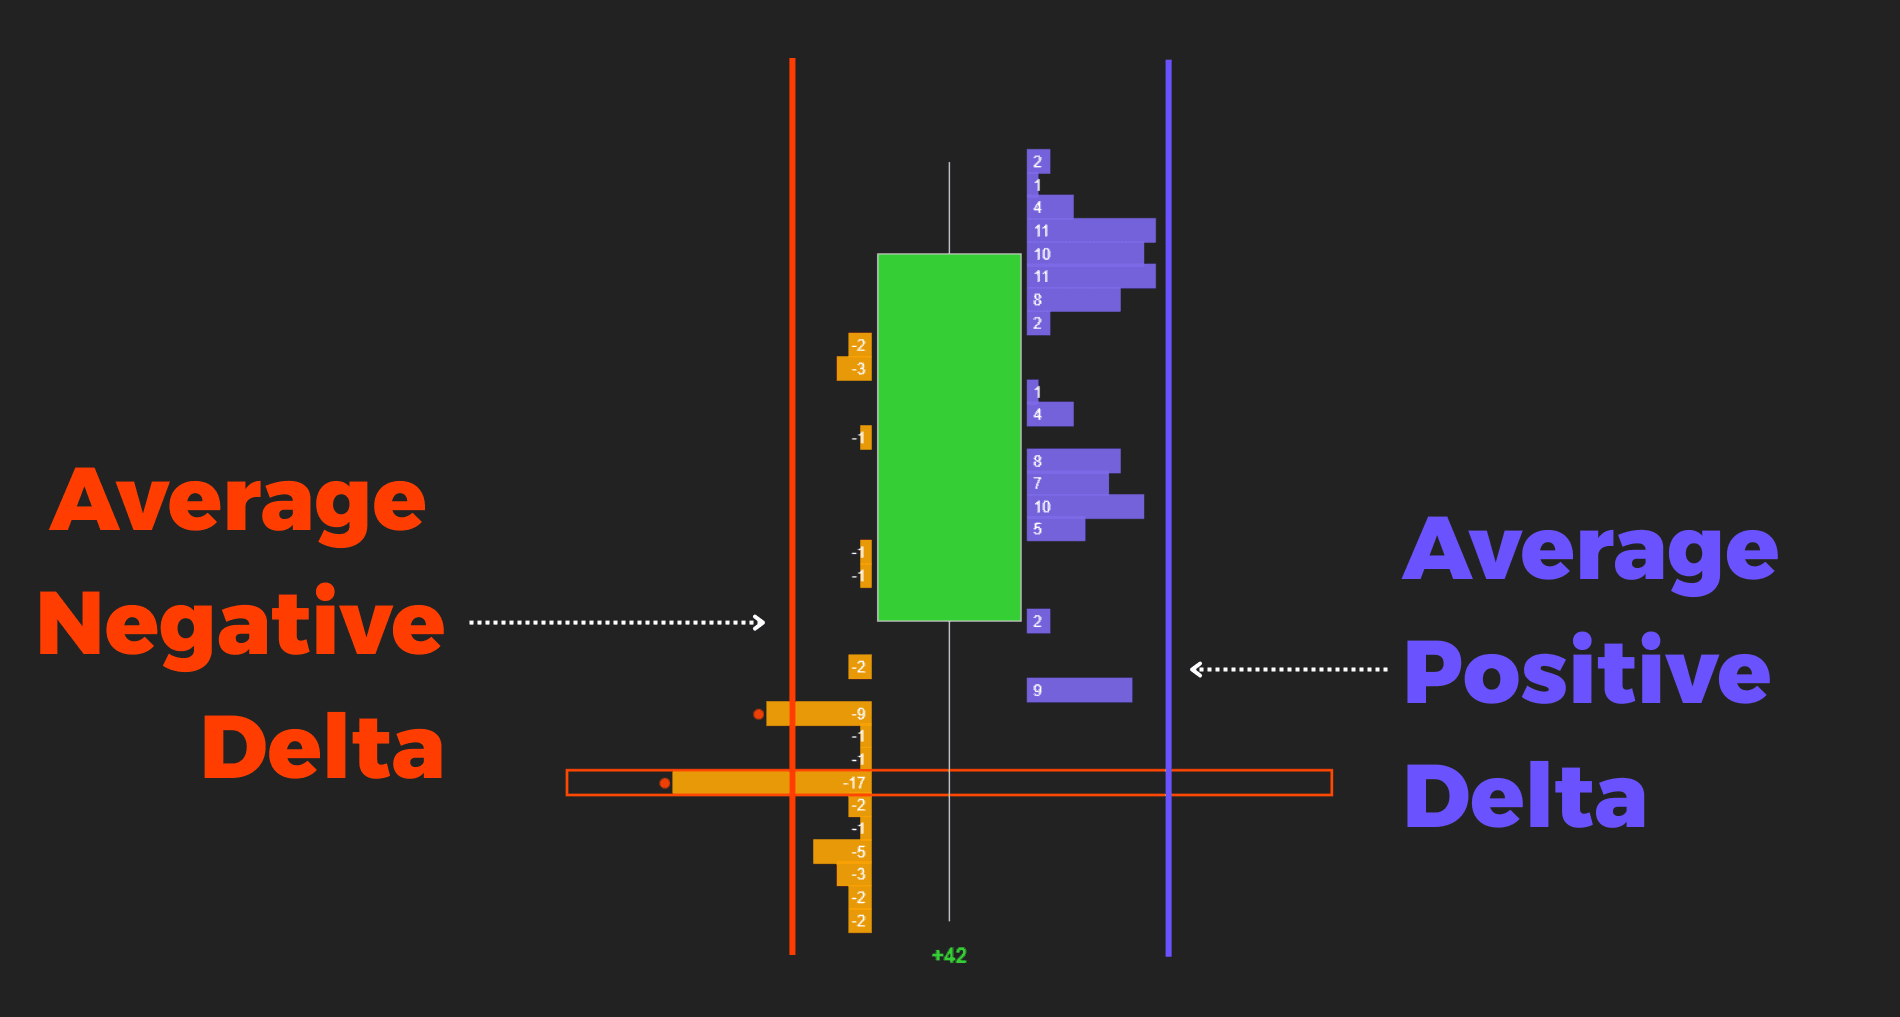
- Delta expansion and contraction
- Intrabar order flow behavior
- Absorption versus aggression
- Significant imbalance levels
- Momentum shifts before they become obvious in price
Sonarlike Iceberg Finder
Aggressive participation does not always move the market. Sometimes it encounters significant opposing liquidity. Sonarlike Iceberg Finder helps identify areas where absorption may be developing and where control may be shifting between buyers and sellers.
By highlighting Pressure Zones, Ice Zones, and confirmed structural breakouts, traders gain additional context about whether participation is succeeding or being absorbed.
_1781572532893.png)
_1781572532595.png)
_1781572529143.png)
_1781572528837.png)
_1781572528719.png)
_1781572528662.png)
_1781572528409.png)
_1781572528241.png)
- Potential absorption zones
- Areas of hidden participation
- Market control transitions
- Failed aggressive moves
- Confirmed breakout opportunities
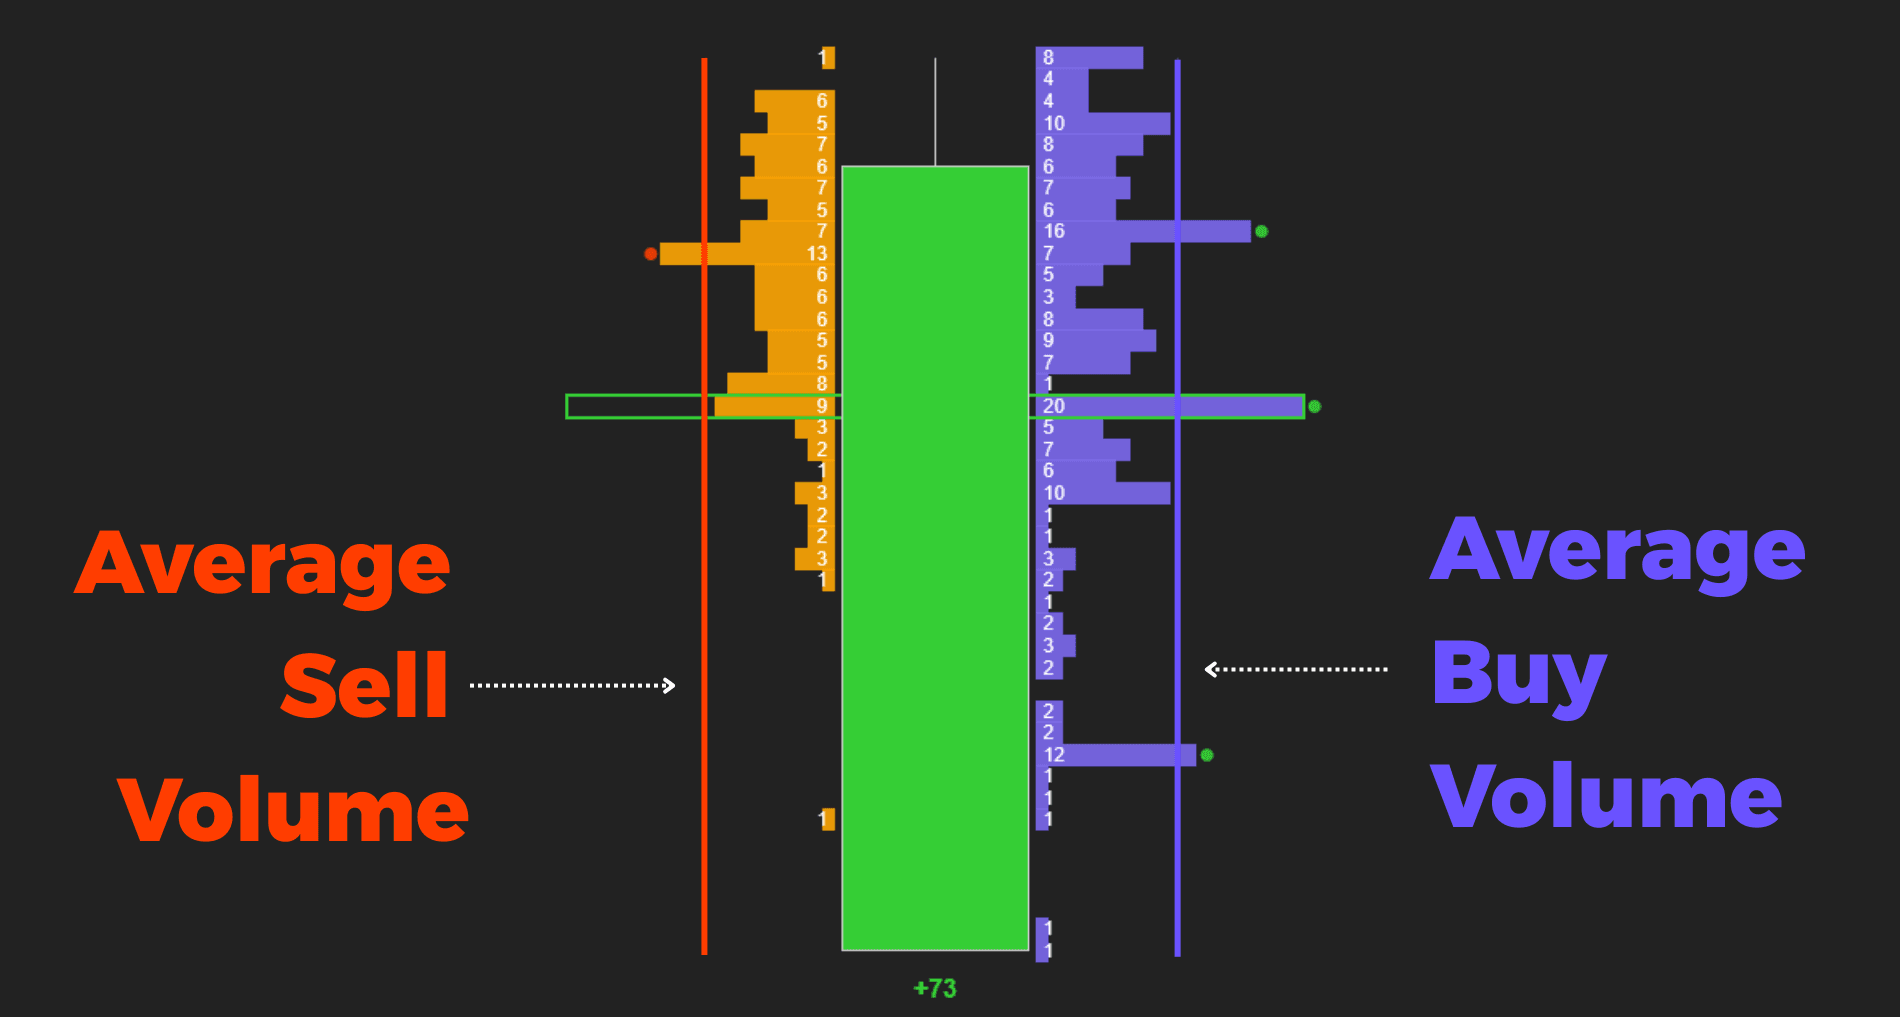
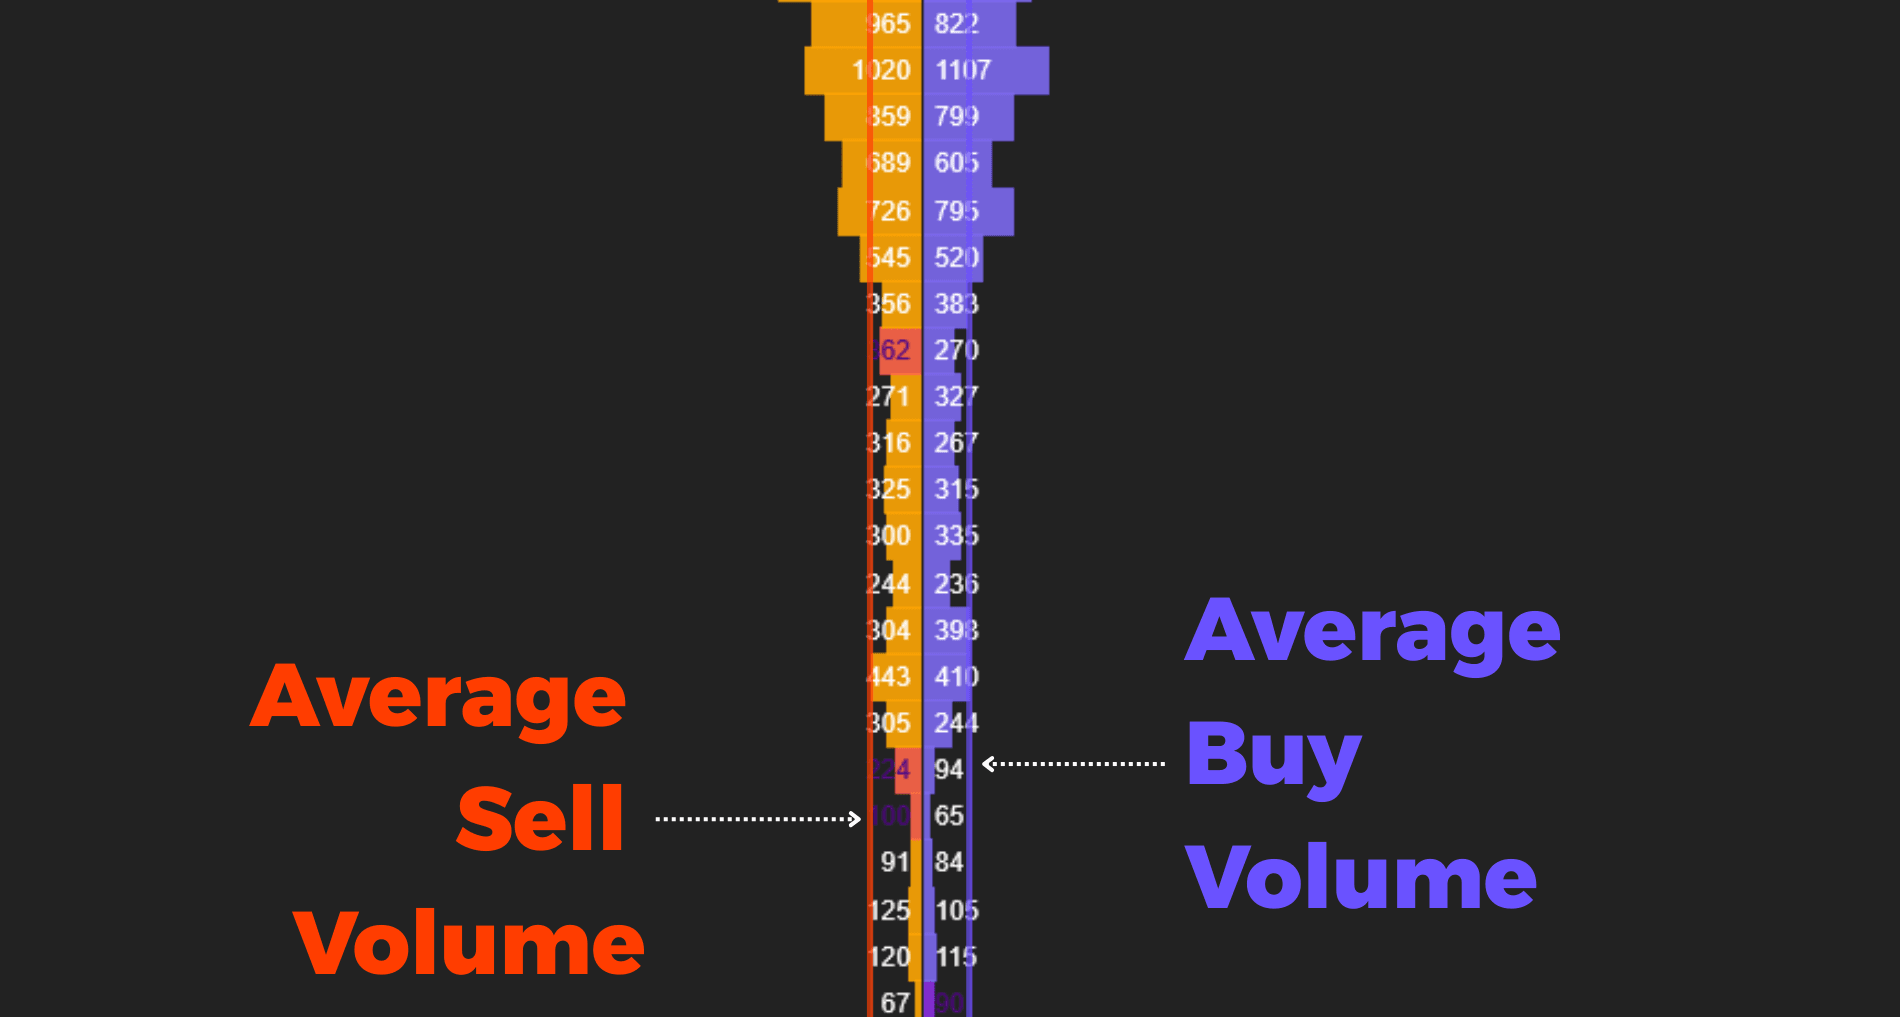
Imbalance Volume Sensor
Not every move is supported by meaningful participation. Imbalance Volume Sensor analyzes order flow at the individual price level to identify areas where buyers or sellers have established clear control.
The indicator also helps traders evaluate whether effort is producing results or whether momentum may be weakening beneath the surface.
 2024_12_05 (3_23_53 AM)_1781572788221.png)
 2024_12_05 (3_24_30 AM)_1781572788128.png)
 2024_12_05 (3_02_43 AM)_1781572785747.png)
 2024_12_04 (1_17_17 AM)_1781572785748.png)
 2024_12_04 (2_24_26 AM)_1781572785746.png)
 2024_12_04 (2_24_10 AM)_1781572784762.png)
 2024_12_03 (3_30_51 AM)_1781572784734.png)
 2024_12_03 (3_35_27 AM)_1781572784650.png)
- Overall imbalance zones
- Absolute imbalance levels
- Pullbacks into participation zones
- Trend slowdown warnings
- Effort versus result divergence
How professional traders use the framework
From prediction to observation
The goal is not more signals. It's better context.
This framework was built around a simple idea:
Reduce the need to constantly read footprint numbers and let the chart communicate order flow through visual context.
Rather than focusing on individual signals, the objective is to understand how liquidity, participation, absorption, imbalance, and market reaction interact with each other.
The following examples show how these relationships can help create a clearer order flow narrative.
Example 01
Aggression meets absorption
A potential absorption area develops near an important level. Aggressive buying enters. Under normal conditions, price would continue higher. Instead, price stalls – the buying effort is visible, but the continuation is not.
Absorption area develops
Aggressive buying enters
Price stalls – no continuation
Market reacts lower
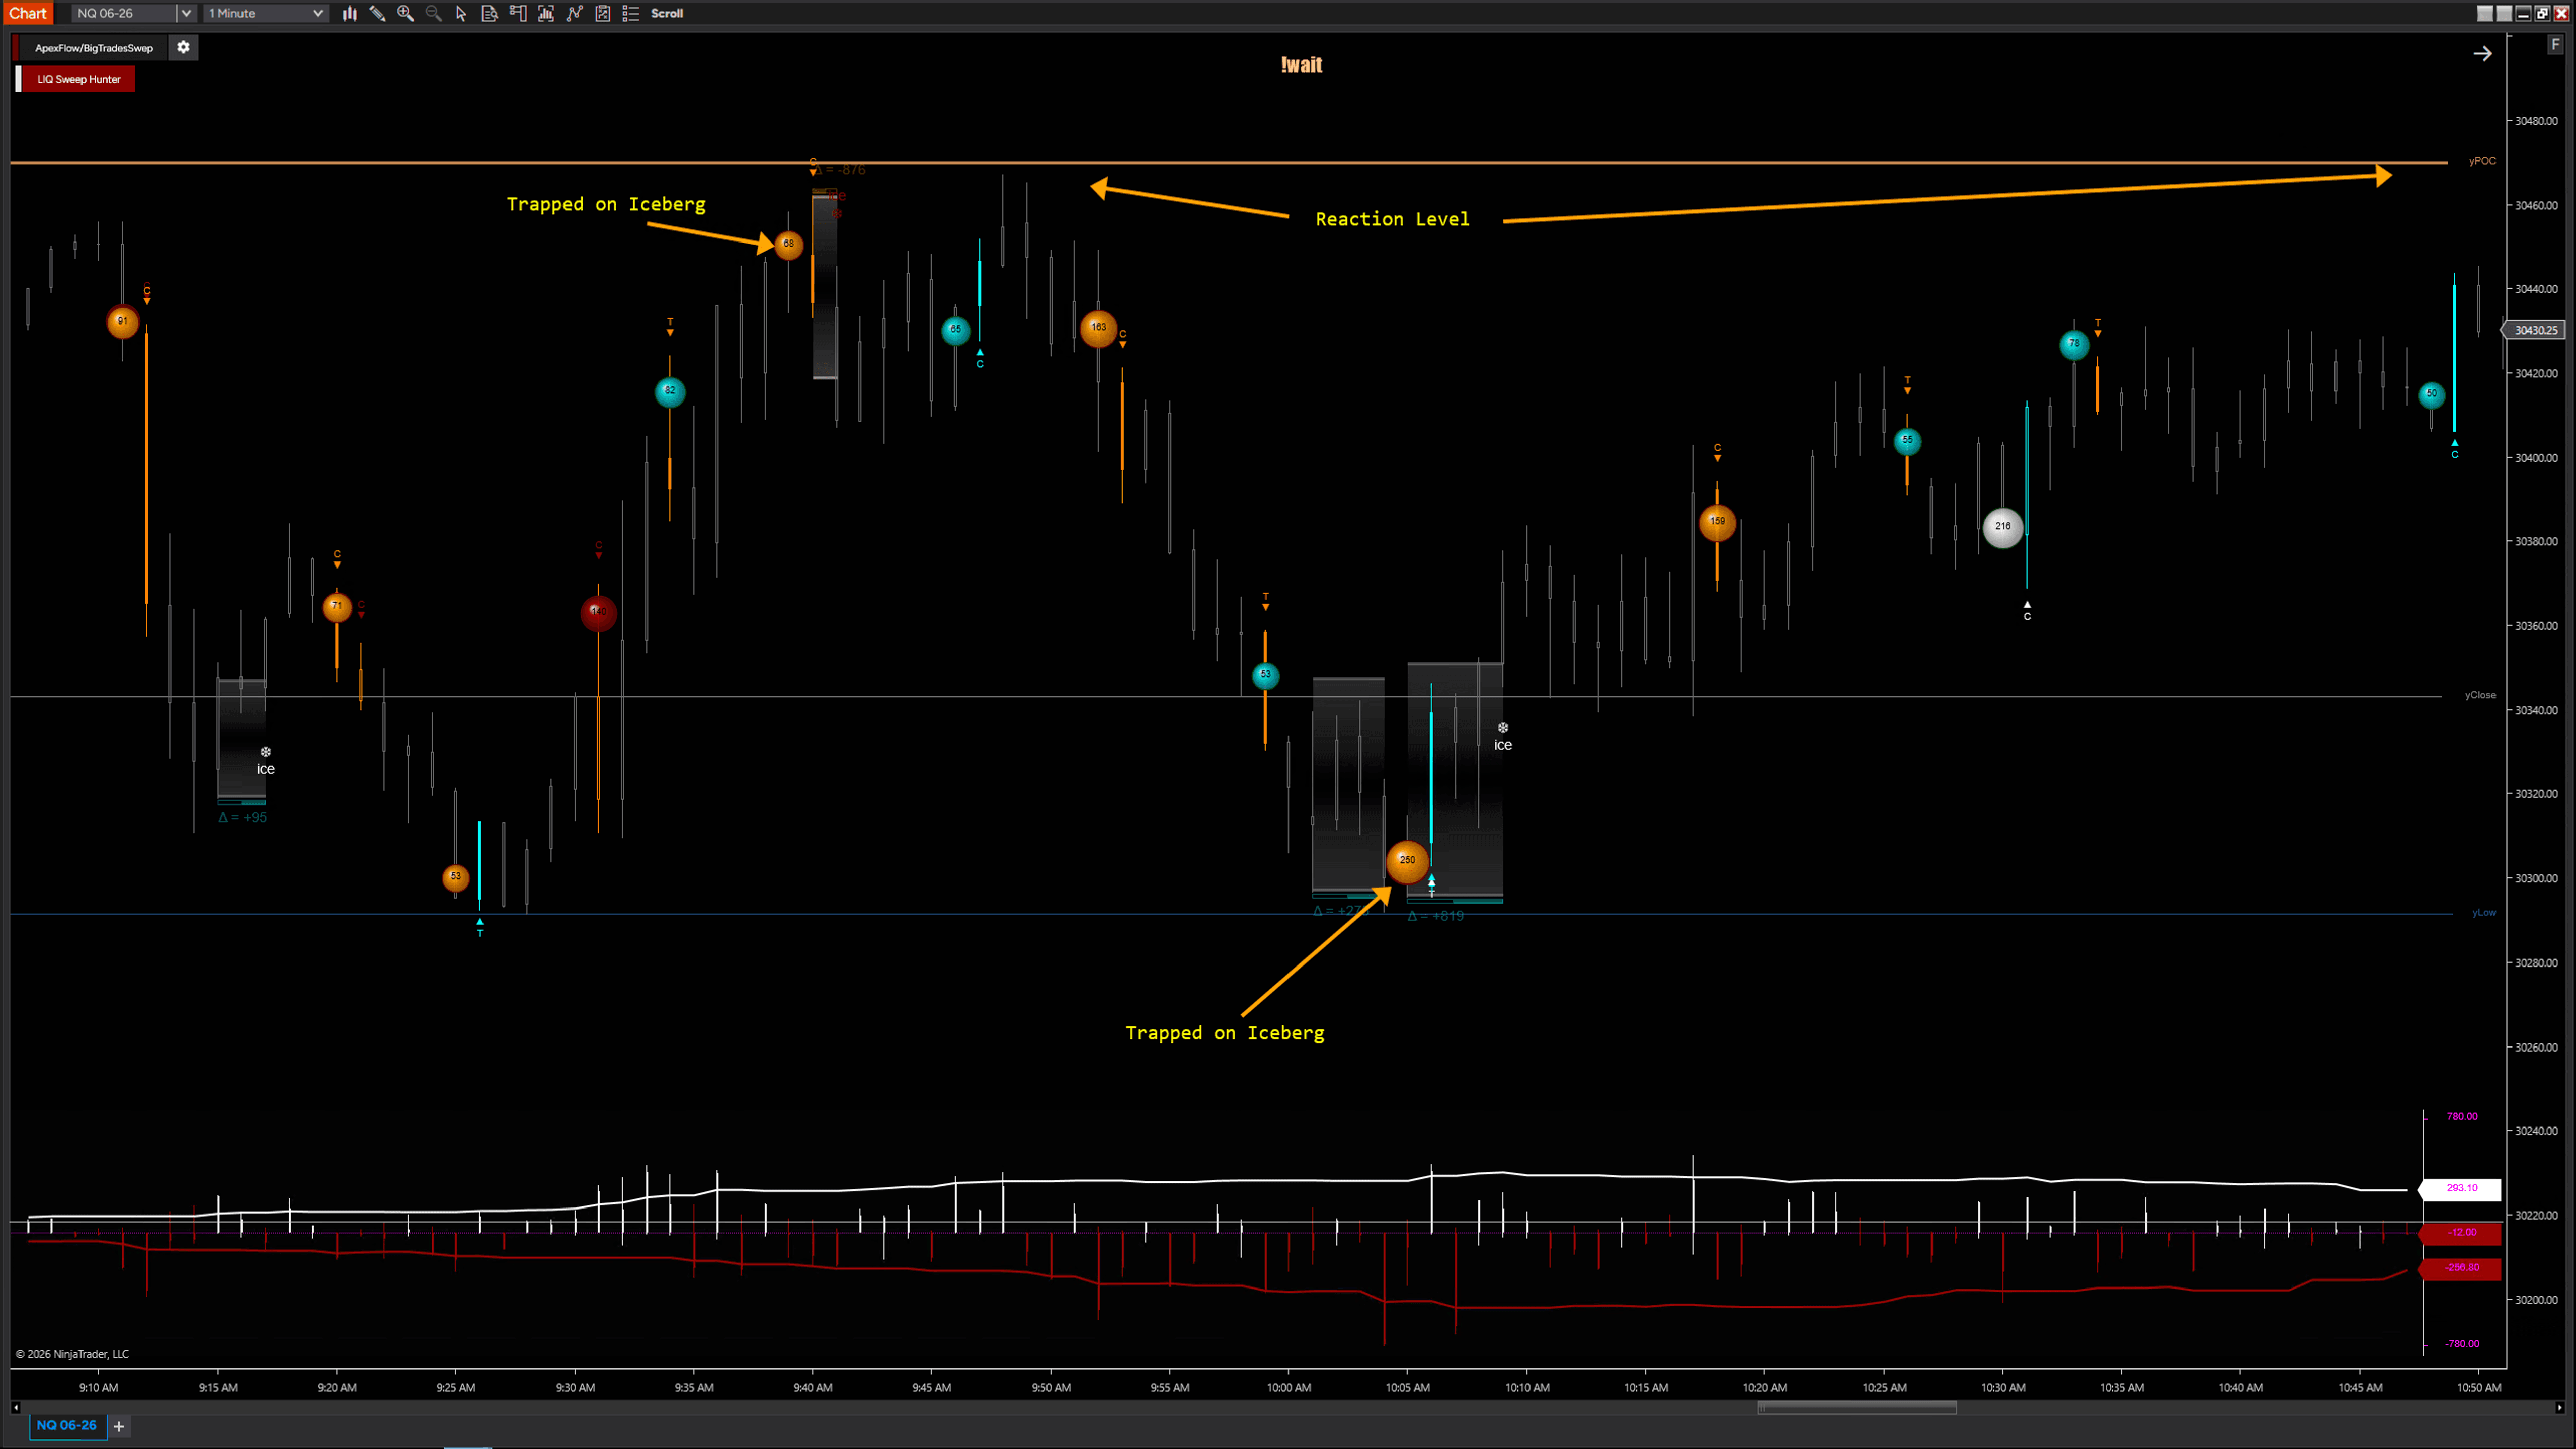
Example 02
Failed continuation around value
The yPOC serves as the primary reference level.
Price initially reacts higher with strong buying participation, but the move fails to generate clean continuation. A potential absorption area develops, suggesting buyers may be losing control.
Later, price returns to the yPOC.
Sellers attempt to push the market lower, but the downside move quickly loses acceptance as another potential absorption reaction appears.
The result is a failed continuation on both sides of the market.
Buyers fail to continue higher. Sellers fail to continue lower.
Price ultimately rejects lower levels and responds strongly to the upside.
The sequence becomes clear: Aggressive buying, Failed continuation, Return to value, Aggressive selling, Failed continuation, Strong upside reaction.
Rather than focusing on individual signals, the framework helps reveal how participation, absorption, and market response interact around a key reference level.
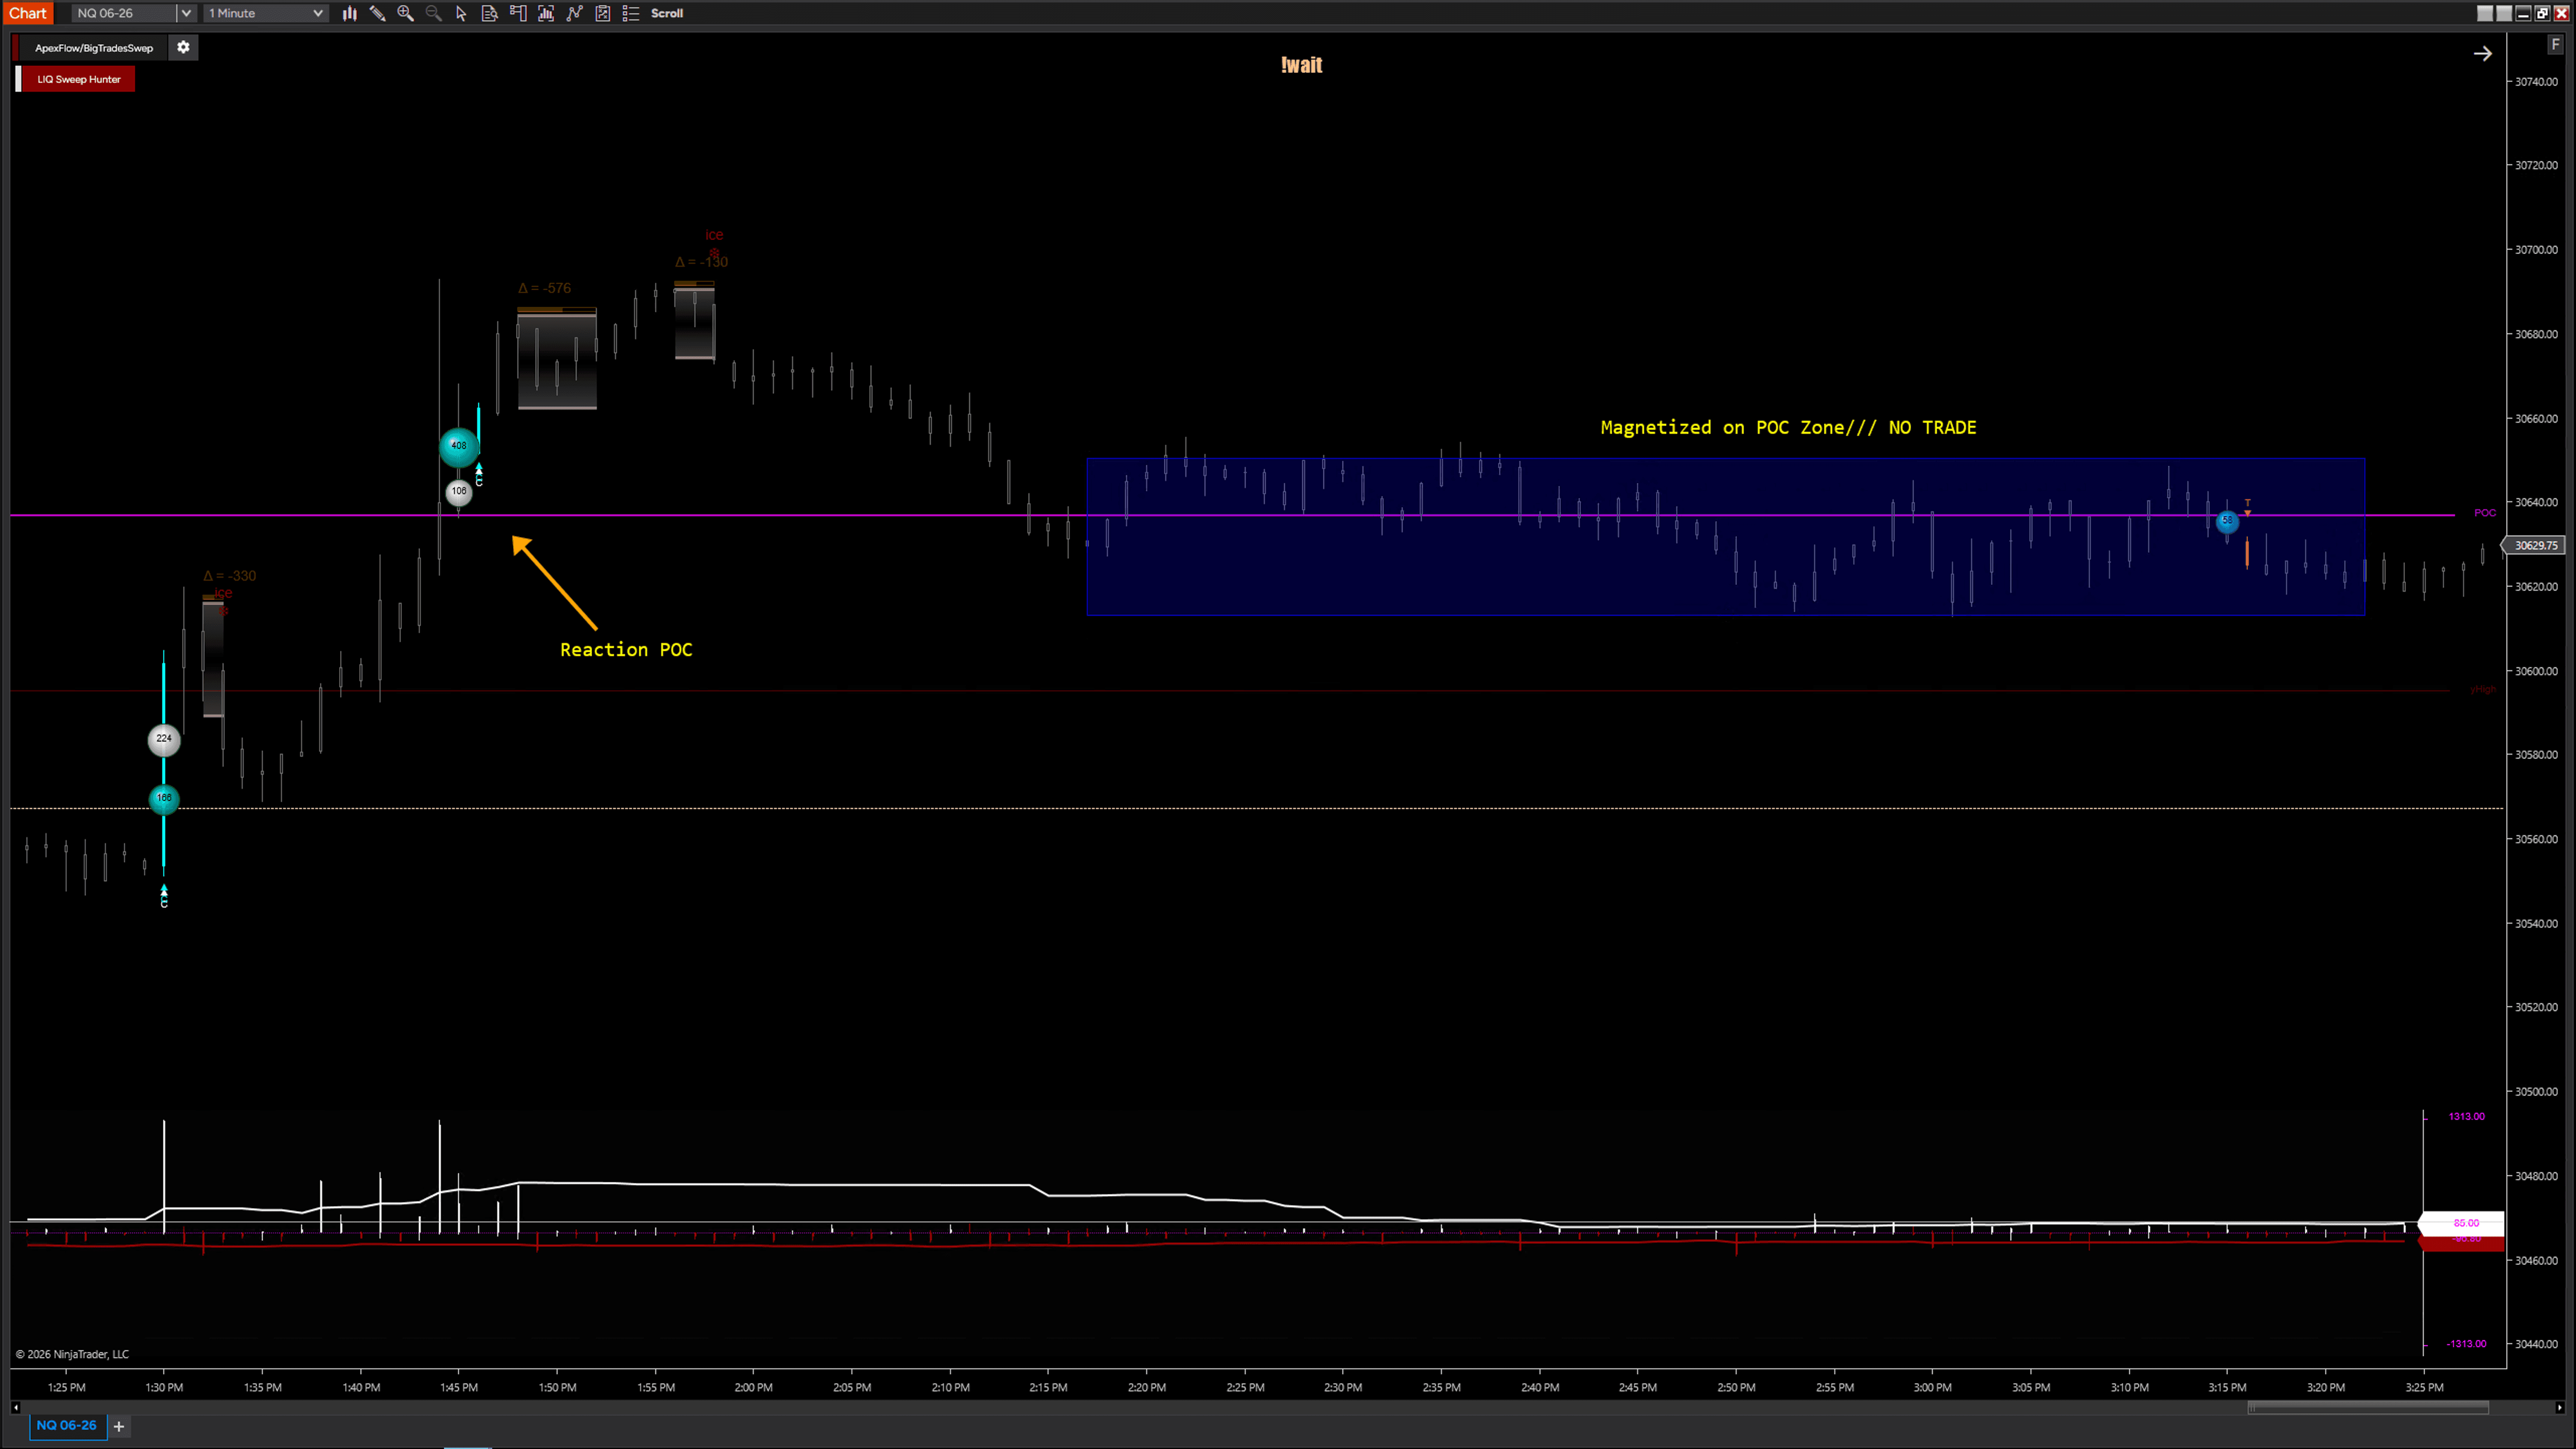
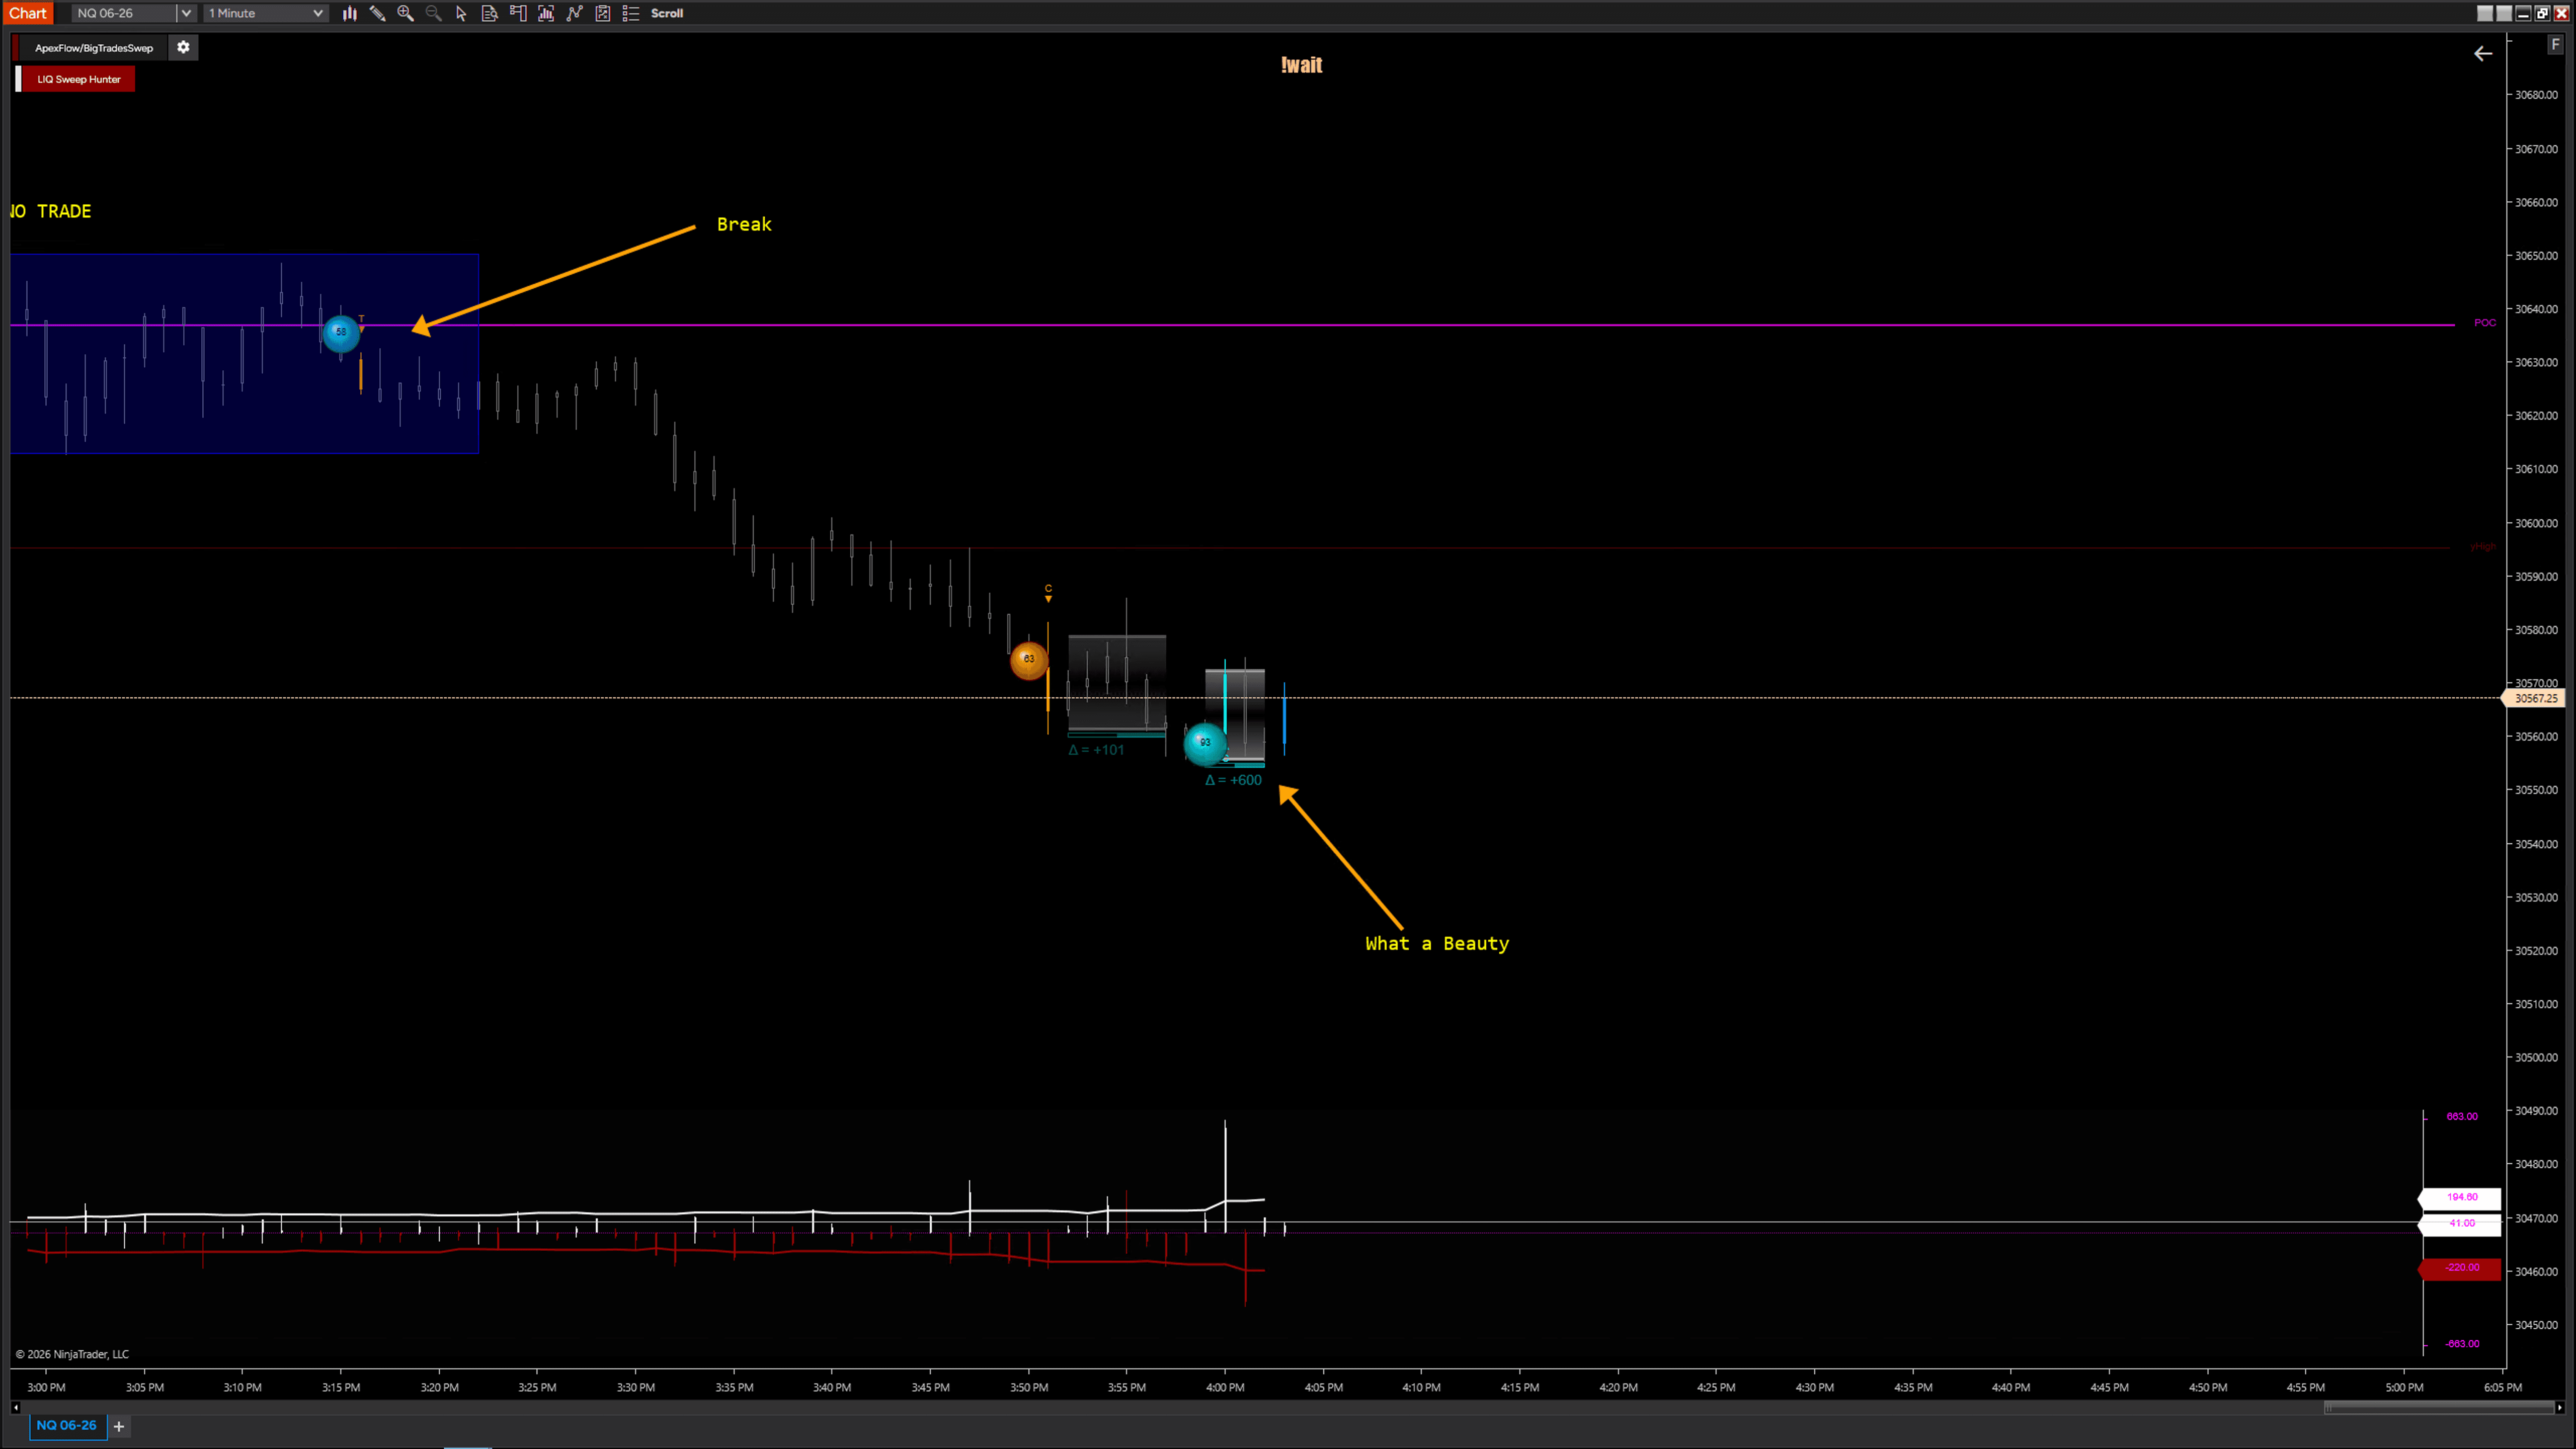
Example 03
Recognizing a no-trade environment
After reacting from the POC, price initially attempted to continue higher.
However, as the session developed, the market became increasingly accepted around the POC area. Price began rotating around value rather than moving directionally away from it.
At that stage, the order flow message changed completely. The focus was no longer on finding entries.
The market had transitioned into a balanced environment where directional conviction was limited and participation became less meaningful.
This is an important part of the framework: Not every signal deserves action.
Sometimes the highest-quality decision is recognizing when the auction is balanced and waiting for clearer intent to emerge.
POC becomes a magnet
Price rotates around value
Directional conviction fades
Stand aside and wait
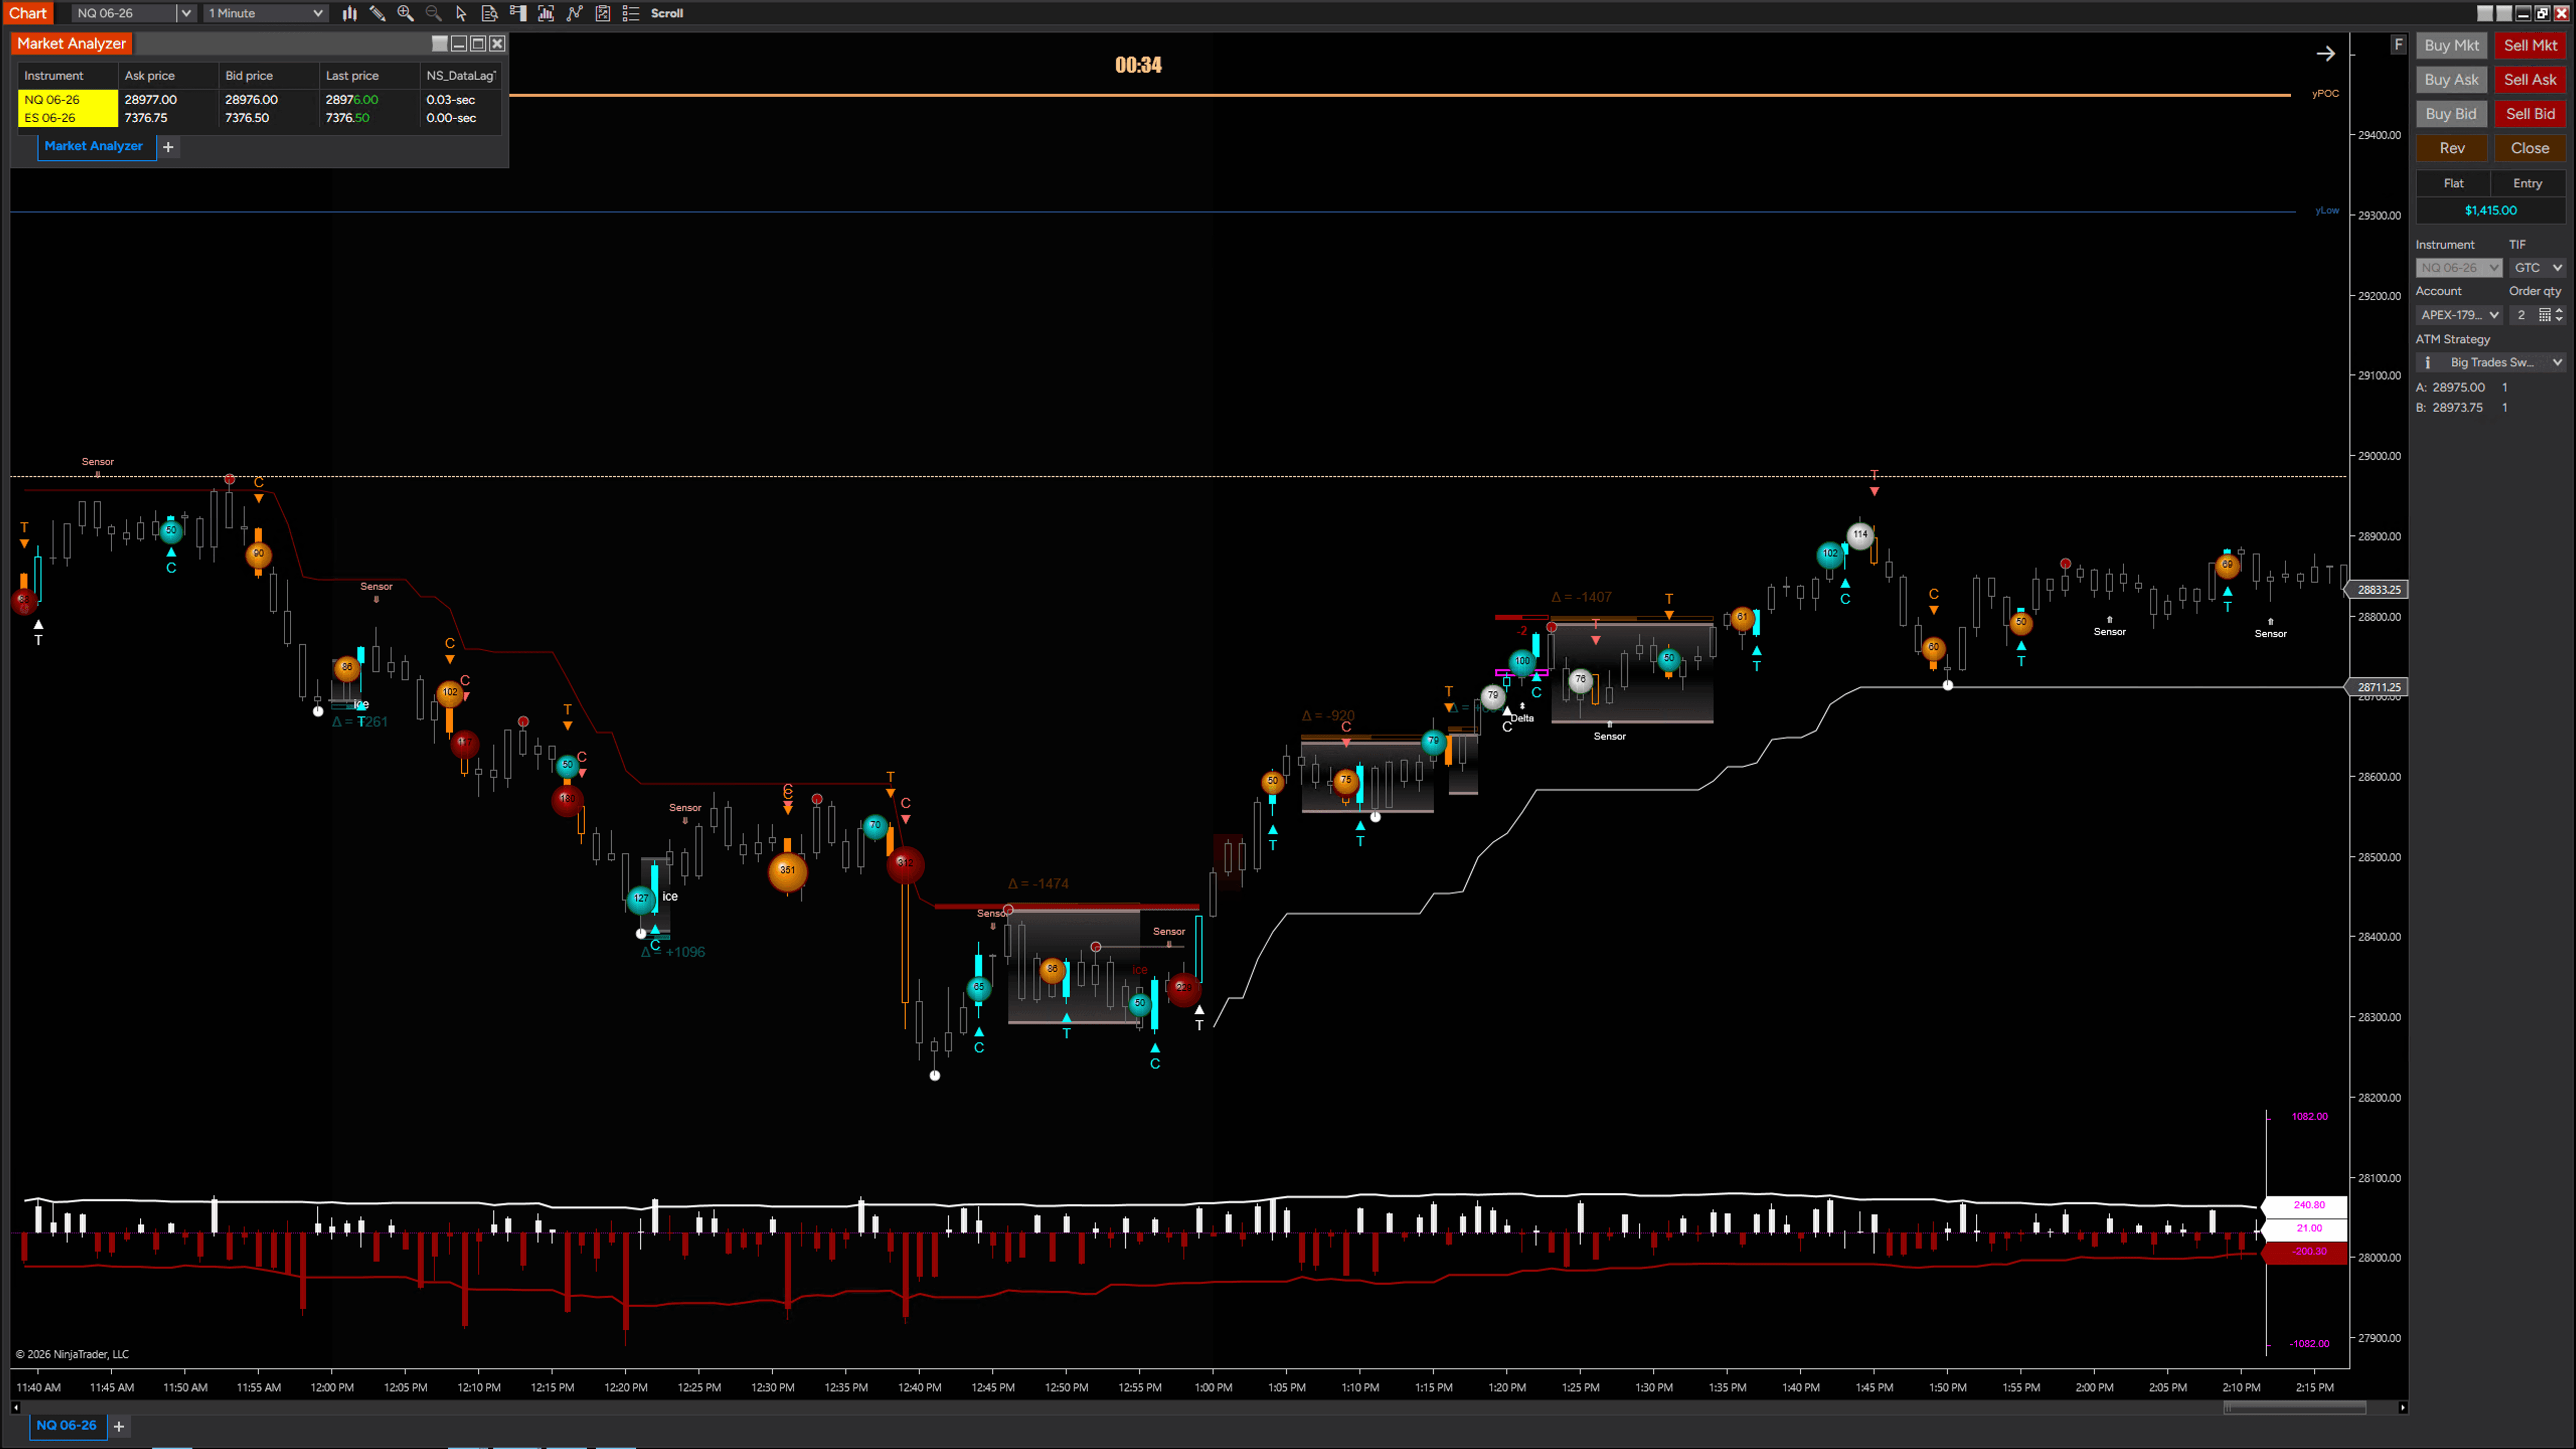
Example 04
Waiting for separation from value
Once price finally moved away from the POC area, the market began displaying clearer directional intent.
The rotational behavior disappeared. Participation became easier to interpret.
As price approached a new area, multiple order flow components started aligning:
Potential absorption
Aggressive participation
Market reaction
Directional follow-through
The objective is not to force trades inside a balanced auction.
The objective is to wait for price to separate from value and allow the market to reveal clearer participation and cleaner intent.
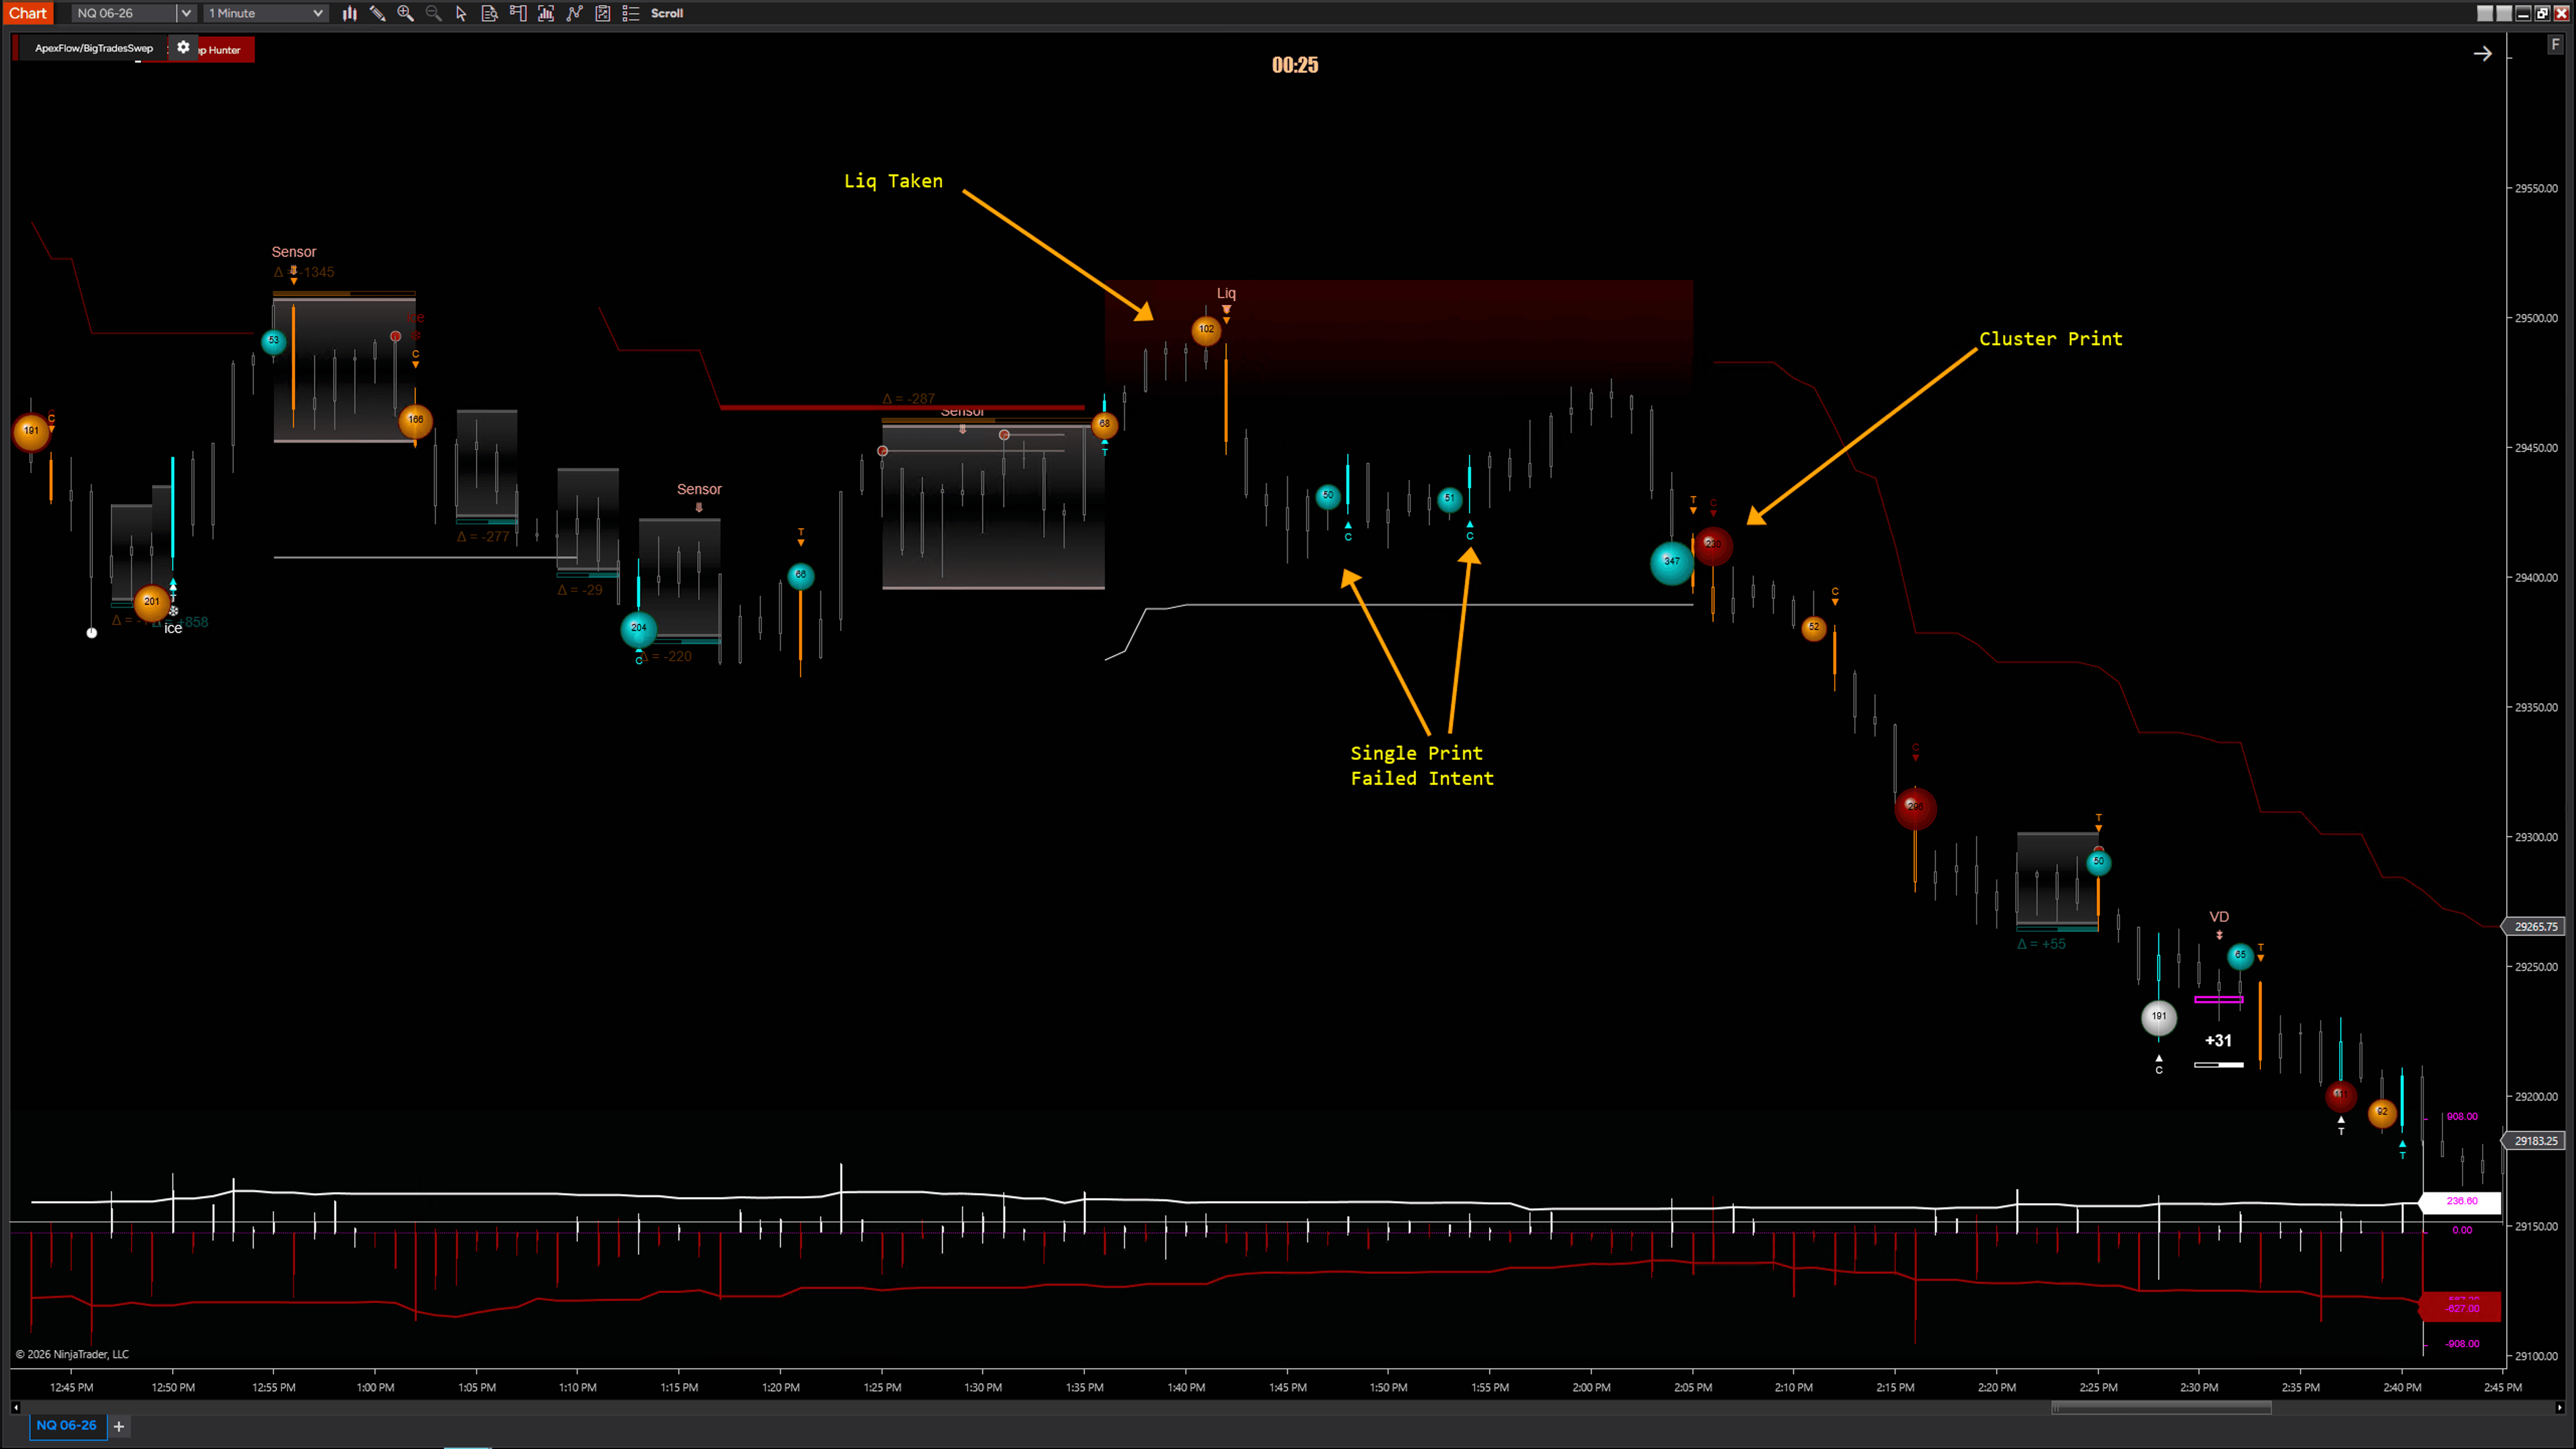
Example 05
Failed buying intent
Price sweeps liquidity above the market, but the move fails to generate meaningful continuation.
Buying attempts remain visible, yet the market begins accepting lower prices instead.
As seller participation increases, the order flow message becomes much clearer.
Liquidity taken
Buying attempts fail
Acceptance lower
Stronger seller participation
Continuation lower
The value comes from observing the sequence rather than focusing on any single signal.
Example 06
Why context matters
During the selloff, aggressive participation appears, but the market continues accepting lower prices.
A small absorption reaction develops, yet it fails to change the broader context.
Later, a stronger absorption area forms alongside a more meaningful Delta response, producing a much stronger reaction.
Aggression appears
Absorption develops
Delta confirms the difference
Market response changes
Not every signal carries the same significance. Context often matters more than the signal itself.
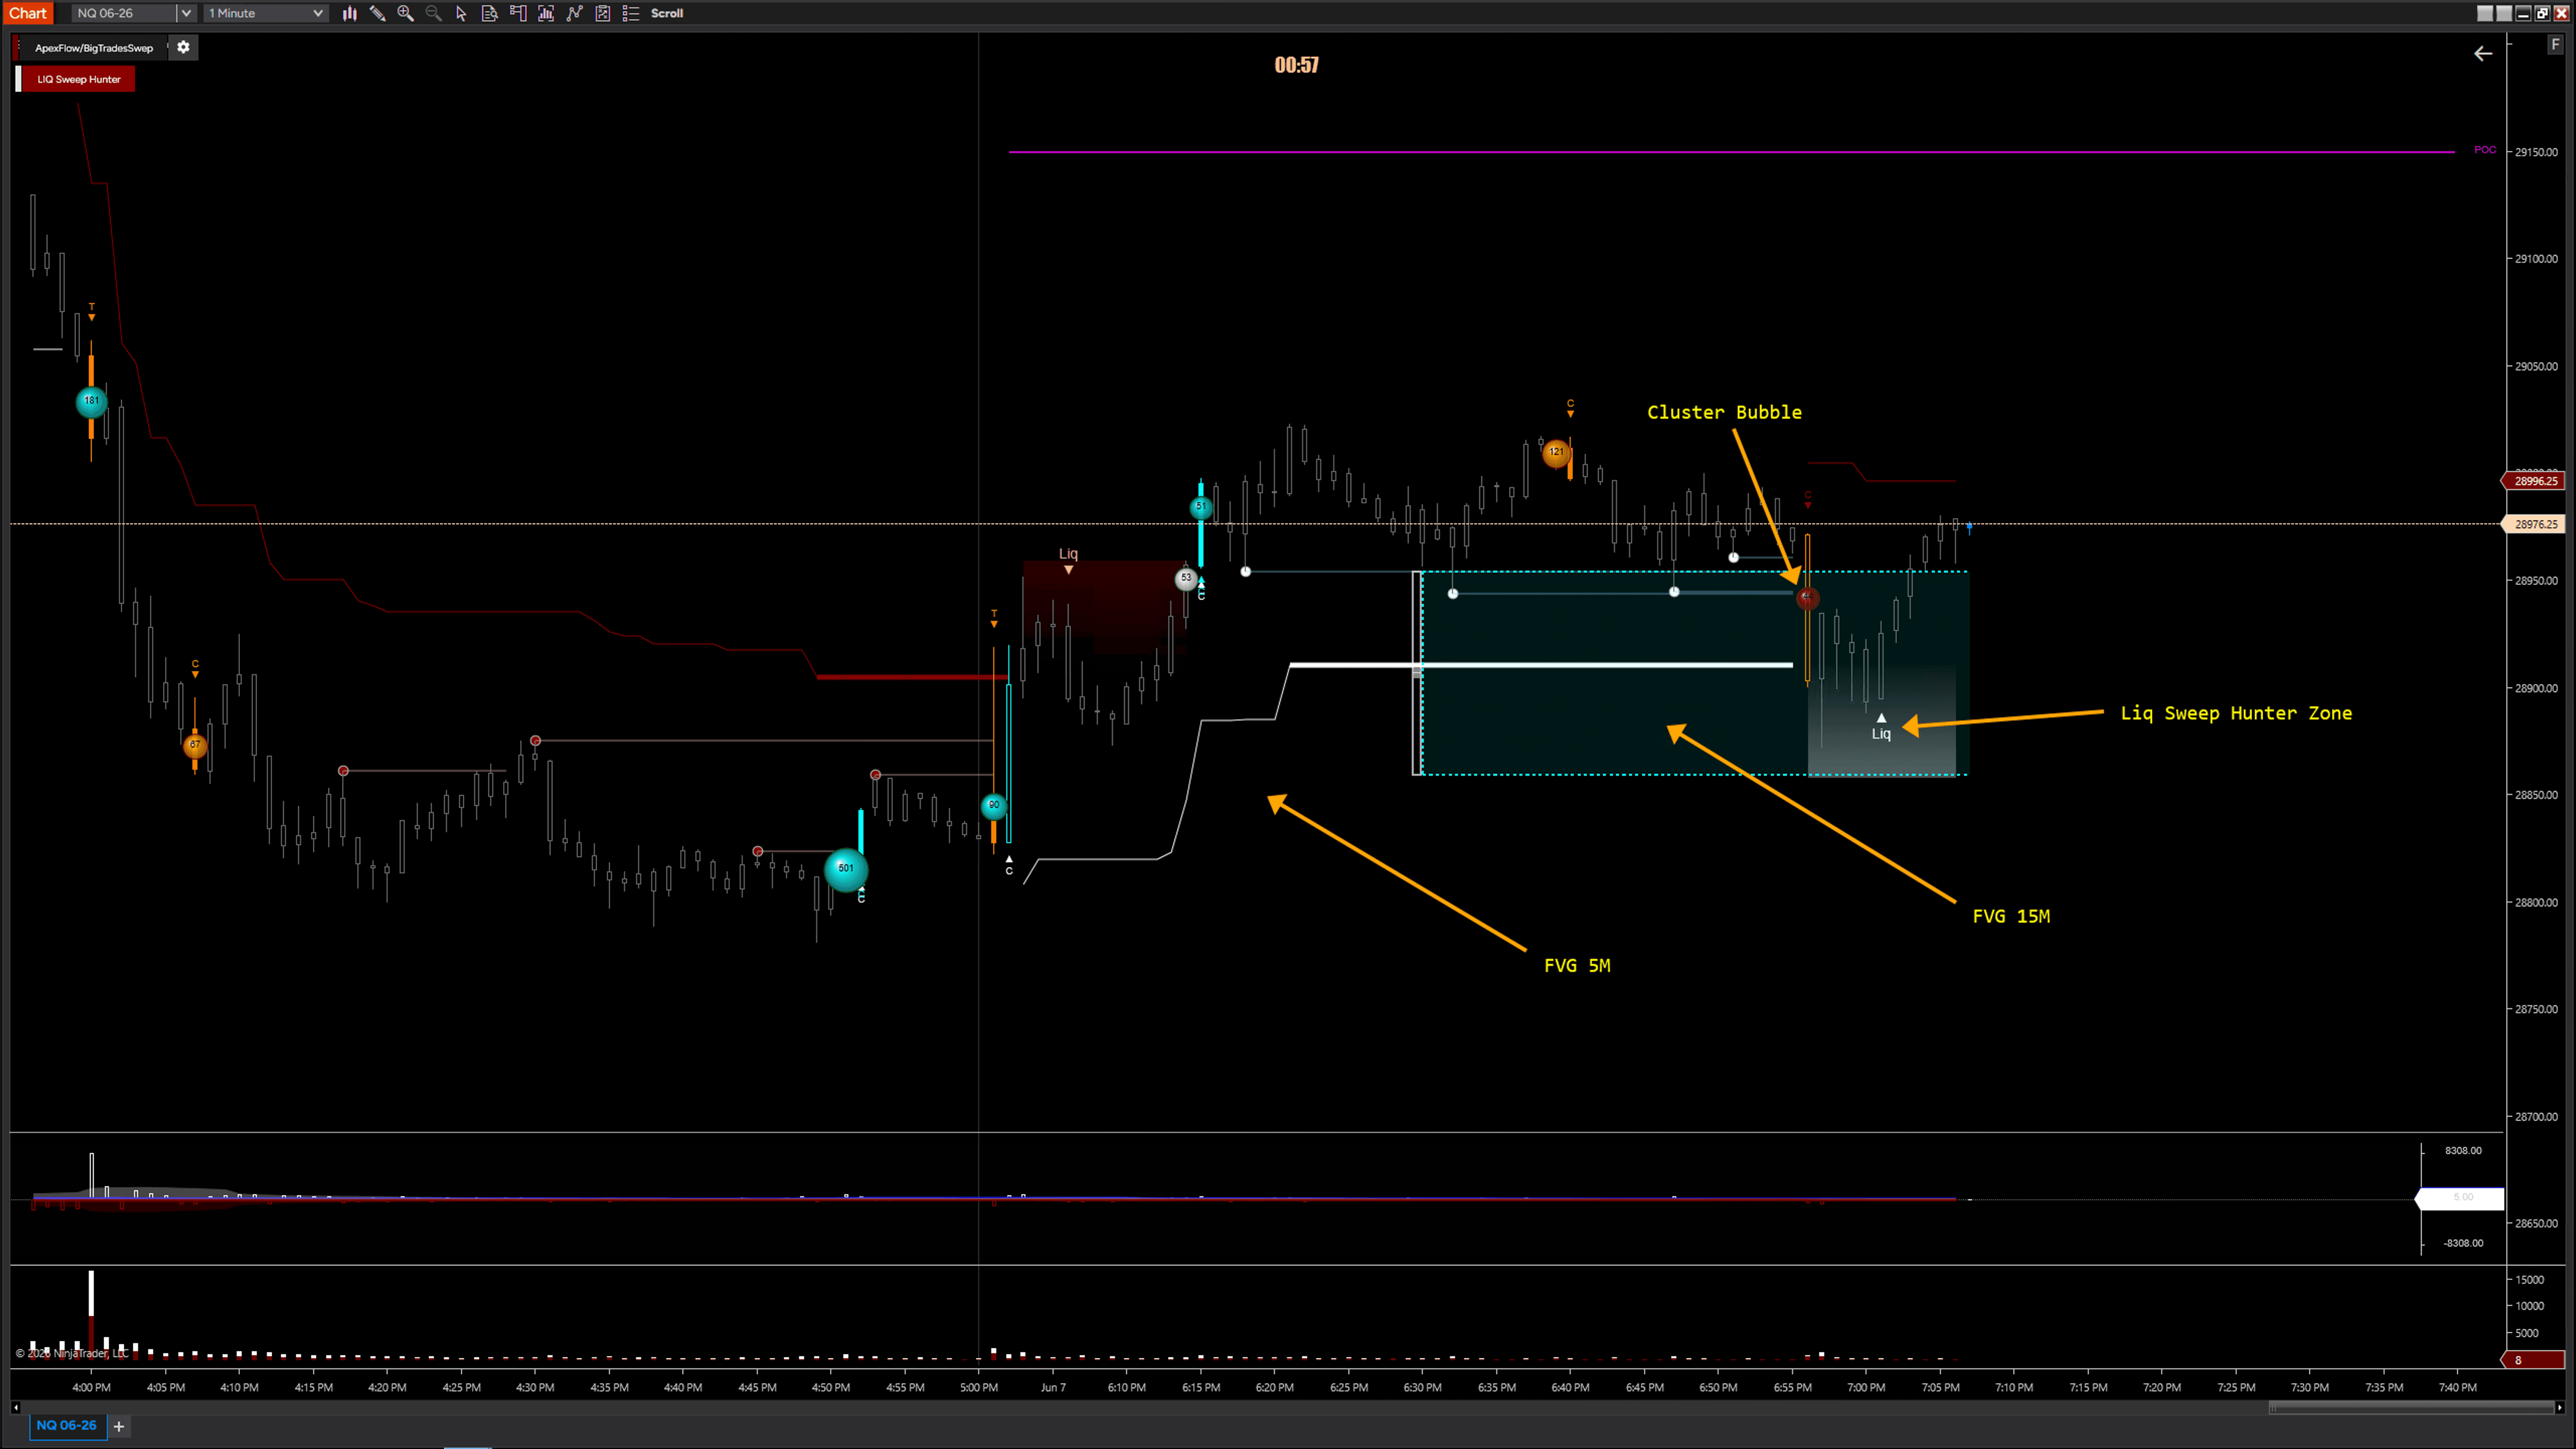
Example 07
Combining ICT structure with Order Flow
A Fair Value Gap identifies the area of interest.
As price interacts with the zone, liquidity sweeps, aggressive participation, and market reaction begin aligning.
The value comes from combining structure with order flow.
Fair Value Gap
Liquidity sweep
Aggressive participation
Market response
The structure identifies where to pay attention. Order flow helps explain what is happening inside the area.
Why this matters
Markets are driven by participation, not indicators
Understanding how these elements interact can help traders build a clearer picture of what is happening beneath the surface. The goal is not to predict every move. The goal is to make better-informed decisions based on the behavior the market is revealing in real time.
Investment
A complete order flow framework
Designed to help traders understand liquidity, participation, absorption,
and market control through a structured visual process.
Access the full framework and the complete workflow used throughout the examples shown on this page.
LIQ Sweep Hunter
BigTrade Sweep
Order Flow Presentation v2
Sonarlike Iceberg Finder
Imbalance Volume Sensor
Personalized support
Templates and settings
The complete framework is designed to work as a connected workflow.
If you already own one or more components, you can purchase the remaining indicators individually and complete the setup over time.
LIQ Sweep Hunter
BigTrade Sweep
Order Flow Presentation v2
Sonarlike Iceberg Finder
Imbalance Volume Sensor
Download ~ 40 FREE indicators & reach more useful resources !!!
ninZa.co Indicators
0 online
![]()
ninZa.co is an official member of NinjaTrader Ecosystem together with 600+ industry-leading professionals that provide traders with quality trading products & services.


even more payment methods
Quick Links
Instructions
Support
Resources & Information
© Copyright 2026 All Rights Reserved

![]()

Because software products may be copied and stored easily, we will NOT issue refunds of any kind. ALL SALES ARE FINAL & NON-REFUNDABLE!
Futures, foreign currency, and options trading contains substantial risk and is not for every investor. An investor could potentially lose all or more than the initial investment. Risk capital is money that can be lost without jeopardizing one's financial security or lifestyle. Only risk capital should be used for trading and only those with sufficient risk capital should consider trading. Past performance is not necessarily indicative of future results.
Hypothetical performance results have many inherent limitations, some of which are described below. No representation is being made that any account will or is likely to achieve profits or losses similar to those shown; in fact, there are frequently sharp differences between hypothetical performance results and the actual results subsequently achieved by any particular trading program. One of the limitations of hypothetical performance results is that they are generally prepared with the benefit of hindsight. In addition, hypothetical trading does not involve financial risk, and no hypothetical trading record can completely account for the impact of financial risk of actual trading. For example, the ability to withstand losses or to adhere to a particular trading program in spite of trading losses are material points which can also adversely affect actual trading results. There are numerous other factors related to the markets in general or to the implementation of any specific trading program which cannot be fully accounted for in the preparation of hypothetical performance results and all which can adversely affect trading results.
NinjaTrader® is a registered trademark of NinjaTrader Group, LLC. No NinjaTrader company has any affiliation with the owner, developer, or provider of the products or services described herein, or any interest, ownership or otherwise, in any such product or service, or endorses, recommends or approves any such product or service.