
_1784772815601.jpg)
“Zaccess” for traders navigating challenging times
Receive up to $500 in purchase assistance toward eligible products.
![[NEW trading strategy] BigTrade Sweep + LIQ Sweep Hunter](https://forestcms.nyc3.digitaloceanspaces.com/media/small_Thumbnail LIQ Sweep Hunter + Big Trade Sweep_1784773279263.jpg)
[NEW trading strategy] BigTrade Sweep + LIQ Sweep Hunter
What causes a Big Reversal? Liquidity isn’t enough
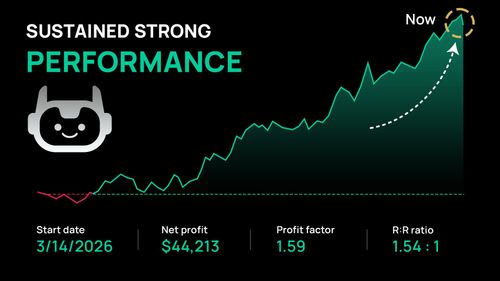
Passed Bulenox with a 3-month backtest
See how this 100% automated trading system performed on both MNQ and NQ.
![[LIVE trading] Reading market balance with Auction ∆xis](https://forestcms.nyc3.digitaloceanspaces.com/media/small_Thumbnail Live trading Auction ∆xis (James)_1784773724325.jpg)
[LIVE trading] Reading market balance with Auction ∆xis
Watch James Buchman use Auction ∆xis to identify key levels, trade live, and project price targets.
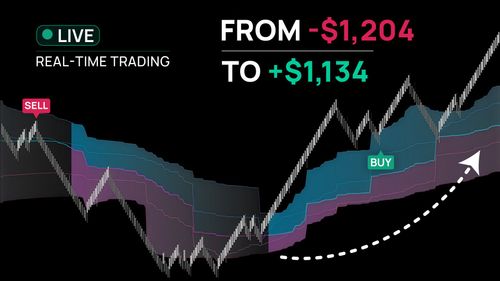
Recovering from a $1,100 drawdown
Watch how 25+ live trades using VWAP helped rebuild the account step by step.
![[July Exclusive] Liberty Edge Bundle](https://forestcms.nyc3.digitaloceanspaces.com/media/small_liberty-edge-bundle-hdhdh_1783139262484.png)
[July Exclusive] Liberty Edge Bundle
From market analysis to trade execution — in one structured workflow.
[AbsP] Auction Δxis
See Big Moves before they unfold
Big moves rarely appear without context. Auction Δxis makes that context visible through Objective Support & Resistance and evolving market value, giving intraday traders a consistent framework for recognizing expansion conditions before price accelerates.
_1783480703980.png)
Where most analysis stops
Most traders read price, but not the Auction behind it
Modern trading tools offer countless ways to analyze the market—moving averages, momentum indicators, Fibonacci levels, and price structure.
Yet several fundamental questions remain:
Why do some breakouts develop into sustained moves while others quickly return to balance?
Why do support and resistance levels seem to change with every timeframe or indicator setting?
Why does a strong trend sometimes reverse even though price still appears bullish?
Many trading tools focus on price movements and interpret the market through different analytical models.
As a result, the same market can produce very different interpretations depending on the tools, settings, and timeframes used to analyze it.
Value-First Framework
Read the market through a Value-First lens
Auction Δxis is built upon a fundamental market principle: Markets are continuous auctions for value.
Price reflects the outcome of that process, while value reveals where the market accept price, concentrates participation, and begin to transition into new opportunities.
This perspective forms the foundation of the Value-First Framework – an approach centered on 3 essential market dynamics:
01
Value acceptance
where the market considers price to be fair.
02
Value concentration
where participation and liquidity begin to accumulate.
03
Value migration
how accepted value shifts over time to establish new trends.

These dynamics are visualized through POC migration, volume distribution, and VWAP-based value zones, helping traders distinguish between balanced markets, emerging expansions, and shifts in underlying market value.
Trading intelligence
4 trading intelligences revealed by Auction Δxis
Auction Δxis is not just a trading system – it is a market framework that helps traders uncover market insights that are not always visible through price action and traditional indicators alone.
Support & Resistance are market properties, not indicator settings
Support and resistance do not originate from moving averages, Fibonacci levels, or other technical indicators. These tools simply interpret the market through different analytical models.
As a result:
Yet the underlying market has not changed. The market still contains the same liquidity, participation, and value distribution.
Support and resistance should therefore be rooted in the market itself, not in the analytical tools used to observe it.
Auction Δxis introduces the concept of Objective Support & Resistance – levels derived from the market's own distribution of volume & value rather than from analytical preferences.
With a consistent market reference, traders spend less time fine-tuning their tools and more time evaluating how the market is responding.


Big moves begin with value concentration
Before expansion occurs, markets often go through a period of value concentration, where 3 important elements begin to converge:
Auction Δxis highlights these moments of Price–VWAP–POC alignment, revealing the conditions that often exist before a Big move unfolds.
The goal is not to predict direction, but to recognize the conditions that typically precede significant expansion.


Trends reflect value migration
Most trend analysis focuses on price structure:
– Higher highs and lower lows, moving average slopes
– EMA crossovers, ADX and price action
Auction Δxis adds another perspective: Is market value moving higher or lower?
As value migrates upward, the market establishes an uptrend. As value migrates lower, the underlying trend begins to change.
Auction Δxis visualizes this process through evolving VWAP and POC-based value zones, providing another dimension for understanding market direction.


Price is always relative to value
Most traders ask where price is going.
Few ask: is price currently trading at a premium, a discount, or near fair value?
Markets continuously establish value through participation and acceptance. Price moves around that value, while value defines what the market considers fair.
Auction Δxis reveals this evolving value through VWAP & POC-based value zones, making market valuation visible throughout the session.


On the chart
How Auction Δxis makes those insights observable
Track POC migration, not static levels
Track the movement of POC as it develops, making changes in market participation and value acceptance immediately visible.
Automatically plot volume profiles
Automatically create and update volume profiles as POC begins to flatten, eliminating the need to manually choose where to draw them.
Display daily volume distribution
Display a daily volume profile that reveals trading activity across different price levels throughout the session.


What changes
What changes when you read value first
Remove the guesswork from support and resistance
- Identify objective support and resistance levels rooted in market participation.
- Reduce dependence on timeframe, period, and indicator configurations.
- Automatically identify key market zones and important areas of supply and demand.
Avoid chasing price
Evaluate whether price is trading at a premium, a discount, or near fair value in real time.
Position for potential big moves
Recognize value concentration conditions that often precede significant market moves.
Track trends through value migration
Interpret trends through value migration rather than short-term price fluctuations.
Ideal combo 1
Read value first. Use order-flow signals second.
Auction Δxis + ApexFlow Zignal gives traders a cleaner way to move from market context to signal confirmation.
Auction Δxis helps identify where value is forming, where liquidity is concentrating, and when market conditions may be shifting. ApexFlow Zignal then adds an order-flow signal layer, helping traders observe absorption, exhaustion, and push behavior inside that value context.
01
Start with value context
Auction Δxis helps traders understand the auction structure behind price through POC migration, volume distribution, and VWAP-based value zones.
02
Confirm with order-flow behavior
ApexFlow Zignal translates buy/sell pressure, volume behavior, absorption, exhaustion, and push activity into clear chart-based signals.
03
Build a context-to-signal workflow
Instead of reacting to isolated signals, traders can first read where value is developing, then evaluate whether order-flow behavior supports the next trade opportunity.


Important note
Traders who purchase the Auction Δxis + ApexFlow Zignal combo, or already own both systems, will receive access to ApexFlow Δxis — a private Discord room dedicated to this combined workflow.
It is designed to support traders in reading value first, then using order-flow signals for confirmation — with focused guidance on using both systems together.
Ideal combo 2
Read value first. Confirm momentum second.
Auction Δxis + MagnetOsc Turbo helps traders combine market value with multi-timeframe momentum to evaluate potential reversals with more context.
Auction Δxis reveals where value is forming, concentrating, and migrating. MagnetOsc Turbo then compares momentum across 2 timeframes, helping traders determine whether an overbought or oversold condition signals a possible turning point or continued pressure.

01
Start with value context
Auction Δxis shows where price is trading relative to fair value through POC migration, volume distribution, and VWAP-based value zones.
02
Confirm momentum across 2 timeframes
MagnetOsc Turbo compares momentum on the current and higher timeframes, helping traders avoid reacting to isolated overbought or oversold readings. Its Push and Pull signals highlight momentum alignment, short-term reversals, and potential turning conditions.
03
Build a value-to-momentum workflow
Instead of treating every oscillator signal equally, traders can first identify where the opportunity is forming within market value, then evaluate whether multi-timeframe momentum supports the setup.
Together, the combo helps traders approach reversals with clearer context, better timing, and less guesswork.


Webinar replay
🎬 Webinar replay: The missing reference behind price action
In this video, James Buchman explains how he builds a directional bias for the session before looking for entries.
He uses value areas, POC, VWAP, and volume distribution to identify key levels, evaluate Long and Short scenarios, execute live trades, and project potential price targets.
Auction Δxis Explained
A comprehensive overview of Auction Δxis
In this video, we explore how traders can assess price relative to market value, identify areas of concentrated liquidity, and determine whether the market is accepting a new value area or making only a temporary move.
You will also learn how premium, fair value, discount, and value shifts can provide clearer context before considering an entry.
In this video, we break down how major market moves develop before the explosive candle appears.
You’ll learn how to recognize the preparation phase, read shifts in market value, and identify a structured entry area instead of chasing price after the move begins.
Live Trading
See Auction Δxis in live markets
In this video, James Buchman explains how to read value areas, POC, VWAP, and volume distribution to identify market balance, shifting value, support and resistance, and potential price targets.
He then applies these concepts in several live trades, including shorts from VWAP resistance and a long from POC support, with price ultimately reaching the projected target areas.
In this video, we break down a live session traded entirely through manual market analysis, explaining how market context guided each decision.
The session finished with 15 trades, just 3 losses, and more than $6,000 in profit.
Watch Auction Δxis signals unfold in real market conditions
See how Auction Δxis reveals value concentration, migration, and key market zones as the session unfolds.
 2026_07_08 (5_09_00 AM)_1783598267246.png)
 2026_07_05 (5_10_10 AM)_1783598267247.png)
 2026_07_07 (5_09_47 AM)_1783598265879.png)
 2026_07_06 (5_10_01 AM)_1783598265720.png)
 2026_07_03 (5_10_21 AM)_1783598265610.png)
 2026_07_08 (5_10_54 AM)_1783598265141.png)
 2026_07_02 (5_11_37 AM)_1783598262028.png)
 2026_06_30 (5_11_55 AM)_1783598262018.png)
 2026_06_25 (5_12_25 AM)_1783598261653.png)
 2026_07_07 (5_11_04 AM)_1783598261436.png)
 2026_07_07 (5_12_56 AM)_1783598260514.png)
 2026_07_02 (5_13_13 AM)_1783598260213.png)
Before you decide
Common questions. Clear answers.
1. Isn't this just Volume Profile + VWAP + POC?
It's a fair question. Auction Δxis is built on the same market data, so it's natural to make that comparison.
Volume Profile, VWAP, and POC are the inputst. Auction Δxis connects them into a single framework for understanding how market value is established, concentrated, and migrated throughout the trading session.
A trader can see where the POC is without understanding how value is migrating.
A trader can plot VWAP without knowing whether price is trading at a premium, a discount, or near fair value.
A Volume Profile can show where volume accumulated, but not necessarily when value is concentrating ahead of potential expansion.
That's why Auction Δxis doesn't simply display market data. It continuously reveals how value evolves, providing a consistent market reference for interpreting market behavior rather than isolated indicators.
2. Does Price–VWAP–POC alignment always lead to a Big Move?
Not necessarily. No market condition can guarantee that a significant move will follow.
Price–VWAP–POC alignment is not a prediction. It identifies value concentration – a condition where price, fair value, and high-liquidity areas begin to converge.
These conditions often appear before periods of market expansion, but they do not determine the direction, timing, or quality of the move.
Like any professional trading framework, Auction Δxis is designed to provide context, not certainty. Market conditions should always be evaluated alongside your trading plan, execution criteria, and risk management.
If Auction Δxis doesn't fit the way you analyze the market, you're protected by our 30-day exchange policy, giving you the flexibility to choose another indicator that better matches your trading approach.
3. I just want buy/sell signals.
That's completely reasonable. Simple signals are easy to follow and work well for many trading styles.
Auction Δxis is designed with a different goal. Rather than generating buy or sell signals, it helps you understand the market context before making a decision – whether to buy, sell, wait, or stay out of the market.
Instead of asking only "Should I buy or sell?", Auction Δxis helps answer questions that often matter first:
- – Is price trading at a premium, a discount, or near fair value?
- – Is the market balanced or expanding?
- – Is value migrating higher or lower?
- – Where does this trade sit relative to objective support and resistance?
4. Does this make traditional Support & Resistance indicators useless?
Not at all. Traditional Support & Resistance tools remain useful for identifying important price levels based on technical analysis, such as market structure, swing points, Fibonacci levels, or moving averages.
Auction Δxis doesn't replace them – it adds another perspective.
Instead of deriving levels from analytical models, it reveals where the market is accepting value, concentrating liquidity, and establishing Objective Support & Resistance.
Simply put, traditional Support & Resistance shows where price may react. Auction Δxis helps explain why those areas matter.
If you'd like to explore this different approach, Auction Δxis includes detailed documentation, and our customer support team is always available to answer questions and help you apply the framework with confidence.
5. Do I need to understand Auction Market Theory?
Not necessarily. Auction Δxis turns key Auction Market Theory concepts into clear visual references, making them easier to understand and apply in everyday trading.
Instead of learning the theory from scratch, you can focus on reading market value through POC migration, Objective Support & Resistance, and evolving value zones.
If you ever need help, our support team is just a message away. We're always happy to answer questions and, when needed, provide a remote support session to help you get the most from Auction Δxis.
Investment
Choose the Auction Δxis setup that fits your trading workflow
Start with Auction Δxis as a value-first market framework, or combine it with additional workflow flexibility and order-flow signal confirmation.
Each option includes the license, personalized support, and trader resources to help you apply the framework with more clarity.
- Auction Δxis license: $900 value
- Personalized support: $100 value
- Trader's manual & templates: $100 value
- Auction Δxis license: $900 value
- MagnetOsc Turbo: $500 value
- Personalized support: $200 value
- Trader's manual & templates: $200 value
- Auction Δxis license: $900 value
- ApexFlow Zignal license: $1,400 value
- Personalized support: $100 value
- Trader's manual & templates: $100 value
Choose the Auction Δxis setup that fits your trading workflow
Read value first. Use order-flow signals second.
Download ~ 40 FREE indicators & reach more useful resources !!!
Why we are rebuilding NINZA
The most important long-term decision we have made in years →

ninZa.co Indicators
0 online

ninZa.co is an official member of NinjaTrader Ecosystem together with 600+ industry-leading professionals that provide traders with quality trading products & services.




even more payment methods
Quick Links
Instructions
Support
Resources & Information
© Copyright 2026 All Rights Reserved



Because software products may be copied and stored easily, we will NOT issue refunds of any kind. ALL SALES ARE FINAL & NON-REFUNDABLE!
Futures, foreign currency, and options trading contains substantial risk and is not for every investor. An investor could potentially lose all or more than the initial investment. Risk capital is money that can be lost without jeopardizing one's financial security or lifestyle. Only risk capital should be used for trading and only those with sufficient risk capital should consider trading. Past performance is not necessarily indicative of future results.
Hypothetical performance results have many inherent limitations, some of which are described below. No representation is being made that any account will or is likely to achieve profits or losses similar to those shown; in fact, there are frequently sharp differences between hypothetical performance results and the actual results subsequently achieved by any particular trading program. One of the limitations of hypothetical performance results is that they are generally prepared with the benefit of hindsight. In addition, hypothetical trading does not involve financial risk, and no hypothetical trading record can completely account for the impact of financial risk of actual trading. For example, the ability to withstand losses or to adhere to a particular trading program in spite of trading losses are material points which can also adversely affect actual trading results. There are numerous other factors related to the markets in general or to the implementation of any specific trading program which cannot be fully accounted for in the preparation of hypothetical performance results and all which can adversely affect trading results.
NinjaTrader® is a registered trademark of NinjaTrader Group, LLC. No NinjaTrader company has any affiliation with the owner, developer, or provider of the products or services described herein, or any interest, ownership or otherwise, in any such product or service, or endorses, recommends or approves any such product or service.