
Adapting Greenz to today's reality
A long-term commitment for Captain Optimus Strong v2 owners
_1785574665845.png)
Zaccess extended through August
Receive up to $1,000 in purchase assistance
![[NEW execution tool] RapidShape Ordering](https://forestcms.nyc3.digitaloceanspaces.com/media/small_RapidShape Ordering banner (1280x720)_1785138140452.jpg)
[NEW execution tool] RapidShape Ordering
Place pending orders with a single drawing
![[Webinar replay] Auction Axis](https://forestcms.nyc3.digitaloceanspaces.com/media/small_webinar-repay-auction-axisihdhđ_1785126444244.png)
[Webinar replay] Auction Axis
James Buchman explains how he sets his bias before entering trades.
![[NEW trading strategy] BigTrade Sweep + LIQ Sweep Hunter](https://forestcms.nyc3.digitaloceanspaces.com/media/small_Thumbnail LIQ Sweep Hunter + Big Trade Sweep_1784773279263.jpg)
[NEW trading strategy] BigTrade Sweep + LIQ Sweep Hunter
What causes a Big Reversal? Liquidity isn’t enough
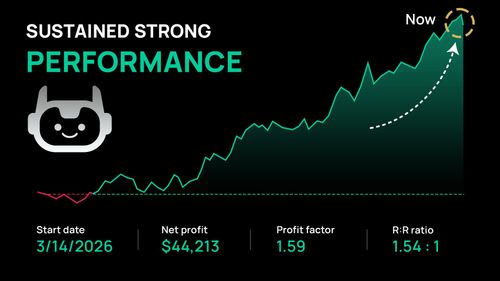
Passed Bulenox with a 3-month backtest
See how this 100% automated trading system performed on both MNQ and NQ.
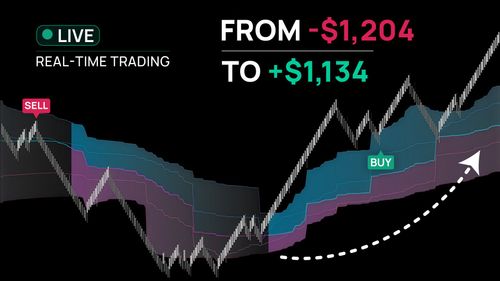
Recovering from a $1,100 drawdown
Watch how 25+ live trades using VWAP helped rebuild the account step by step.
Quantum Vol-Delta
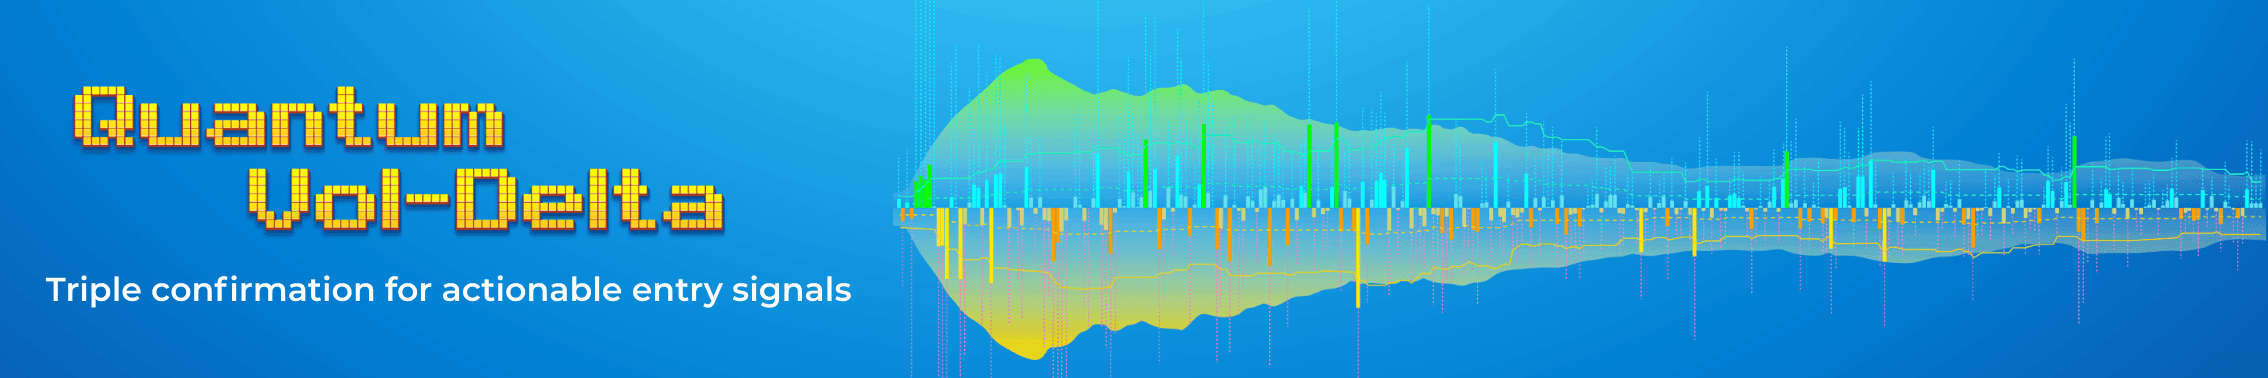
Turn raw delta into clear entry signals – instantly
Identify real buying and selling pressure in seconds using an adaptive engine that compares Delta, Volume, and Candle Structure together.
Quantum Vol-Delta transforms traditional Delta analysis into actionable trading signals, automatically highlighting candles where real market pressure appears – without manual threshold guessing.
Real problems traders face without Quantum Vol-Delta
Delta shows pressure – but not its significance
A Delta value may look strong, yet still be insignificant relative to total volume.
Example:
A +200 Delta may appear powerful at 400 volume, but far less meaningful at 1,000.
Without volume context, traders constantly ask:
- Is this real buying pressure?
- Or just normal market noise?
Delta shows imbalance – but not whether that imbalance actually matters.
This uncertainty often leads to hesitation and missed trades.
Too many indicators just to confirm one trade
Many traders stack multiple indicators on their charts:
- Volume indicators
- Delta indicators
- Momentum indicators
- Price action confirmation
- Support / resistance indicators
All just to answer one question:
“Is this a good entry?”
Charts become cluttered, signals conflict, and decision-making slows down.
Fixed thresholds stop working when market conditions change
Most Delta indicators rely on static thresholds.
Example:
Delta > 100 = strong buying
But market activity changes across sessions.
During the Asia session, where liquidity is lower, a +100 Delta may indicate strong buying pressure.
During the US session, where volume is much higher, the same +100 Delta may simply reflect normal trading activity.
As a result, a threshold that works in one session may become meaningless in another.
Traders miss the candles that actually move the market
Most charts contain hundreds of candles, but only a few contain:
- real participation
- aggressive buying or selling
- momentum capable of moving price
Without a clear filter, traders often focus on too many irrelevant candles.
Weak signals look identical to strong signals
Market pressure exists in different strengths.
Some candles show moderate participation.
Others show aggressive momentum.
When signals look identical on a chart, traders struggle to quickly decide which ones actually matter.
Reading order flow becomes mentally exhausting
To interpret Delta properly, traders often have to combine multiple elements:
- Delta value
- total volume
- buy vs sell volume
- candle direction
- session context
This constant mental calculation slows decision-making and increases fatigue during active trading.
Traders don’t need more data.
They need a faster way to see where real buying and selling pressure actually appears.
How Quantum Vol-Delta detects real market pressure
Triple Pressure Confirmation Engine
Quantum Vol-Delta introduces the Triple Pressure Confirmation Engine.
Instead of analyzing Delta alone, the indicator evaluates 3 elements simultaneously:
- Delta strength relative to its adaptive average
- Buy / Sell volume compared to normal activity
- Candle direction confirming the pressure
Signals appear only when all 3 conditions align.
This filters out noise and highlights candles where real market pressure exists.
Adaptive Threshold System
Traditional indicators use fixed thresholds.
Quantum Vol-Delta automatically recalculates average thresholds for Delta and Volume with every new bar.
- When market activity increases → thresholds rise
- When activity decreases → thresholds adjust lower
Signals stay aligned with real market conditions across all sessions.
What Quantum Vol-Delta shows on your chart
Below are examples of how Quantum Vol-Delta highlights pressure signals directly on the chart.
Delta wicks reveal sudden pressure spikes
Quantum Vol-Delta displays Delta wicks to highlight sudden bursts of buying or selling pressure inside a candle.
These spikes help you quickly spot moments where aggressive participation enters the market.
Average buy/sell volume tracking
The indicator tracks average buy and sell volume across recent candles.
This helps you compare current participation with normal market activity and quickly see when pressure begins to build.
Abnormal volume detection
Quantum Vol-Delta highlights candles with unusually large participation relative to recent activity.
These candles often signal moments where meaningful market moves begin to develop.
Clean and intuitive chart signals
Instead of adding extra panels or complex numbers, Quantum Vol-Delta displays simple visual signals directly on the chart.
You can quickly identify important candles without cluttering your charts.
What traders can do with Quantum Vol-Delta signals
Turn market pressure into entry signals
Quantum Vol-Delta converts raw Delta data into clear entry signals.
Signals appear when the following conditions align:
- Delta exceeds its adaptive threshold
- Buy/Sell volume is above average
- Candle closes in the same direction
You can use these signals as:
- Direct entry opportunities
- Confirmation for existing setups
Instead of combining multiple indicators, you can identify high-participation candles faster.
See when a trend is strengthening or weakening
Quantum Vol-Delta also reveals momentum strength.
Example:
Multiple green pressure signals during an uptrend indicate strong buyer participation.
Repeated sell-pressure signals may indicate weakening momentum.
This helps you recognize:
- When trends strengthen
- When momentum fades
- When it may be better to wait
Where traders use Quantum Vol-Delta
Breakout confirmation
When price breaks a level and buy-pressure signals appear, buyers are actively supporting the move.
Trend continuation
Multiple buy-pressure signals during an uptrend often indicate continued buyer participation.
Momentum exhaustion
Sell-pressure signals appearing during an uptrend may indicate weakening momentum.
Support & resistance reactions
Pressure signals reveal who is stepping in at key levels.
- Buy pressure near support
- Sell pressure near resistance
Before vs after using Quantum Vol-Delta
Before
Traders must manually interpret:
- Delta strength
- Volume confirmation
- Candle structure
Signals remain unclear.
After
Quantum Vol-Delta highlights:
- Real buying pressure
- Real selling pressure
- Meaningful candles
- Strengthening or weakening momentum
Delta becomes a decision-support tool.
The 10-second chart test
Look at the 2 charts below.
Ask yourself: Which chart is easier to read?
Chart A – Traditional chart
Traders must manually interpret:
- Delta
- Volume
- Momentum
Chart B – Quantum Vol-Delta
Pressure signals instantly reveal:
- strong buying pressure
- Aggressive selling
- Meaningful participation
Instead of analyzing every candle, traders focus on the candles that matter.
Still not sure if Quantum Vol-Delta is right for you?
▶ “I already use a Delta indicator. Do I really need another one?”
That’s a fair question.
Most Delta indicators show raw imbalance numbers.
They tell you whether buying or selling pressure exists.
But they don’t help you determine whether that pressure is actually meaningful relative to volume.
Quantum Vol-Delta solves that exact problem.
Instead of showing Delta alone, the indicator compares Delta, volume participation, and candle direction simultaneously, then highlights the candles where these elements align.
In other words, it doesn’t replace Delta – it makes Delta easier to interpret and more actionable.
Many traders keep their existing indicators, but use Quantum Vol-Delta to quickly identify the candles where real pressure is confirmed.
▶ “Can I combine it with other indicators?”
Absolutely. Quantum Vol-Delta works well alongside indicators that focus on trend, breakouts, reversals, or key support and resistance levels.
Many traders use it as a confirmation layer. When another setup appears, Quantum Vol-Delta helps verify whether real buying or selling pressure is actually present before entering a trade.
This makes it easier to filter weaker setups and focus only on opportunities backed by real market participation.
▶ “What if market conditions change?”
This is exactly why Quantum Vol-Delta uses adaptive thresholds.
Most Delta indicators rely on fixed levels defined by the user.
But trading volume changes constantly – between sessions, volatility shifts, and market phases.
Quantum Vol-Delta automatically recalculates the average thresholds for both Volume and Delta as new candles form.
This allows the indicator to stay aligned with current market conditions without constant manual adjustments.
▶ “Will it clutter my chart?”
No. Quantum Vol-Delta was designed to simplify chart reading, not complicate it.
Instead of adding more panels or numbers to interpret, the indicator displays clean visual signals directly on the chart.
Signals appear only when meaningful pressure conditions are met, keeping your chart focused on the candles that actually matter.
▶ “Can this actually help with entries, or is it just another analysis indicator?”
A lot of indicators provide information, but still leave traders asking:
“So… where exactly should I enter?”
Quantum Vol-Delta is designed differently.
Signals appear only when three pressure conditions align, meaning the indicator highlights candles where real participation and directional pressure are already present.
Because of this structure, traders often use these signals as:
- Direct entry signals
- Confirmation for an existing setup
Instead of stacking multiple indicators to confirm one trade idea, Quantum Vol-Delta helps you identify high-participation candles much faster.
See real market pressure directly on your chart
Stop guessing which candles actually matter.
Start using Quantum Vol-Delta today.
Frequently asked questions
Does this work on TradingView?
Yes. The Quantum Vol-Delta license currently offered is designed for TradingView charts. (We also provide a Quantum Vol-Delta version for traders using NinjaTrader.)
Does the indicator repaint?
No. Signals are generated only after a candle closes, so they do not repaint.
Is this suitable for beginners?
Yes. The visual signals make it much easier to read buying and selling pressure without needing to interpret raw Delta numbers.
What if this indicator doesn’t fit my trading style?
Because indicators are digital products that can be easily copied, we’re unable to offer refunds.
However, we provide 2 flexible programs – ninZaExchange and ninZaBuyback – which allow you to switch to another indicator with little to no fee. This ensures you always end up with an indicator that truly matches your trading needs.
Do you offer one-on-one support?
Absolutely. If you ever need personal assistance or run into any issues, simply contact us here:
https://zillatrader.com/contact-us
Our team will be happy to help you directly.
What payment methods do you accept?
We accept various payment methods including credit/debit cards, PayPal, and bank transfers.
Download ~ 40 FREE indicators & reach more useful resources !!!
Your feedback will help us shape a better upgrade policy for today’s reality.
Help us improve ↓
ninZa.co Indicators
0 online
![]()
ninZa.co is an official member of NinjaTrader Ecosystem together with 600+ industry-leading professionals that provide traders with quality trading products & services.


even more payment methods
Quick Links
Instructions
Support
Resources & Information
© Copyright 2026 All Rights Reserved

![]()

Because software products may be copied and stored easily, we will NOT issue refunds of any kind. ALL SALES ARE FINAL & NON-REFUNDABLE!
Futures, foreign currency, and options trading contains substantial risk and is not for every investor. An investor could potentially lose all or more than the initial investment. Risk capital is money that can be lost without jeopardizing one's financial security or lifestyle. Only risk capital should be used for trading and only those with sufficient risk capital should consider trading. Past performance is not necessarily indicative of future results.
Hypothetical performance results have many inherent limitations, some of which are described below. No representation is being made that any account will or is likely to achieve profits or losses similar to those shown; in fact, there are frequently sharp differences between hypothetical performance results and the actual results subsequently achieved by any particular trading program. One of the limitations of hypothetical performance results is that they are generally prepared with the benefit of hindsight. In addition, hypothetical trading does not involve financial risk, and no hypothetical trading record can completely account for the impact of financial risk of actual trading. For example, the ability to withstand losses or to adhere to a particular trading program in spite of trading losses are material points which can also adversely affect actual trading results. There are numerous other factors related to the markets in general or to the implementation of any specific trading program which cannot be fully accounted for in the preparation of hypothetical performance results and all which can adversely affect trading results.
NinjaTrader® is a registered trademark of NinjaTrader Group, LLC. No NinjaTrader company has any affiliation with the owner, developer, or provider of the products or services described herein, or any interest, ownership or otherwise, in any such product or service, or endorses, recommends or approves any such product or service.