
Adapting Greenz to today's reality
A long-term commitment for Captain Optimus Strong v2 owners
_1785574665845.png)
Zaccess extended through August
Receive up to $1,000 in purchase assistance
![[NEW execution tool] RapidShape Ordering](https://forestcms.nyc3.digitaloceanspaces.com/media/small_RapidShape Ordering banner (1280x720)_1785138140452.jpg)
[NEW execution tool] RapidShape Ordering
Place pending orders with a single drawing
![[Webinar replay] Auction Axis](https://forestcms.nyc3.digitaloceanspaces.com/media/small_webinar-repay-auction-axisihdhđ_1785126444244.png)
[Webinar replay] Auction Axis
James Buchman explains how he sets his bias before entering trades.
![[NEW trading strategy] BigTrade Sweep + LIQ Sweep Hunter](https://forestcms.nyc3.digitaloceanspaces.com/media/small_Thumbnail LIQ Sweep Hunter + Big Trade Sweep_1784773279263.jpg)
[NEW trading strategy] BigTrade Sweep + LIQ Sweep Hunter
What causes a Big Reversal? Liquidity isn’t enough
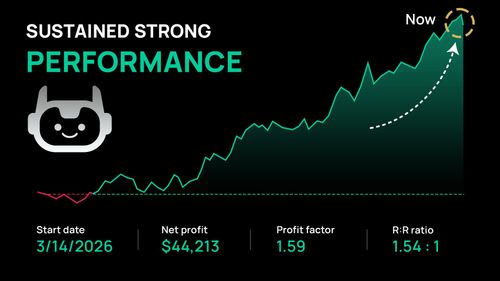
Passed Bulenox with a 3-month backtest
See how this 100% automated trading system performed on both MNQ and NQ.
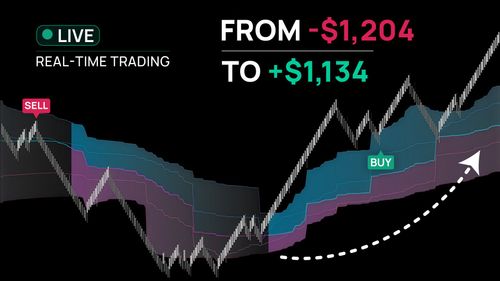
Recovering from a $1,100 drawdown
Watch how 25+ live trades using VWAP helped rebuild the account step by step.
Exploring the Ichimoku cloud Indicator for NinjaTrader 8
In the dynamic world of trading, indicators come and go, but some stand the test of time with unwavering resilience. The Ichimoku Cloud indicator is a prime example of this enduring excellence.
The Ichimoku Cloud stands out for its ability to offer a comprehensive market view, allowing quick assessment of trend direction, momentum, and support/resistance levels. Its remarkable adaptability across different time frames makes it suitable for both short-term intraday traders and long-term investors.
Crafted by Japanese journalist Goichi Hosoda in the late 1930s and 1940s, the Ichimoku Cloud, or "Ichimoku Kinko Hyo" in Japanese, is more than just a technical indicator – it's a one-glance equilibrium chart.
The Ichimoku Cloud indicator involves analyzing the relationships between these key elements:
✅ Tenkan Sen (Conversion Line): Short-term moving average calculated from the highest high and lowest low over 9 periods, indicating market momentum.
✅ Kijun Sen (Base Line): Medium-term moving average over 26 periods, confirming market trends.
✅ Senkou Span A (Leading Span A): Positioned between Tenkan Sen and Kijun Sen, forming one edge of the Kumo (cloud).
✅ Senkou Span B (Leading Span B): Midpoint between the 52-week high and low, forming the other edge of the Kumo.
✅ Kumo (Cloud): Space between Senkou Span A and Senkou Span B, offering insights into market strength and support/resistance levels through thickness and color.
✅ Chikou Span (Lagging Span): Traces the closing price 26 periods behind, aiding in identifying potential trend shifts.
iqsbDmDtX2
Here's a step-by-step guide on effectively utilizing the Ichimoku Cloud indicator:
✅ Understand the components:
Get acquainted with the fundamental elements of the Ichimoku Cloud, including Tenkan Sen, Kijun Sen, Senkou Span A and B, Kumo (cloud), and Chikou Span. Understand their roles in identifying trends, momentum, and support/resistance levels.
✅ Identify the Trend:
Examine the overall positioning of the price in relation to the cloud.
- Bullish Trend: Price above the cloud.
- Bearish Trend: Price below the cloud.
✅ Evaluate cloud color:
- Bullish: Blue cloud (Senkou Span A above Senkou Span B).
- Bearish: Pink cloud (Senkou Span B above Senkou Span A).
is3DLZDbX2
✅ Assess cloud thickness:
The thickness of the cloud indicates robust support (in a bullish trend) or formidable resistance (in a bearish trend).
✅ Monitor crossovers:
Pay attention to crossovers between Tenkan Sen and Kijun Sen.
- Bullish Signal: Tenkan Sen crosses above Kijun Sen.
- Bearish Signal: Tenkan Sen crosses below Kijun Sen.
✅ Watch for Kumo twists:
Observe twists in the cloud, where Senkou Span A and B may switch positions.
- Bullish Signal: Twist with Senkou Span A crossing above Senkou Span B.
- Bearish Signal: Twist with Senkou Span B crossing above Senkou Span A.
✅ Check Chikou Span:
Evaluate the position of Chikou Span in relation to historical prices.
- Bullish Signal: Chikou Span above historical prices.
- Bearish Signal: Chikou Span below historical prices.
If you want to elevate your Ichimoku cloud trading experience, explore our Superior Ichimoku indicator for NinjaTrader 8. Here's why it stands out:
✅ Unrivaled precision: Our Superior Ichimoku offers a high accuracy in market analysis.
✅ Enhanced predictions: Benefit from future segments of Senkou Span A and B for advanced predictive insights.
✅ Smoothing mastery: Utilize 11 popular moving averages to reduce lag and filter out false signals.
✅ Trend phase clarity: Easily identify trend phases based on precise price positioning relative to the Ichimoku cloud.
✅ Instant trend recognition: Swiftly identify trend status with our advanced bar painting technology.
✅ Optimal performance: Harness the power of ninZaATR for improved performance on intraday charts.
✅ Additional features: Enjoy a range of user-friendly features, including on/off switch, colorized bars, and more.
✅ Alert capabilities: Stay informed with trend shift alerts and markers, designed for advanced traders.
✅ Seamless compatibility: Specifically crafted for NinjaTrader 8, ensuring a smooth and efficient user experience.
Experience the difference with Superior Ichimoku – your key to advanced Ichimoku analysis in NinjaTrader 8.
Download ~ 40 FREE indicators & reach more useful resources !!!
Your feedback will help us shape a better upgrade policy for today’s reality.
Help us improve ↓
ninZa.co Indicators
0 online
![]()
ninZa.co is an official member of NinjaTrader Ecosystem together with 600+ industry-leading professionals that provide traders with quality trading products & services.


even more payment methods
Quick Links
Instructions
Support
Resources & Information
© Copyright 2026 All Rights Reserved

![]()

Because software products may be copied and stored easily, we will NOT issue refunds of any kind. ALL SALES ARE FINAL & NON-REFUNDABLE!
Futures, foreign currency, and options trading contains substantial risk and is not for every investor. An investor could potentially lose all or more than the initial investment. Risk capital is money that can be lost without jeopardizing one's financial security or lifestyle. Only risk capital should be used for trading and only those with sufficient risk capital should consider trading. Past performance is not necessarily indicative of future results.
Hypothetical performance results have many inherent limitations, some of which are described below. No representation is being made that any account will or is likely to achieve profits or losses similar to those shown; in fact, there are frequently sharp differences between hypothetical performance results and the actual results subsequently achieved by any particular trading program. One of the limitations of hypothetical performance results is that they are generally prepared with the benefit of hindsight. In addition, hypothetical trading does not involve financial risk, and no hypothetical trading record can completely account for the impact of financial risk of actual trading. For example, the ability to withstand losses or to adhere to a particular trading program in spite of trading losses are material points which can also adversely affect actual trading results. There are numerous other factors related to the markets in general or to the implementation of any specific trading program which cannot be fully accounted for in the preparation of hypothetical performance results and all which can adversely affect trading results.
NinjaTrader® is a registered trademark of NinjaTrader Group, LLC. No NinjaTrader company has any affiliation with the owner, developer, or provider of the products or services described herein, or any interest, ownership or otherwise, in any such product or service, or endorses, recommends or approves any such product or service.