Adapting Greenz to today's reality
A long-term commitment for Captain Optimus Strong v2 owners
_1785574665845.png)
Zaccess extended through August
Receive up to $1,000 in purchase assistance
![[NEW execution tool] RapidShape Ordering](https://forestcms.nyc3.digitaloceanspaces.com/media/small_RapidShape Ordering banner (1280x720)_1785138140452.jpg)
[NEW execution tool] RapidShape Ordering
Place pending orders with a single drawing
![[Webinar replay] Auction Axis](https://forestcms.nyc3.digitaloceanspaces.com/media/small_webinar-repay-auction-axisihdhđ_1785126444244.png)
[Webinar replay] Auction Axis
James Buchman explains how he sets his bias before entering trades.
![[NEW trading strategy] BigTrade Sweep + LIQ Sweep Hunter](https://forestcms.nyc3.digitaloceanspaces.com/media/small_Thumbnail LIQ Sweep Hunter + Big Trade Sweep_1784773279263.jpg)
[NEW trading strategy] BigTrade Sweep + LIQ Sweep Hunter
What causes a Big Reversal? Liquidity isn’t enough
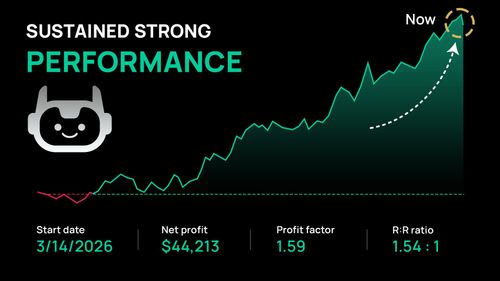
Passed Bulenox with a 3-month backtest
See how this 100% automated trading system performed on both MNQ and NQ.
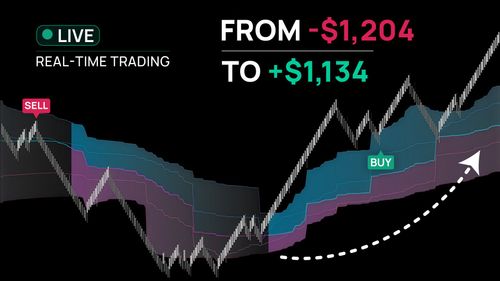
Recovering from a $1,100 drawdown
Watch how 25+ live trades using VWAP helped rebuild the account step by step.
How to identify a Reversal before it happens (3 proven steps traders use)
Spotting a market reversal before it actually happens is one of the most valuable skills for traders. Put simply, learning how to identify a reversal before it happens is what separates experienced traders from beginners.
Catching a turning point early can improve entries, reduce risk, and open the door to higher reward-to-risk trades. But here’s the truth: there is no single signal that can guarantee a reversal. Instead, traders need to combine tools, read the context, and think in terms of probability.
This guide will walk you through the main methods – chart patterns, candlestick patterns, and technical indicators – and show you how to bring them together to confirm a potential reversal.
1. Never rely on a single signal
Many new traders make the mistake of assuming that one reversal candlestick (like a hammer or a shooting star) or one bearish chart pattern (like a double top) is enough to call the top. In reality, reversals are high-probability events only when multiple signs align.
- A single engulfing candle may fail without broader confirmation.
- A head and shoulders top could be invalidated if momentum remains strong.
- An RSI divergence without confluence often signals just a pause, not a full reversal.
2. The 3 main groups of Reversal signals
Reversals rarely happen without warning. Price action and indicators often leave behind clues, which can be grouped into three main categories:
2.1. Chart patterns
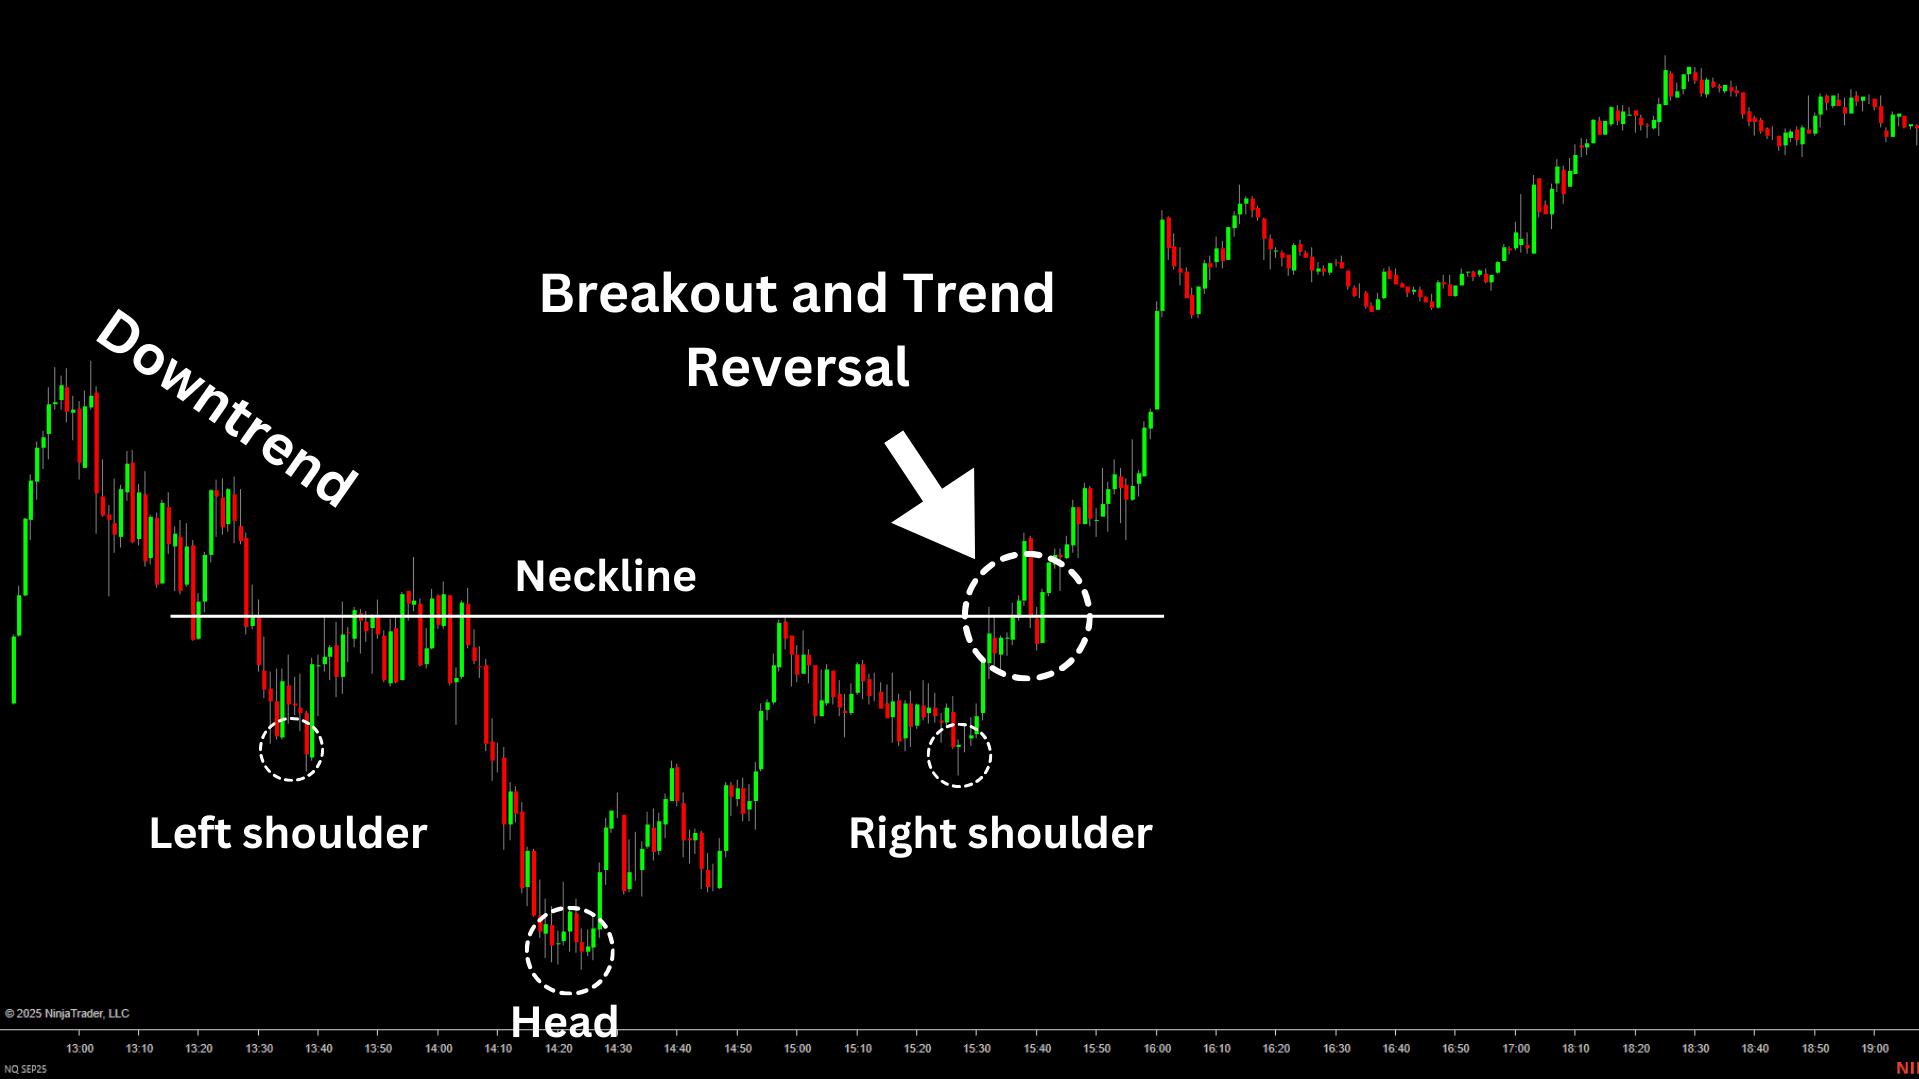
Classic reversal chart patterns like the Double Top (M), Double Bottom (W), Head and Shoulders, or Falling/Rising Wedges often mark turning points in the market. These patterns reflect the battle between buyers and sellers and highlight moments when momentum is shifting.
Example: A head and shoulders pattern forming after a downtrend signals that sellers are losing strength, and buyers are stepping in.
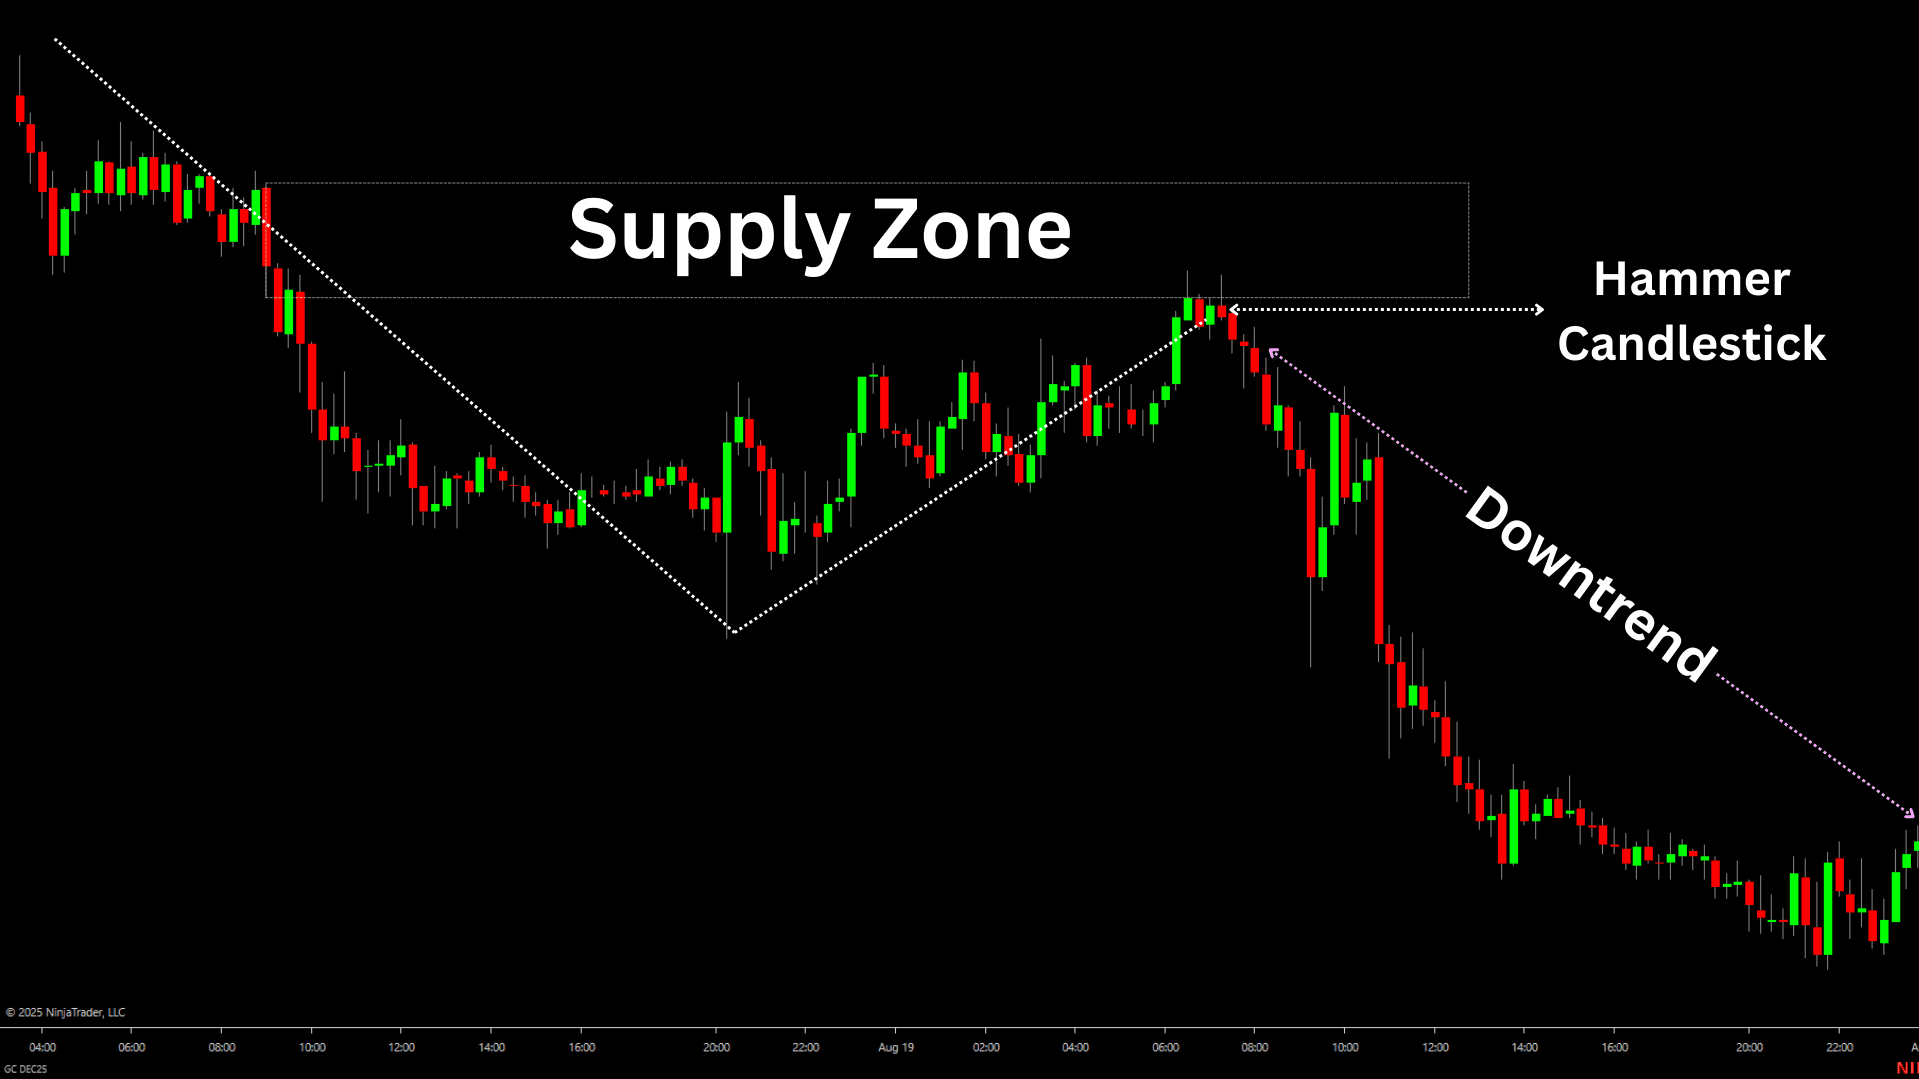
2.2. Candlestick patterns
Single or multi-candle formations such as the Hammer, Inverted Hammer, Hanging Man, Shooting Star, or Engulfing patterns provide more immediate signals of exhaustion. They work best when they occur at key support/resistance levels or in overbought/oversold zones.
Example: A hammer candle at a strong supply zone suggests that buying pressure is drying up, allowing sellers to push the price lower.
2.3. Indicators & Oscillators
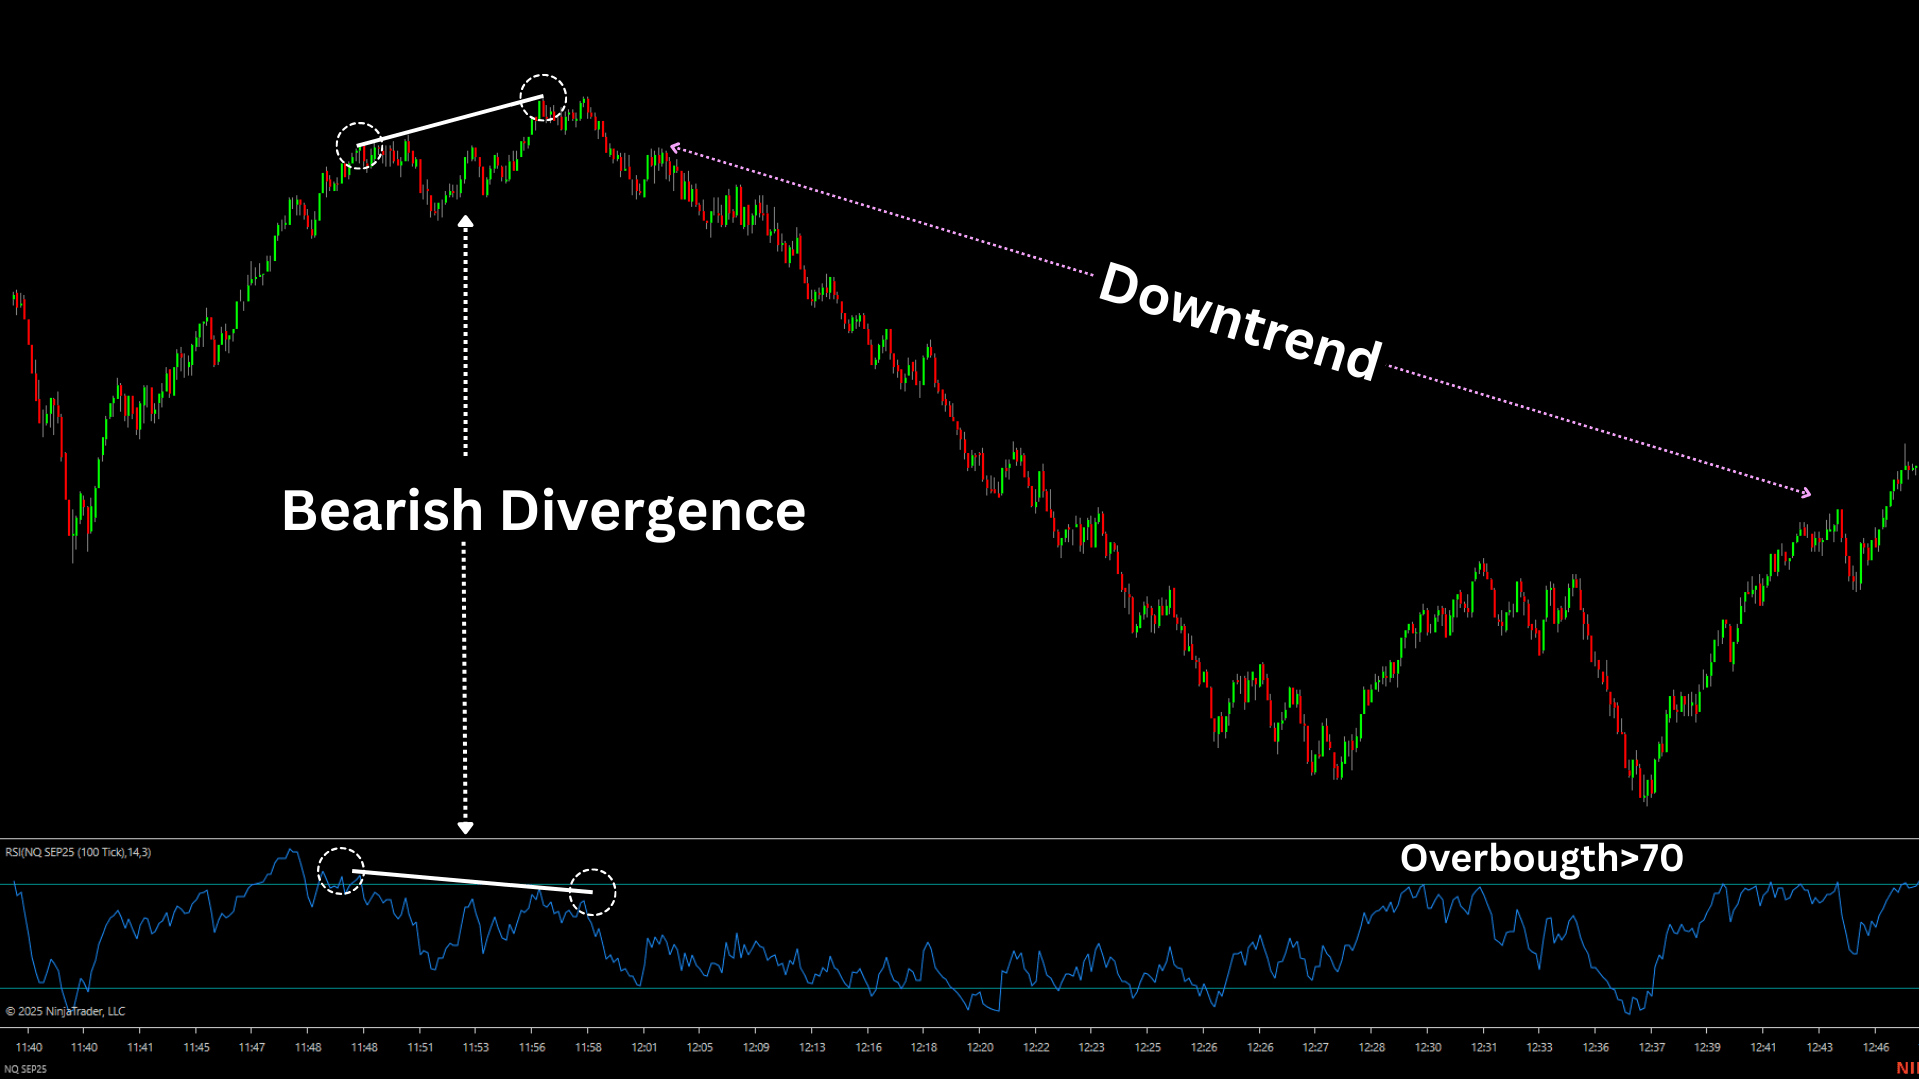
Technical tools like the Relative Strength Index (RSI), MACD, Stochastic, and Volume analysis help confirm when momentum is weakening. These indicators can identify divergences – moments when price moves one way but momentum disagrees, which often precedes a reversal.
Example: If price makes a higher high but RSI prints a lower high (bearish divergence), it signals that the uptrend may be running out of steam.
3. The power of agreement
The highest-probability reversals occur when multiple tools confirm the same story. This is called confluence.
If a double top forms and RSI shows bearish divergence, confidence rises.
- If an engulfing candle appears and MFI confirms overbought conditions, the reversal setup is stronger.
- If multiple oscillators (RSI, Stochastic, MFI) overlap in overbought territory, the signal is far more reliable than using RSI alone.
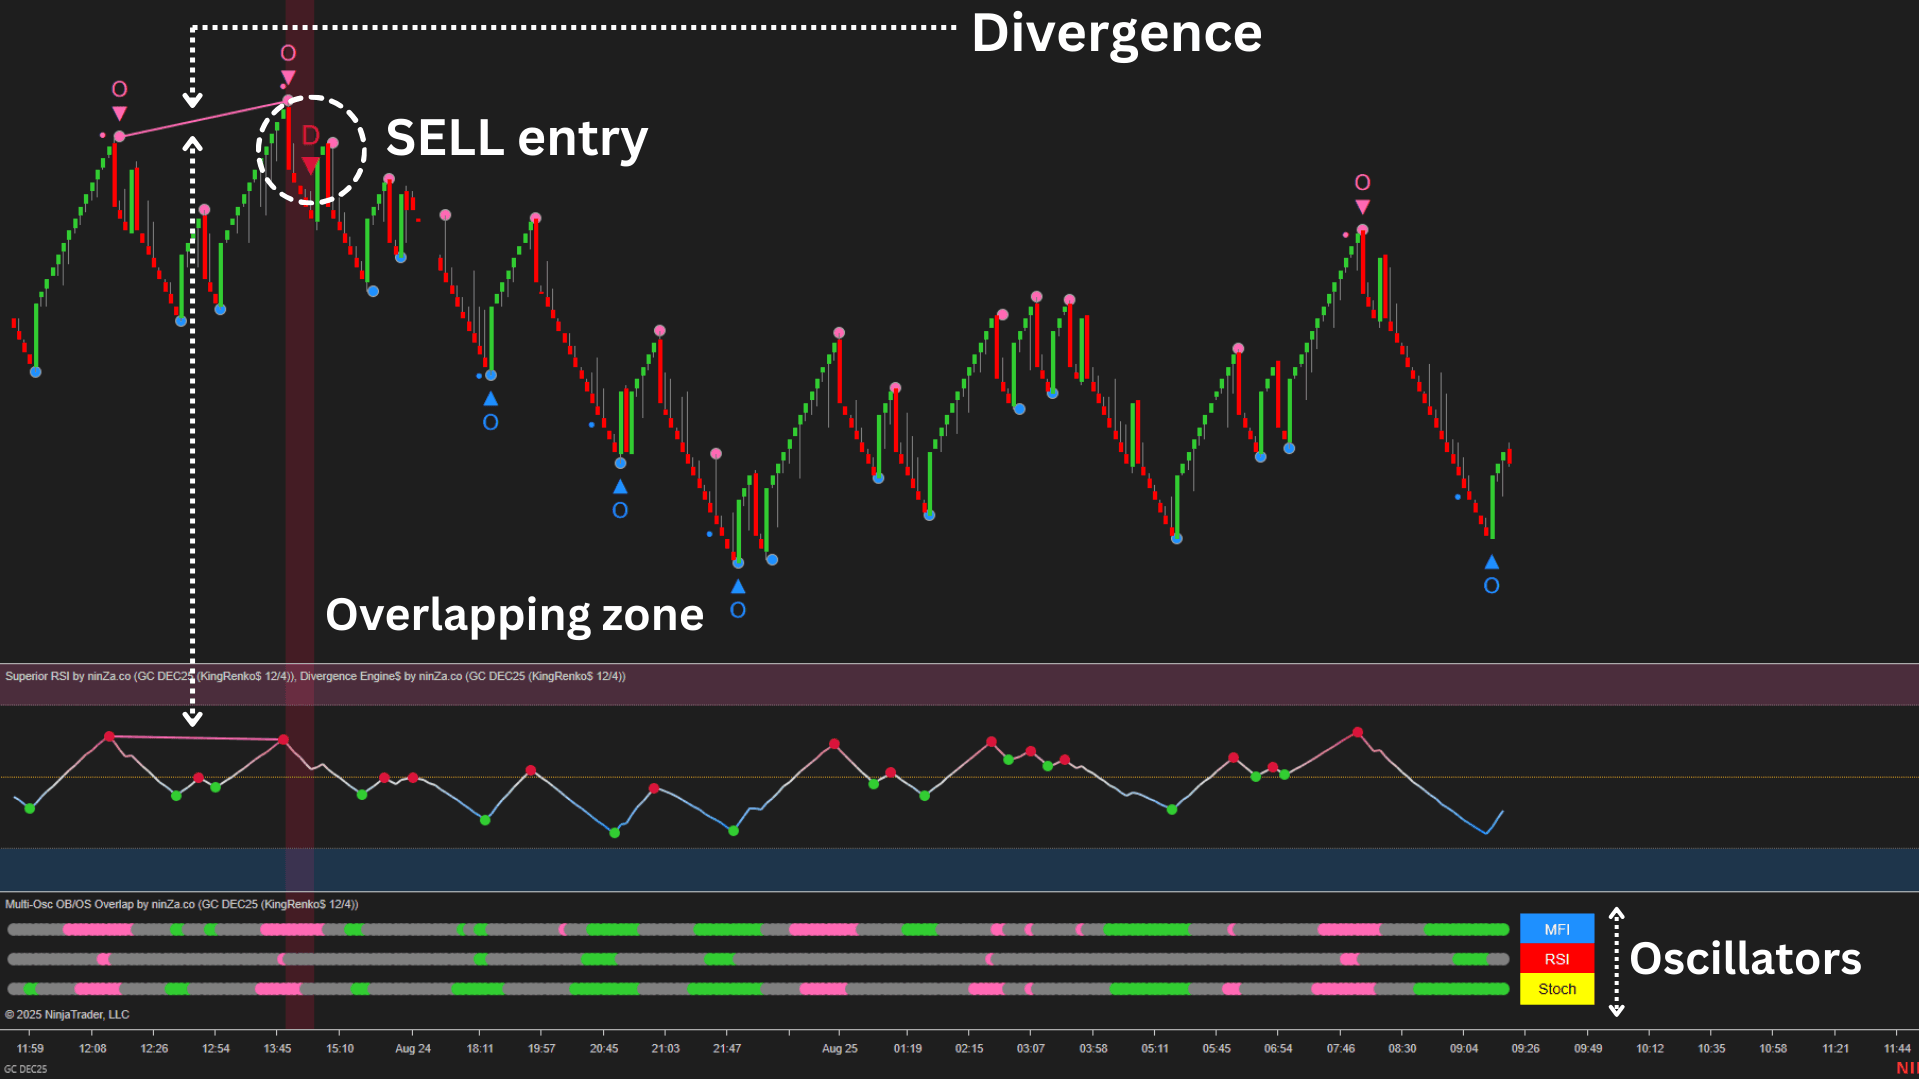
Pro tip: Use divergence with multi-oscillator overlap
One of the strongest answers to the question of how to identify a reversal before it happens is when RSI divergence aligns with overlapping signals from multiple oscillators in overbought or oversold zones. Let’s break it down step by step:
1. Spot early divergence on RSI
- Divergence is one of the earliest warning signs of a potential market reversal.
- For example, if price makes a higher high but RSI prints a lower high, momentum is weakening. This is a classic early signal that a reversal may occur before price actually turns.
2. Confirm with other oscillators
- Don’t rely on RSI alone – add confirmation from other indicators like Stochastic or Money Flow Index (MFI).
- If RSI shows bearish divergence while Stochastic and MFI are both in overbought territory, it creates a layered confirmation that a trend reversal is forming.
3. Focus on the overlap zone
- The overlap of exhaustion signals is critical for spotting reversals ahead of time.
- When multiple oscillators cluster in the same extreme zone (for reference, RSI > 70, Stochastic > 80, MFI > 80), it indicates that the market is likely to reverse.
4. Why this works for early detection
- Popular oscillators are watched by traders worldwide.
- When they all flash exhaustion simultaneously, market psychology shifts: traders start closing positions or preparing for a countertrend move.
- The result is often a swift reversal – especially if it aligns with a key resistance or support level on a higher timeframe.
4. Higher timeframes first
One of the most common pitfalls for new traders when trying to identify a reversal before it happens is over-relying on very short timeframes like the 1-minute or 5-minute chart. These charts generate endless signals – many of which turn out to be false reversal signals because they exaggerate minor price fluctuations.
A sharp 10-pip move on a 5-minute chart may look like a trend reversal pattern, but on the 4-hour or Daily chart, it’s often nothing more than a brief retracement within a much stronger move.
Higher timeframes (H4, Daily, Weekly) act as a filter
They smooth out intraday noise and reveal the real market structure – major support/resistance, supply and demand zones, and the broader trend direction.
A reversal identified on a Daily chart carries far more weight than one spotted on a 5-minute chart, simply because large institutional traders and funds operate primarily on these higher timeframes.
Multi-timeframe agreement: Filtering Real vs Fake Reversals
The odds of spotting a true reversal before it fully plays out increase dramatically when both higher and lower timeframes confirm the same story. For example:
- Strong setup (Agreement):
H4 RSI is in overbought territory, indicating that buyers are losing strength. 15-minute RSI also rolls over from overbought.
Here, both the bigger structure and the intraday view align – suggesting that the market isn’t just pausing but preparing for a confirmed reversal. - Weak Setup (Disagreement):
H4 RSI remains overbought. Meanwhile, the 15-minute RSI dips into oversold territory.
This may look like a buy signal for intraday traders, but in reality, it’s usually a small pullback inside the dominant bearish structure. The main trend is still intact, and the lower timeframe is just unwinding short-term pressure – a classic fakeout.
Some advanced tools, such as custom oscillators like MagnetOsc Turbo, are designed around this multi-timeframe concept – helping traders measure momentum and reversals with greater clarity.
Why this matters in practice
Starting your analysis from higher timeframes helps filter out misleading reversal signals. Instead of reacting to every spike, you anchor your decisions to the broader trend context, then refine your entry on smaller timeframes. This way, you align your trades with institutional flows rather than fighting against them.
Think of it like this:
- Higher timeframe = the map (where major reversal opportunities form).
- Lower timeframe = the compass (fine-tuning entries and stop placement).
When both the map and compass point in the same direction, you’re no longer guessing – you’re on a clear path that shows you how to identify a reversal before it happens and trade with better timing.
5. Think in terms of probability
Even with chart patterns, candlestick confirmation, and oscillator divergence all lining up, reversals remain probability-based events. The market can always surprise. That’s why risk management – using stop losses, sizing trades carefully, and not overleveraging – is essential. Trading isn’t about predicting the future with certainty. It’s about stacking probabilities in your favor and acting consistently when the odds look good.
Final thoughts
Learning how to identify a reversal before it happens requires patience, practice, and a structured approach. Don’t rely on one pattern or one indicator. Instead, combine chart patterns, candlestick formations, and oscillator signals. Add confirmation from higher timeframes. Always think in terms of probability, not certainty.
By building this layered approach, you’ll gain more confidence in your entries and reduce the frustration of false reversals. Over time, spotting true turning points will feel less like guesswork and more like reading the market’s language.
Download ~ 40 FREE indicators & reach more useful resources !!!
Your feedback will help us shape a better upgrade policy for today’s reality.
Help us improve ↓
ninZa.co Indicators
0 online
![]()
ninZa.co is an official member of NinjaTrader Ecosystem together with 600+ industry-leading professionals that provide traders with quality trading products & services.


even more payment methods
Quick Links
Instructions
Support
Resources & Information
© Copyright 2026 All Rights Reserved

![]()

Because software products may be copied and stored easily, we will NOT issue refunds of any kind. ALL SALES ARE FINAL & NON-REFUNDABLE!
Futures, foreign currency, and options trading contains substantial risk and is not for every investor. An investor could potentially lose all or more than the initial investment. Risk capital is money that can be lost without jeopardizing one's financial security or lifestyle. Only risk capital should be used for trading and only those with sufficient risk capital should consider trading. Past performance is not necessarily indicative of future results.
Hypothetical performance results have many inherent limitations, some of which are described below. No representation is being made that any account will or is likely to achieve profits or losses similar to those shown; in fact, there are frequently sharp differences between hypothetical performance results and the actual results subsequently achieved by any particular trading program. One of the limitations of hypothetical performance results is that they are generally prepared with the benefit of hindsight. In addition, hypothetical trading does not involve financial risk, and no hypothetical trading record can completely account for the impact of financial risk of actual trading. For example, the ability to withstand losses or to adhere to a particular trading program in spite of trading losses are material points which can also adversely affect actual trading results. There are numerous other factors related to the markets in general or to the implementation of any specific trading program which cannot be fully accounted for in the preparation of hypothetical performance results and all which can adversely affect trading results.
NinjaTrader® is a registered trademark of NinjaTrader Group, LLC. No NinjaTrader company has any affiliation with the owner, developer, or provider of the products or services described herein, or any interest, ownership or otherwise, in any such product or service, or endorses, recommends or approves any such product or service.