
8 Steps Every Trader Needs to Build a Day Trading Strategy [2026]
Day trading can be both exciting and challenging. It’s about making quick decisions – but with a structured plan behind every trade. Without a clear strategy, many traders end up relying on luck, and luck doesn’t last long in the markets.
Let’s go step by step and explore how you can build your own day trading strategy.
What is day trading?
Day trading means opening and closing positions within the same session to avoid overnight risk. The aim is not to catch every move, but to capture repeatable intraday patterns with controlled risk.
Why do you need a strategy as a day trader?
Because the market will test your emotions, a written strategy protects you from impulsive decisions. It defines what to trade, when to act, how much to risk, and when to stop, so your rules are your seatbelt.
Steps to build a day trading strategy
1) Pick a timeframe
Choose one primary chart to trade and one higher timeframe for context. Please keep it simple at the start.
How different bar types work:
Bar type | Core idea | Strengths | Watch-outs | Good starting point |
| Tick | A bar forms after X trades | Adapts to activity, shows flow in busy periods | Noisy in low volume | 100 – 1000 ticks |
| Minute | Time-based | Simple, widely used, easy to schedule | Noisy | 3, 5, or 15 minutes,... |
| Range | A bar forms only after price moves a fixed distance | Clean swings, equal bar height | Can print very fast in volatility | 50 – 500 range |
| Volume | A bar forms after X contracts/shares | Highlights where participation concentrates | Prints slow in quiet markets | 1000 – 5000 volume |
| ninZaRenko, KingRenko$ | Custom Renko variations | Smoother structure, clearer zones | Brick logic differs – test exits | Moderate sizes like 12/4, 15/5, 20/10, then adjust |
Tip: Pick one main chart first. Add a higher timeframe only for trend bias and key levels.
2) Where to enter
Define one entry pattern to focus on. Don’t mix 3 styles on day one.
Common entry styles:
Signal type | Details | Example indicators |
| Breakouts | Enter when price clears a key level with strong activity | Breakout Hunter, Trendline Autom@ton |
| Pullbacks | Enter with the trend after retracement to an MA or prior structure | Sumo Pullback$, Solar Wave, ThunderZilla, Zenith-X |
| Reversals | Fade an extended move at support or resistance with confirmation | Multi-Osc OB/OS Overlap, VoluTank Army, Super JumpBoo$t |
👉 Keep your entry conditions few and objective. If 2 conditions don’t align, you don’t trade.
3) Where to exit
Exits are both your seatbelt and your profit driver. Decide them before you click buy or sell.
Types of exits
- Initial stop: placed at the technical level that breaks your setup (below pullback low, beyond range boundary, or a multiple of ATR) → ATR-TradeShield
- Time stop: if price goes nowhere after N bars, exit. It frees attention and avoids chop → Smart Escape
- Profit taking: predefine targets or trail behind structure
4) Determine R/R ratios
Plan risk first, reward second.
- Per-trade risk: 0.5% – 1.0% of your account is common. Smaller is safer while you learn.
- R/R ratio: start with 1:2 (risk 1 to aim for 2).
- Daily stop: stop trading after you hit your daily loss limit to prevent one bad day from becoming a bad week.
5) Day trading discipline & emotional control
Your rules are only as strong as your ability to follow them.
- Pre-market routine: sleep well, hydrate, mark levels, outline plan A and plan B.
- News filter: mark high-impact events, stand aside 5 minutes before/after if your system is sensitive.
- Trade frequency: cap it – e.g., 3–5 quality trades per day.
- Recovery rules: no revenge trades, take a walk after 2 consecutive losses.
- End-of-day: stop at your daily goal or stop. Protect your mindset for tomorrow.
6) Indicators for day trading
Indicators are tools, not signals by themselves. Use a small set and know what each one tells you. This November, many exclusive offers for Black Friday await you!
A balanced toolkit:
- Trend context: moving averages, trend vectors like Solar Wave, or ATR-Fibonacci bands like PANA Kanal
- Momentum/oscillators: RSI, or enhanced indicators like Multi-Osc OB/OS Overlap, Impulse MACD Pro, …
- Volatility: ATR for sizing stops and avoiding tiny ranges
- Volume/flow: session profiles, or order flow indicators like Quantum Vol-Delta or VoluTank Army, …
- Support/resistance: daily highs/lows, opening range, VWAP, or indicators like Support/Resistance Radar, Supply/Demand Discovery, Super JumpBoo$t, …
7) Start small
Trade the smallest size your market allows. Your 1st goal is process consistency, not profit.
- You should focus on execution quality and journaling.
- If you can’t follow rules with a micro contract or minimum lot, a larger size won’t fix it.
8) Backtest
Backtesting builds belief and exposes weak assumptions.
- How to backtest simply
- Write your rules on one page.
- Pick one market and one chart type.
- Scroll bar by bar, mark entries/exits exactly as the rules say.
- Record R results, max adverse/favorable excursion, and time in trade.
- Aim for at least 100 trades as a base sample.
Quality checks
- Include different weekdays and both fast/slow sessions
- Factor in commissions and realistic slippage
- Keep one out-of-sample month for forward testing
- Use NinjaTrader 8 Strategy Builder to code your rules and run automated backtests. This speeds up validation, lets you compare multiple settings, and ensures your logic works consistently
- Consider a HelloWin backtest if you want a deeper statistical report (win/loss streaks, drawdowns, performance curves). This gives you a more complete picture than raw results alone
Backtest, iterate, tweak, and stick to it
Improve one variable at a time. Change the stop logic or entry filter, not both. Keep version numbers and a change log. After each tweak, trade the rules for at least 2 weeks.
Constant change = no real measurement.
Example strategy you can test
Market and schedule
- Instrument: a liquid futures contract or a major forex pair.
- Session: first 2 hours of the main session, then stop.
Chart and context
- 5-minute trading chart.
- 15-minute chart for trend bias.
Setup: pullback with trend
We recommend using Solar Wave for this type of setup because it clearly shows both the overall trend and potential pullback signals.
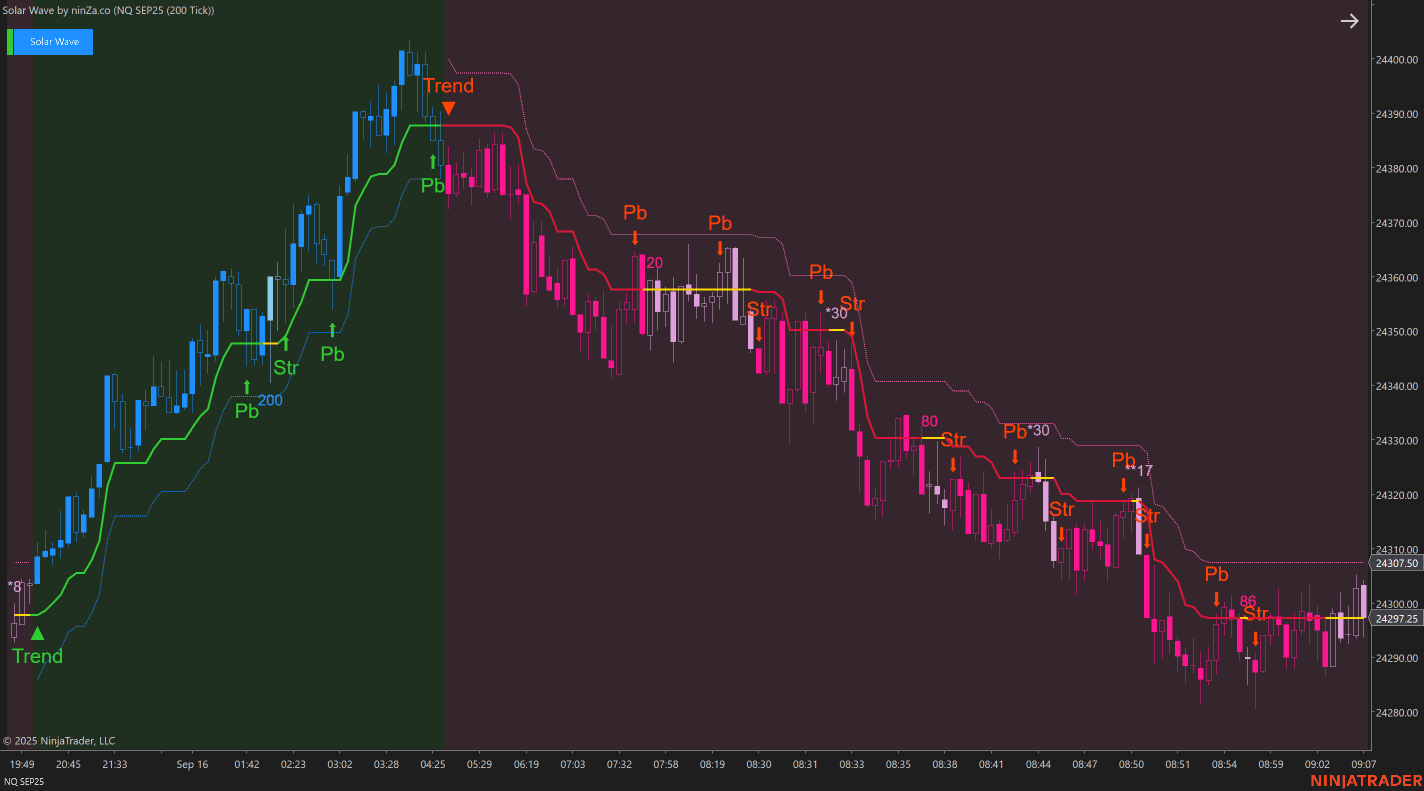
- Bias: Trade only in the direction of the Solar Wave Trend Vector (green = uptrend, red = downtrend).
- Location: Wait for the price to pull back. This zone often acts as dynamic support in an uptrend or resistance in a downtrend.
- Trigger: Enter when a candle closes back in the direction of the Trend Vector.
- Stop-loss: Place below the trend vector (in an uptrend) or above it (in a downtrend).
- Target: Aim for 2R or use the next Solar Wave extension/target zone if you prefer dynamic exits.
- Invalidation: Skip trades if price chops sideways with no clear Trend Vector or if major news is due soon.
Risk and size
- Stop: 1.2 × ATR(14) below entry candle low or pullback low.
- Target: fixed 2R.
- Size: risk 0.5% of the account per trade.
Management
- Exit the trade if the price doesn’t move as expected and hits your stop.
- Never move your stop once it’s placed – stick to your original plan.
Golden Rules
- Risk management only works if you stay disciplined.
- Trade this approach for 20 days. Each week, review your trades, highlight the ones you could have avoided, and note one improvement for the following week.
- Never trade with money you can’t afford to lose – this keeps fear and panic out of your decisions.
Trade what you can explain on one page. If you can’t explain it simply, you won’t execute it under pressure. Start small, collect data, and let the numbers guide you. When you find something that works often enough, protect it with discipline – that’s the essence of how to build a day trading strategy.
Download ~ 40 FREE indicators & reach more useful resources !!!
LIVE Intraday Trading | Stop chasing Early Entries. Let Timing guide your entry →

NINZA Indicators
0 online
_1787026707358.svg)
NINZA is an official member of NinjaTrader Ecosystem together with 600+ industry-leading professionals that provide traders with quality trading products & services.




even more payment methods
Quick Links
Instructions
Support
Resources & Information
© Copyright 2026 All Rights Reserved



Because software products may be copied and stored easily, we will NOT issue refunds of any kind. ALL SALES ARE FINAL & NON-REFUNDABLE!
Futures, foreign currency, and options trading contains substantial risk and is not for every investor. An investor could potentially lose all or more than the initial investment. Risk capital is money that can be lost without jeopardizing one's financial security or lifestyle. Only risk capital should be used for trading and only those with sufficient risk capital should consider trading. Past performance is not necessarily indicative of future results.
Hypothetical performance results have many inherent limitations, some of which are described below. No representation is being made that any account will or is likely to achieve profits or losses similar to those shown; in fact, there are frequently sharp differences between hypothetical performance results and the actual results subsequently achieved by any particular trading program. One of the limitations of hypothetical performance results is that they are generally prepared with the benefit of hindsight. In addition, hypothetical trading does not involve financial risk, and no hypothetical trading record can completely account for the impact of financial risk of actual trading. For example, the ability to withstand losses or to adhere to a particular trading program in spite of trading losses are material points which can also adversely affect actual trading results. There are numerous other factors related to the markets in general or to the implementation of any specific trading program which cannot be fully accounted for in the preparation of hypothetical performance results and all which can adversely affect trading results.
NinjaTrader® is a registered trademark of NinjaTrader Group, LLC. No NinjaTrader company has any affiliation with the owner, developer, or provider of the products or services described herein, or any interest, ownership or otherwise, in any such product or service, or endorses, recommends or approves any such product or service.