
Zuture Flex
Access premium trading products with more payment flexibility
![[Auction Δxis] A comprehensive overview of Auction Δxis](https://forestcms.nyc3.digitaloceanspaces.com/media/small_Thumbnail New release Auction ∆XIS_1784002540029.jpg)
[Auction Δxis] A comprehensive overview of Auction Δxis
Support & Resistance is not a property of indicators. It is a property of the market itself.
_1784001871922.jpg)
Summer Privilege event
More flexibility for your next trading upgrade
Receive up to $500 in Voucher-F
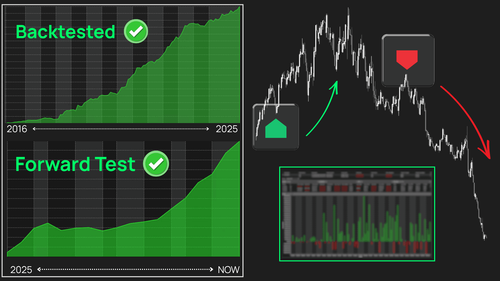
Review the optimized backtest results
- $48,000+ backtested profit for the funded account template.
- $3,200+ backtested profit on MNQ over the last four months.
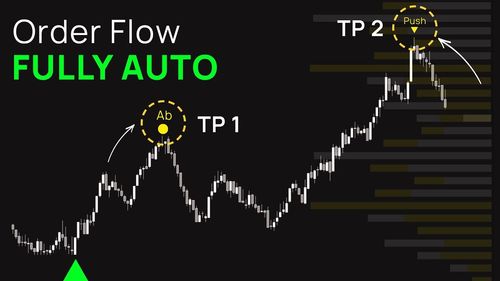
Fully Automated Order Flow
Enter with confirmed Order Flow strength. Exit when the edge starts to fade.
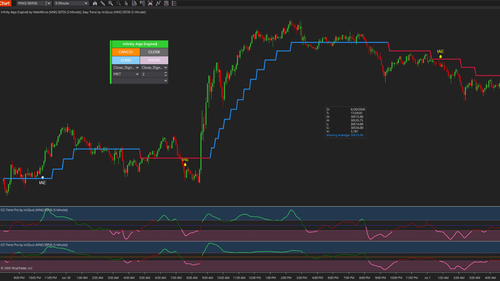
2 indicators. 1 structured CCI workflow
Double CCI combines CCI Trend Pro and Easy Trend into one structured CCI workflow
![[July Exclusive] Liberty Edge Bundle](https://forestcms.nyc3.digitaloceanspaces.com/media/small_liberty-edge-bundle-hdhdh_1783139262484.png)
[July Exclusive] Liberty Edge Bundle
From market analysis to trade execution — in one structured workflow.
Best Trading Signal Indicator for Forex (6 Key Indicators)
Finding the best trading signal indicator can make a significant difference in how you interpret market trends, price action, and volatility, and in timing your trades effectively.
A well-designed technical indicator helps you identify high-probability entries, exit points, trend confirmations, and momentum shifts with greater confidence.
Whether you focus on futures trading signals, forex strategies, swing trades, or day trading setups, the right trading tools can help you convert raw market data into actionable insights.
This guide explores the top trading signals, explains how each indicator type works, and provides practical tips on combining momentum, trend, and volume indicators for stronger signal validation and trade confirmation.
Many professional-grade trading tools, including several advanced indicators in this article, are on BlackFriday savings at ninZa.co – an ideal moment to upgrade your trading toolkit.
1. What is a trading signal indicator?
A trading signal indicator is a technical tool that identifies potential buy or sell opportunities based on market data such as price, volume, momentum, and volatility.
These indicators process historical and real-time information to generate trade signals – alerts that help traders determine when to enter, exit, or manage positions effectively.
There are 2 broad categories:
- Leading indicators aim to forecast future price moves by detecting early shifts in momentum, market sentiment, or trend direction. They provide signals before a trend fully forms, allowing traders to position ahead of the market.
- Lagging indicators confirm a move after it has started. Often trend-following, they assist traders in validating breakouts, reversals, or trend strength before committing capital.
Understanding how these trading tools work – and whether you prefer early forecasts or confirmed trends – is key to choosing the best trading signal indicator that matches your trading style, risk management plan, and strategy.
2. Top trading signal indicators you should know
The market offers countless technical tools, but a handful of classic indicators consistently stand out for generating the best signals for trading across futures, forex, and equities.
These indicators distill price and volume data into actionable insights, helping traders spot entries, exits, and trend strength without relying on guesswork.
Below, we explore the most trusted categories – explaining how each works in real trading, when to use them, and the key advantages and limitations to consider.
1. Moving Average (MA)
Moving averages smooth price data into a clearer trend line, allowing traders to filter short-term noise and identify overall direction. By averaging past prices, they can reveal dynamic support or resistance levels and remain a core tool for generating futures trading signals.
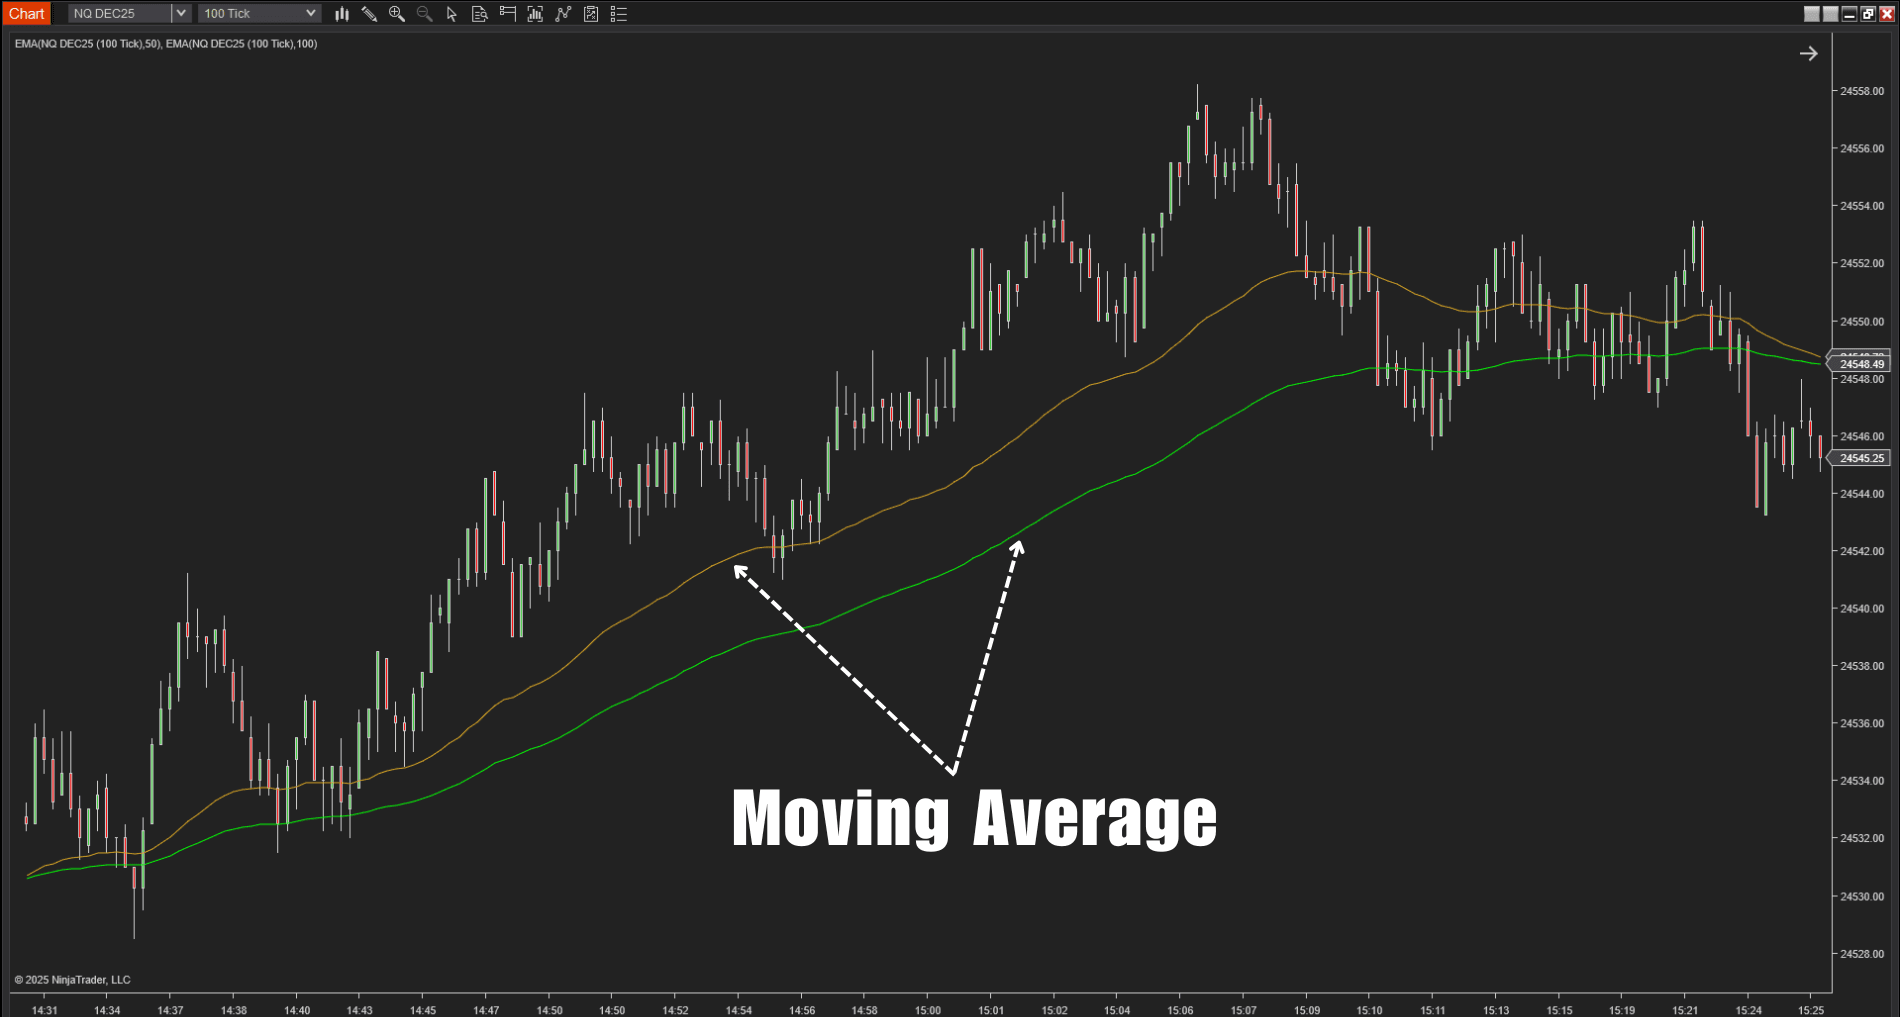
Because they rely on historical data, moving averages lag behind price action: the delay helps confirm trend strength but can also result in late entries or whipsaws during fast or sideways markets.
How to use
- Trend identification: A rising MA suggests bullish momentum; a falling MA points to bearish pressure.
- Crossover entries: A buy signal appears when a short-term MA crosses above a long-term MA, while a sell signal occurs on the opposite crossover.
- Dynamic Support/Resistance: Price often bounces from or breaks through the MA line, offering potential entry or exit levels.
To go beyond basic MAs, professional traders look for tools that capture trend strength and pullbacks more precisely.
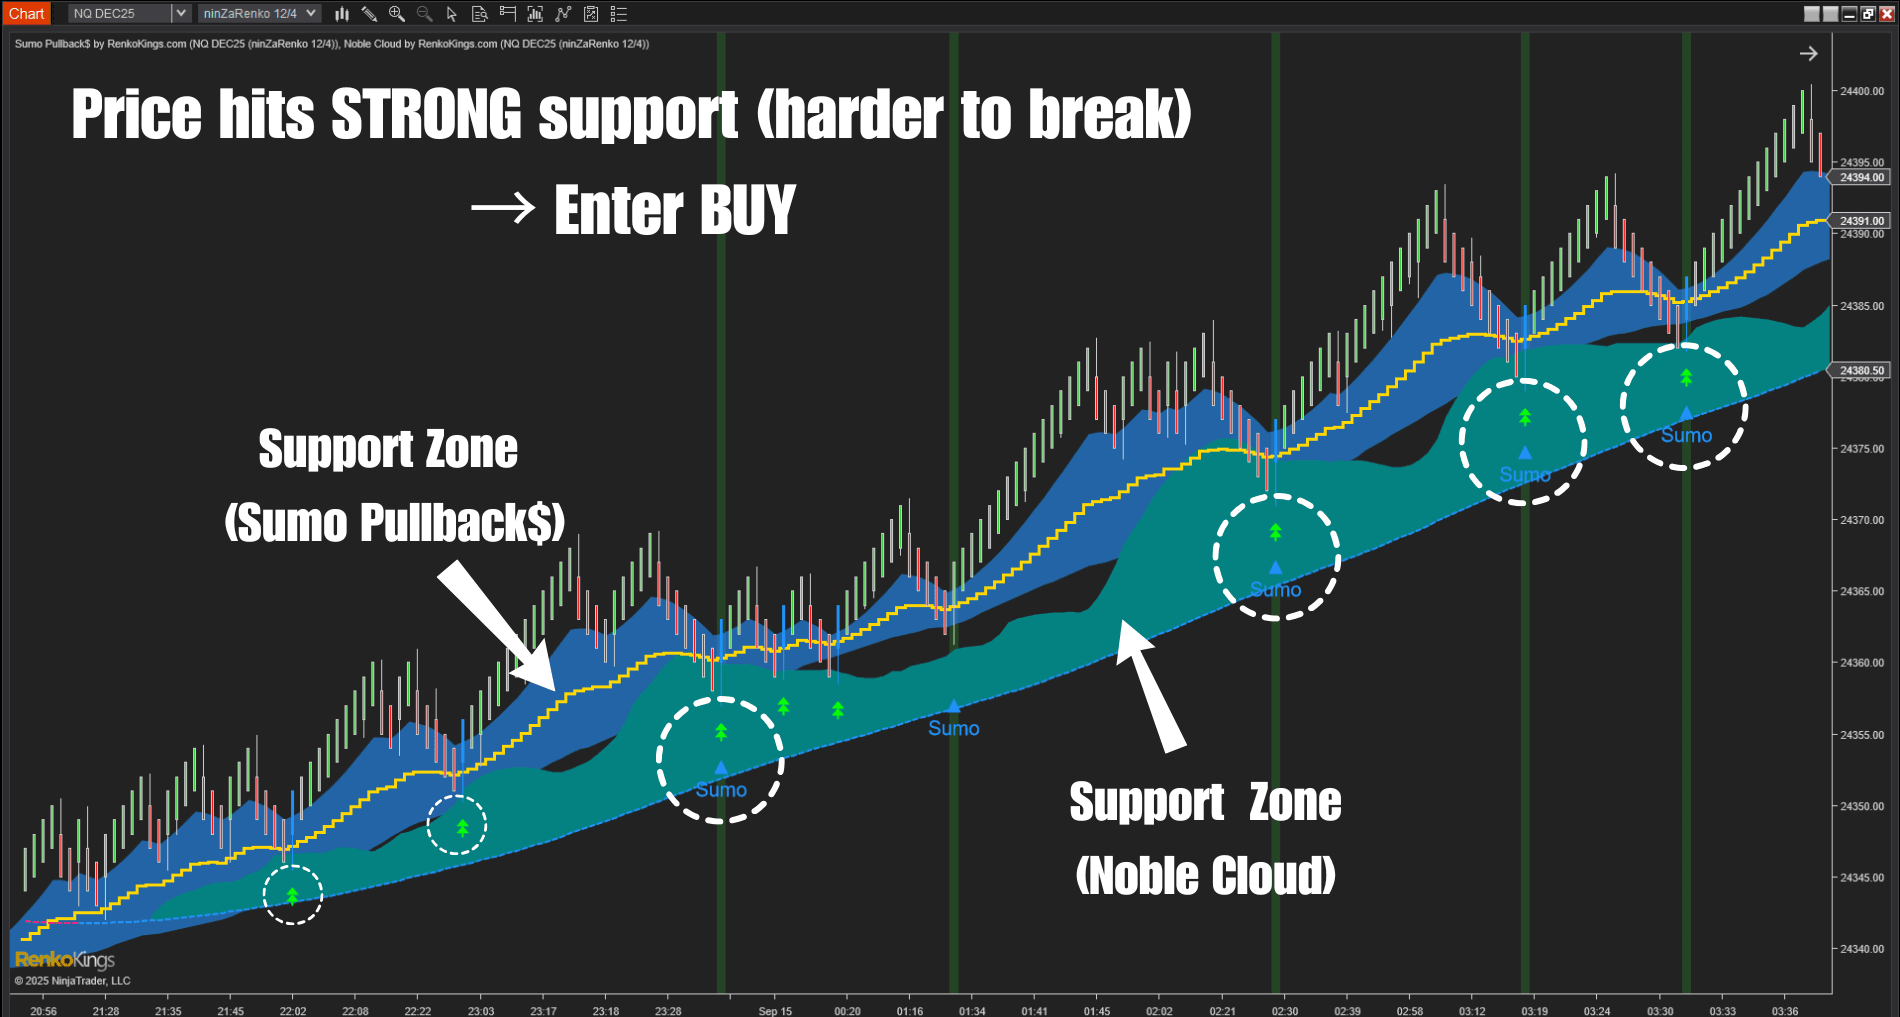
Sumo Pullback$ builds on triple moving averages to form a color-coded cloud that instantly shows whether bulls or bears dominate. Its green or red cloud thickens with strong momentum and filters out weak pullbacks, giving clearer signals on when a trend is healthy or fading.
Noble Cloud takes a different path by applying a specially smoothed MA and forming a purple “zone” around its baseline; a reversal candle within this zone confirms a high-probability pullback while keeping market noise to a minimum.
2. Relative Strength Index (RSI)
The Relative Strength Index (RSI) measures momentum by comparing recent gains and losses over a set period. Readings above 70 or below 30 suggest overbought or oversold conditions, hinting that a pullback or reversal may be near.
Traders use RSI to judge trend strength and time entries or exits as momentum fades.
RSI is easy to read and adapts well across timeframes, making it a quick gauge of market momentum. Its drawback is sensitivity in choppy markets, where repeated overbought or oversold signals can create whipsaws, especially if traders rely on fixed 70/30 levels alone.
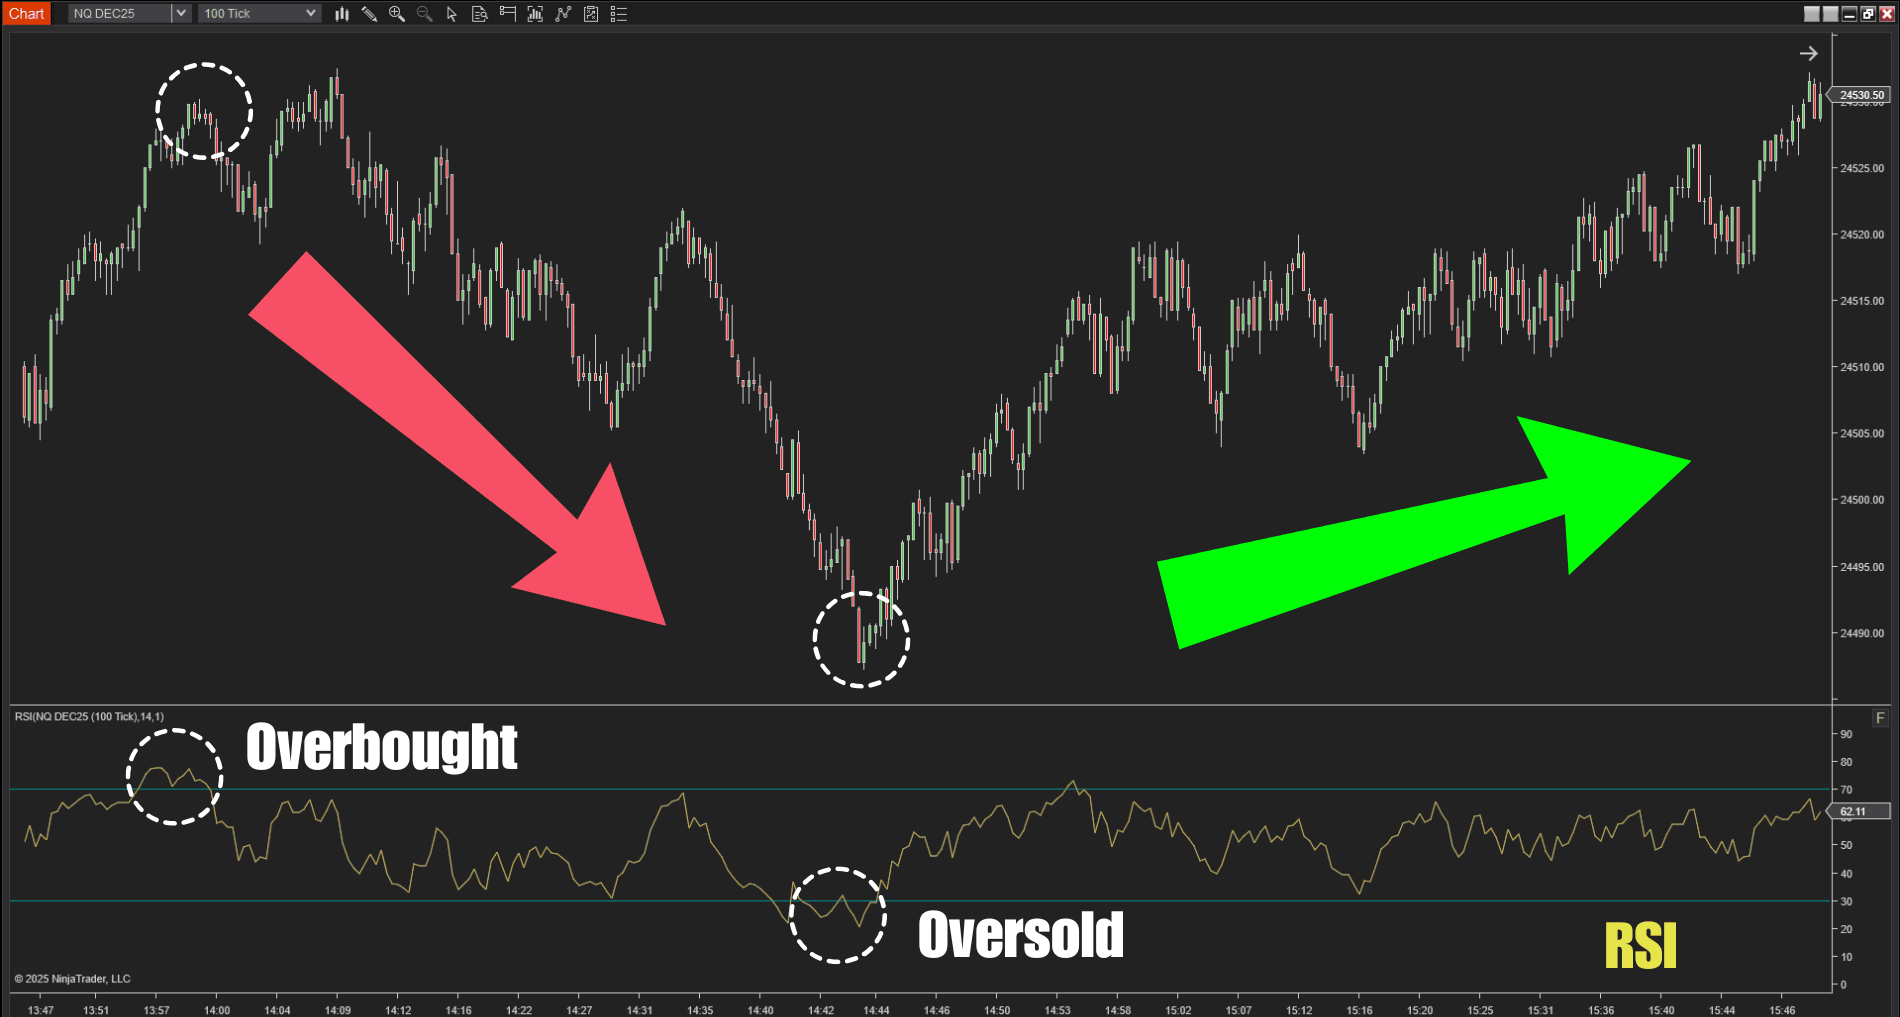
- Watch for centerline crossovers: RSI moving above 50 can hint at a new uptrend; dropping below 50 can indicate a potential downtrend.
- Look for breakouts of overbought/oversold zones but wait for price or candlestick confirmation before acting.
- Combine RSI signals with trend direction or key support/resistance levels to filter out false setups.
A professional-grade upgrade is Karthik Dynamic RSI Pro, which swaps fixed 70/30 levels for adaptive bands that expand or contract with volatility.
Its dual-cloud design and adjustable baseline react in real time – widening in fast markets to filter noise and tightening in calm periods to capture early shifts – offering a more flexible, responsive approach to traditional RSI.
3. MACD (Moving Average Convergence Divergence)
MACD blends 2 exponential moving averages to track the distance – or convergence and divergence – between them. By plotting a MACD line, a signal line, and a histogram of their difference, it helps traders spot momentum shifts and potential trend changes.
Traders value MACD for the clarity of its crossovers and the visual momentum cues in the histogram. The flip side is timing: built on moving averages, it naturally lags price, which can lead to late entries or false signals when markets chop sideways or accelerate quickly.
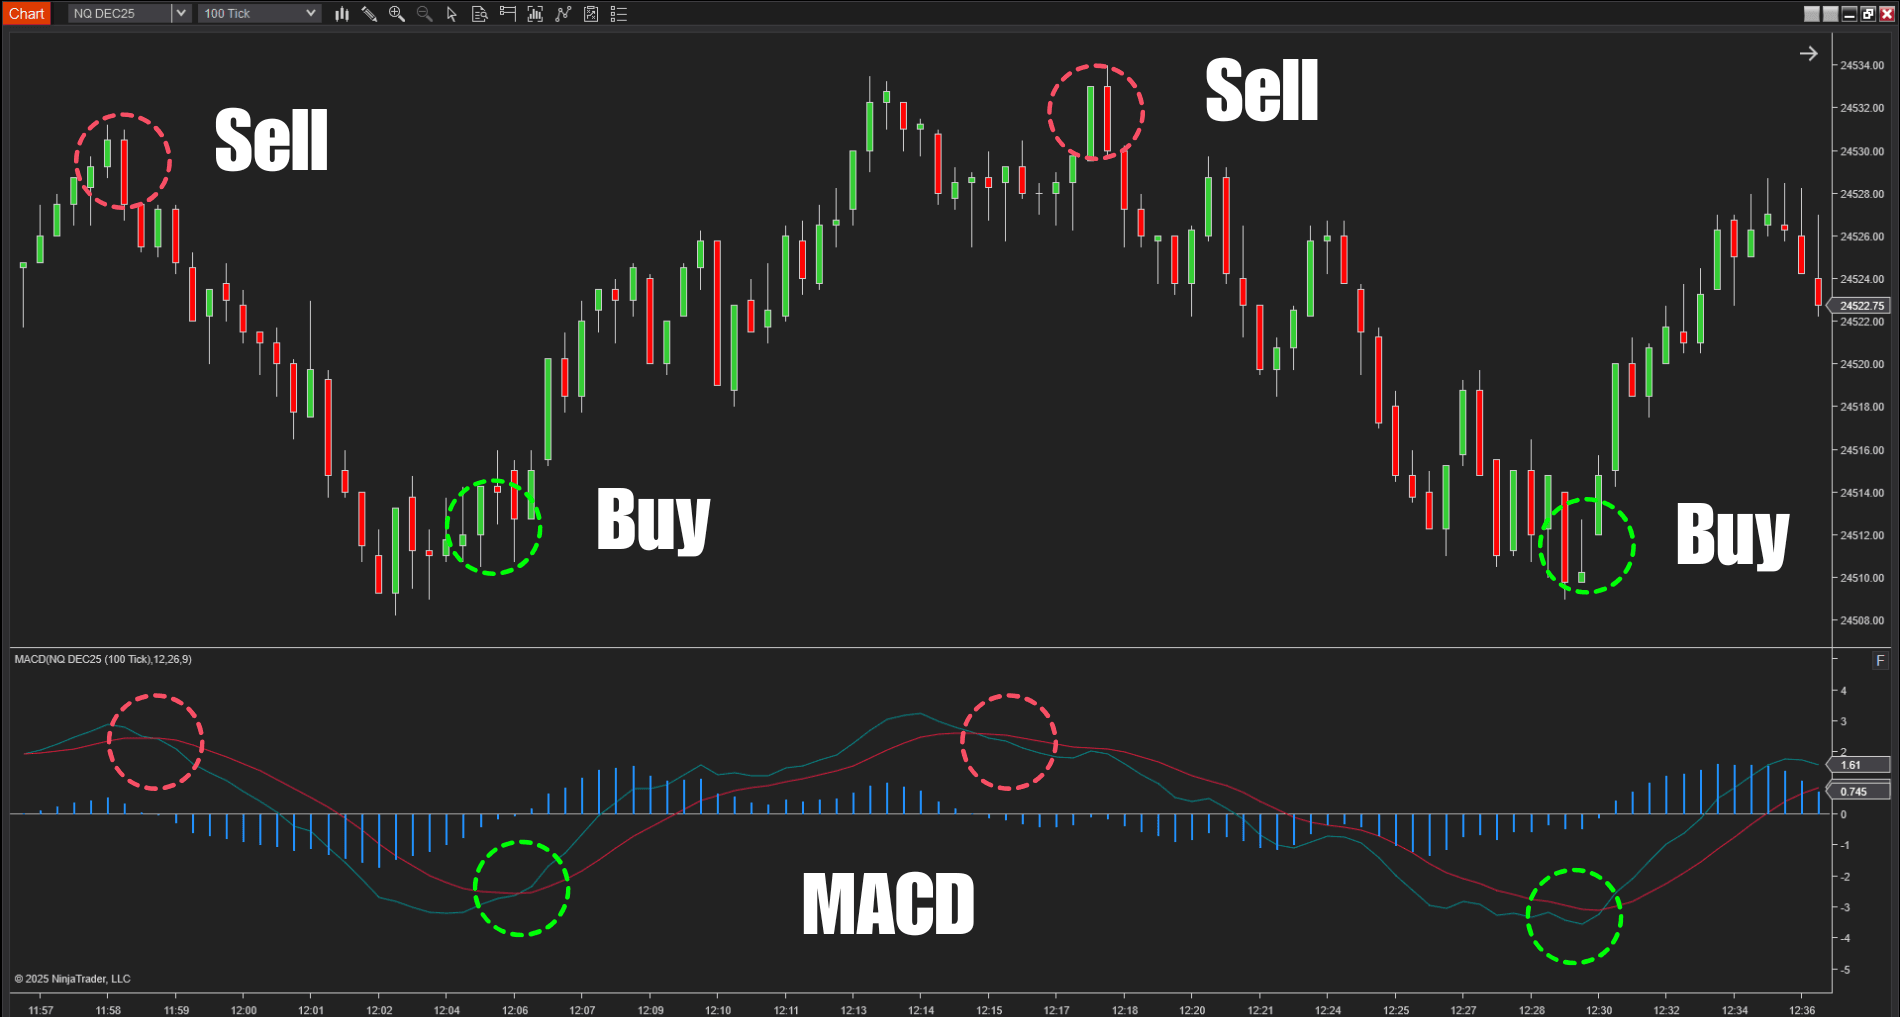
Many consider it a best trading signal indicator when paired with solid risk management and market context.
How to use
- Watch crossovers of the MACD and signal lines for bullish or bearish momentum.
- Read the histogram for strength; expanding bars often mean a trend is accelerating, while contracting bars can hint at a pullback.
- Combine with support/resistance or higher-timeframe analysis to filter noise.
For those wanting more precision, Impulse MACD Pro refines the classic formula with adaptive filters and multiple signal modes. It flags standard crossovers, subtle “Break” setups after consolidation, and decisive Zero-Cross momentum moves – delivering a clearer, faster read on emerging trends.
4. Ichimoku Cloud
Ichimoku Cloud is a multi-line indicator built to show trend direction, momentum, and dynamic support/resistance all in one chart. It projects future “clouds” (Kumo), uses lines like Tenkan-sen and Kijun-sen to assess short- and medium-term trends, and includes a lagging line (Chikou Span) for confirmation.
When price is above the cloud, the market is considered bullish; below the cloud, bearish; and if inside, likely range-bound or indecisive.
It shines in trending markets for early entries and clear support/resistance, but in sideways conditions its lines can flatten and cross, creating mixed signals. The multi-line setup can also feel complex for newcomers.
How to use
- Watch where price is relative to the cloud: above (bullish bias), below (bearish bias), or inside (neutral / uncertain).
- Monitor crossovers between Tenkan-sen and Kijun-sen, especially when they occur above or below the cloud – these tend to be stronger signals.
- Use the cloud’s thickness and shape: thick clouds often indicate strong resistance/support; thin or flat clouds suggest weak trend or consolidation.
- Follow Chikou Span (lagging line) to confirm price action relative to past price: helps avoid false trend entries.
Sky Fibomoku builds on this by adding dynamic Fibonacci retracement zones to the cloud. It highlights pullback areas where price meets golden-ratio levels while tracking trend direction, helping traders pinpoint entries with greater precision.
5. Fibonacci Retracement
Fibonacci retracement levels – typically 38.2 %, 50 %, and 61.8 % – help identify where price may pause or reverse during a trend pullback. Traders use these zones to plan entries, exits, and stop placements.
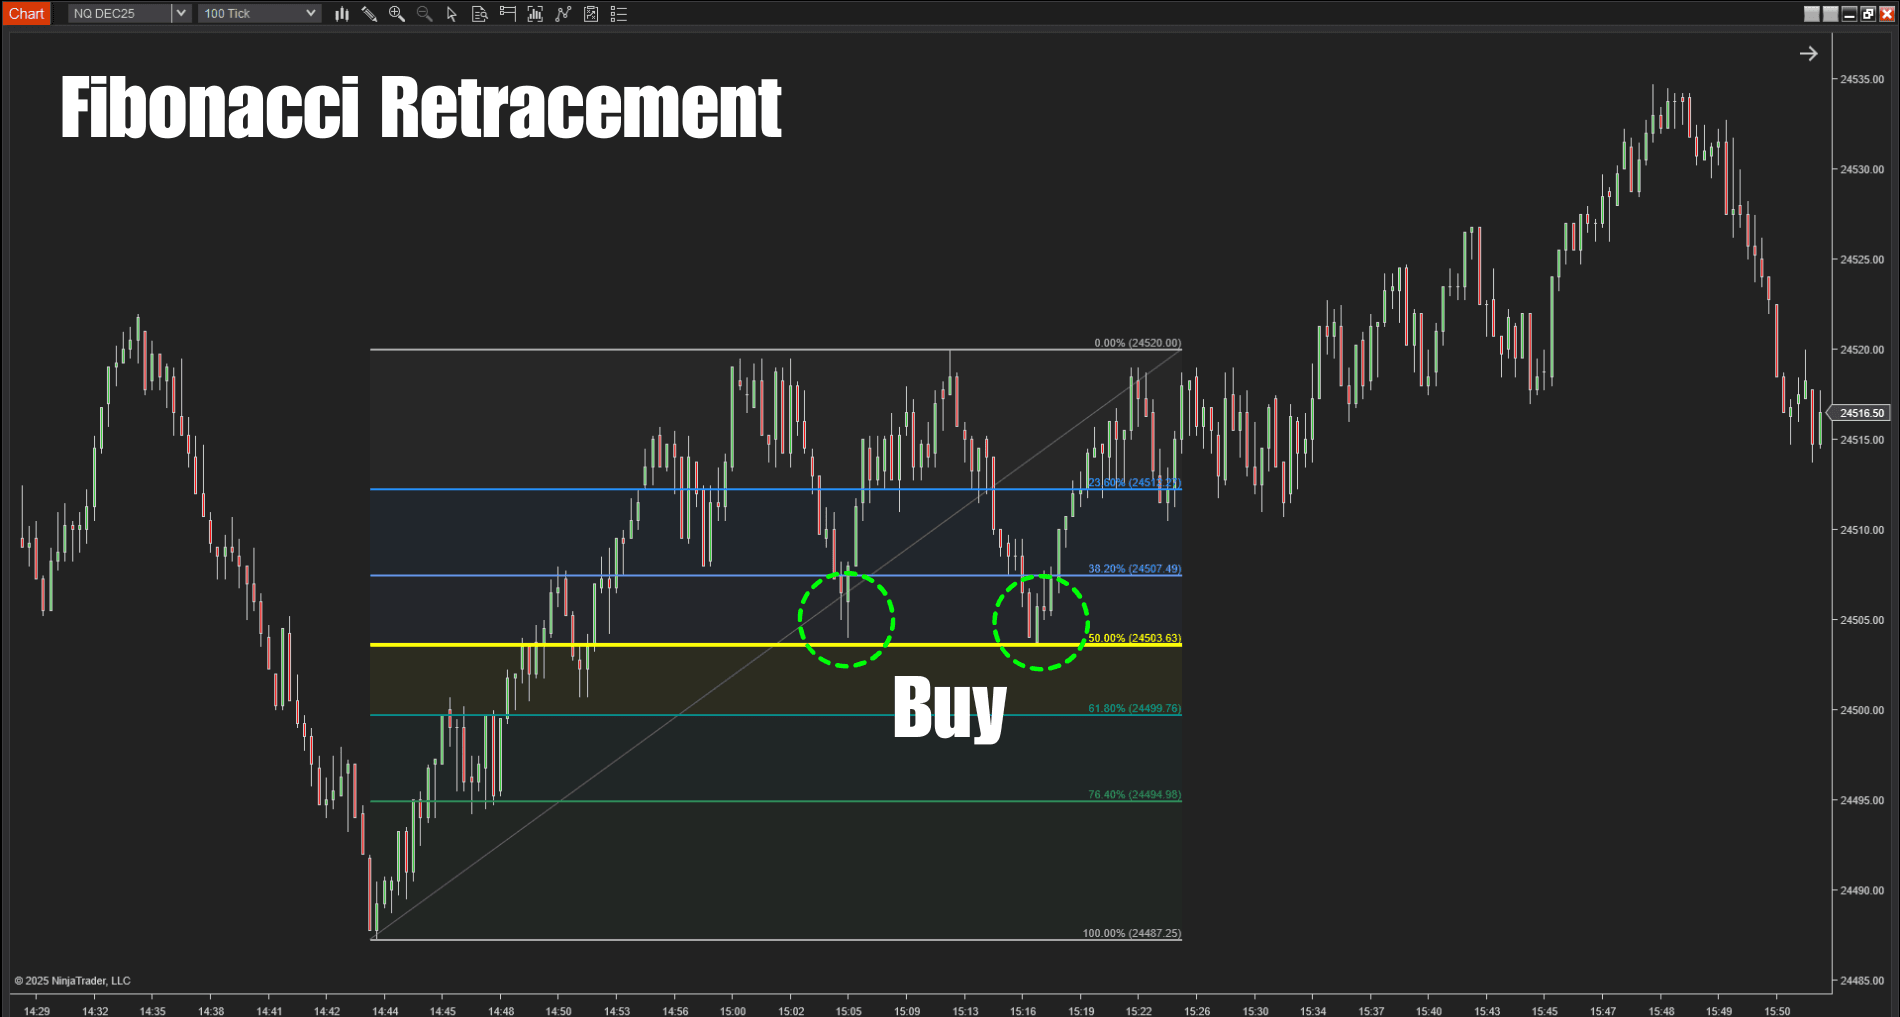
While Fibonacci on its own is powerful, pairing it with a best trading signal indicator such as a momentum or volume-based tool can sharpen entries and reduce false setups.
They work best when the market trends cleanly, offering clear swing highs and lows to measure from. In volatile or sideways conditions, price may hover around these levels without commitment, so confirmation from other indicators is important.
How to use
- Draw Fib levels between a recent swing high and low to spot potential support or resistance.
- Look for reversal candlesticks or momentum shifts as price tests these levels.
- Combine with trend or volume tools to confirm that the larger market bias supports the setup.
Zephyrus Force builds on the classic method by pairing adaptive Fibonacci retracement with dual cloud bands. It highlights high-probability pullback areas, maps dynamic support and resistance, and offers trailing-stop guidance – giving traders a more flexible and visually intuitive way to trade Fib levels.
6. Volume
Volume tracks how many contracts or shares trade in a period, showing the strength behind price moves. Rising price with rising volume suggests conviction, while weak volume can flag a fragile trend – making volume a core signal for traders.
Volume confirms breakouts and trend strength and helps spot divergences when price makes new highs but participation fades. However, it doesn’t reveal which side is in control and can be noisy during low-liquidity or news-driven sessions, so it works best alongside price action or other indicators.
How to use
- Compare current volume to a recent average to confirm breakouts.
- Look for price–volume alignment: strong trends show rising price and volume together.
- Watch for divergences such as higher highs on falling volume.
- Pair with trendlines or momentum tools to filter false signals.
Quantum Vol-Delta builds on basic volume by showing buy/sell dominance per candle and adapting delta thresholds automatically to market conditions. Its smart filters and average-volume metrics deliver clearer, more reliable signals across all sessions with minimal manual tuning.
How to combine multiple indicators for stronger signals
No single indicator captures the full market picture. Pairing complementary tools can confirm trends, reduce false signals, and improve timing. Here are three practical combos that show how different indicators can work together for higher-confidence trades:
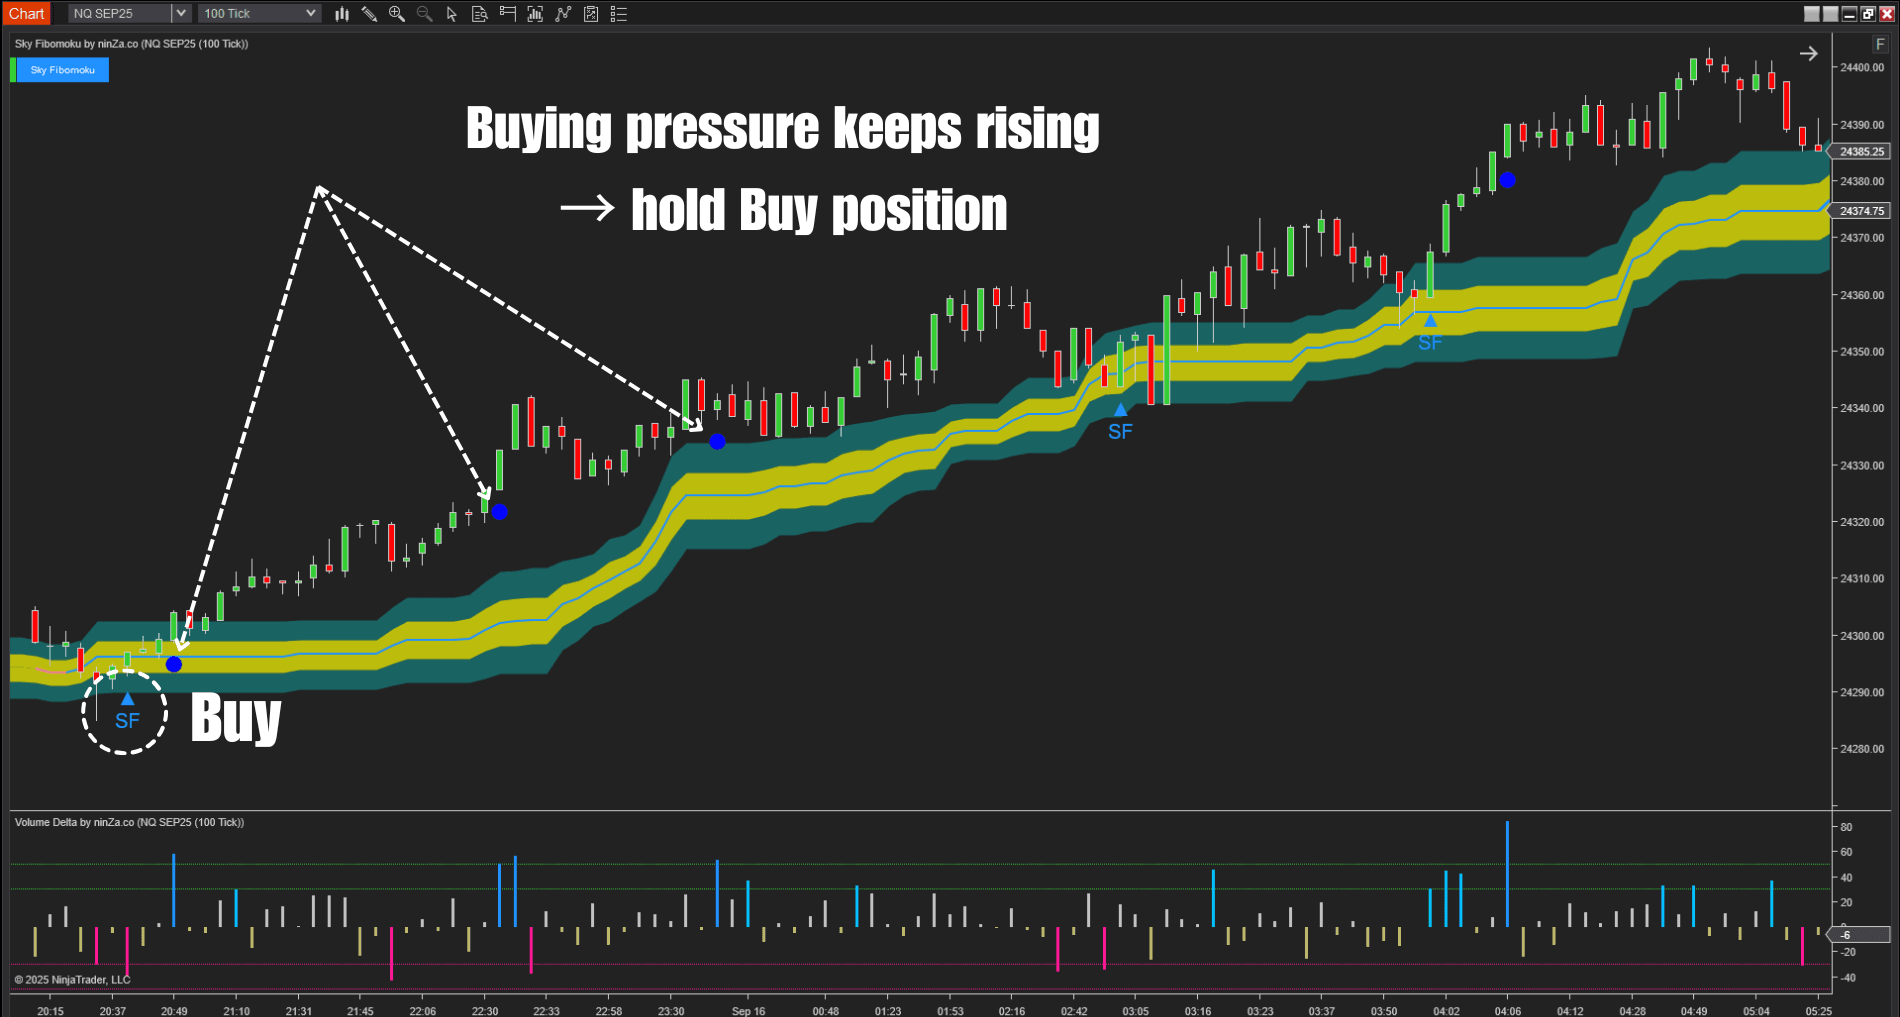
1. Sky Fibomoku + Volume Delta
Sky Fibomoku provides primary buy or sell signals through its Fibonacci–Ichimoku framework. Volume Delta then confirms the strength behind those signals: strong positive delta supports a buy, while strong negative delta reinforces a sell.
- Stay in trades longer: If you enter a long and subsequent candles show consistently positive delta, the buying pressure suggests holding the position.
- Exit early when pressure shifts: If clusters of negative delta appear after a long entry, consider closing before other market cues turn.
2. Sumo Pullback$ + Noble Cloud
This pair blends precise pullback entries with trend confirmation. Sumo Pullback$ spots high-probability retracements in trending markets, while Noble Cloud defines the larger trend and filters out weak pullbacks.
Using both helps traders wait for a clear pullback signal that aligns with the prevailing trend, improving entry quality and reducing whipsaws.
3. Bollinger Reversal Pro + Trendline Autom@ton
Bollinger Reversal Pro flags potential reversals at key volatility extremes. Trendline Autom@ton checks whether price soon breaks a nearby trendline, adding a structural confirmation.
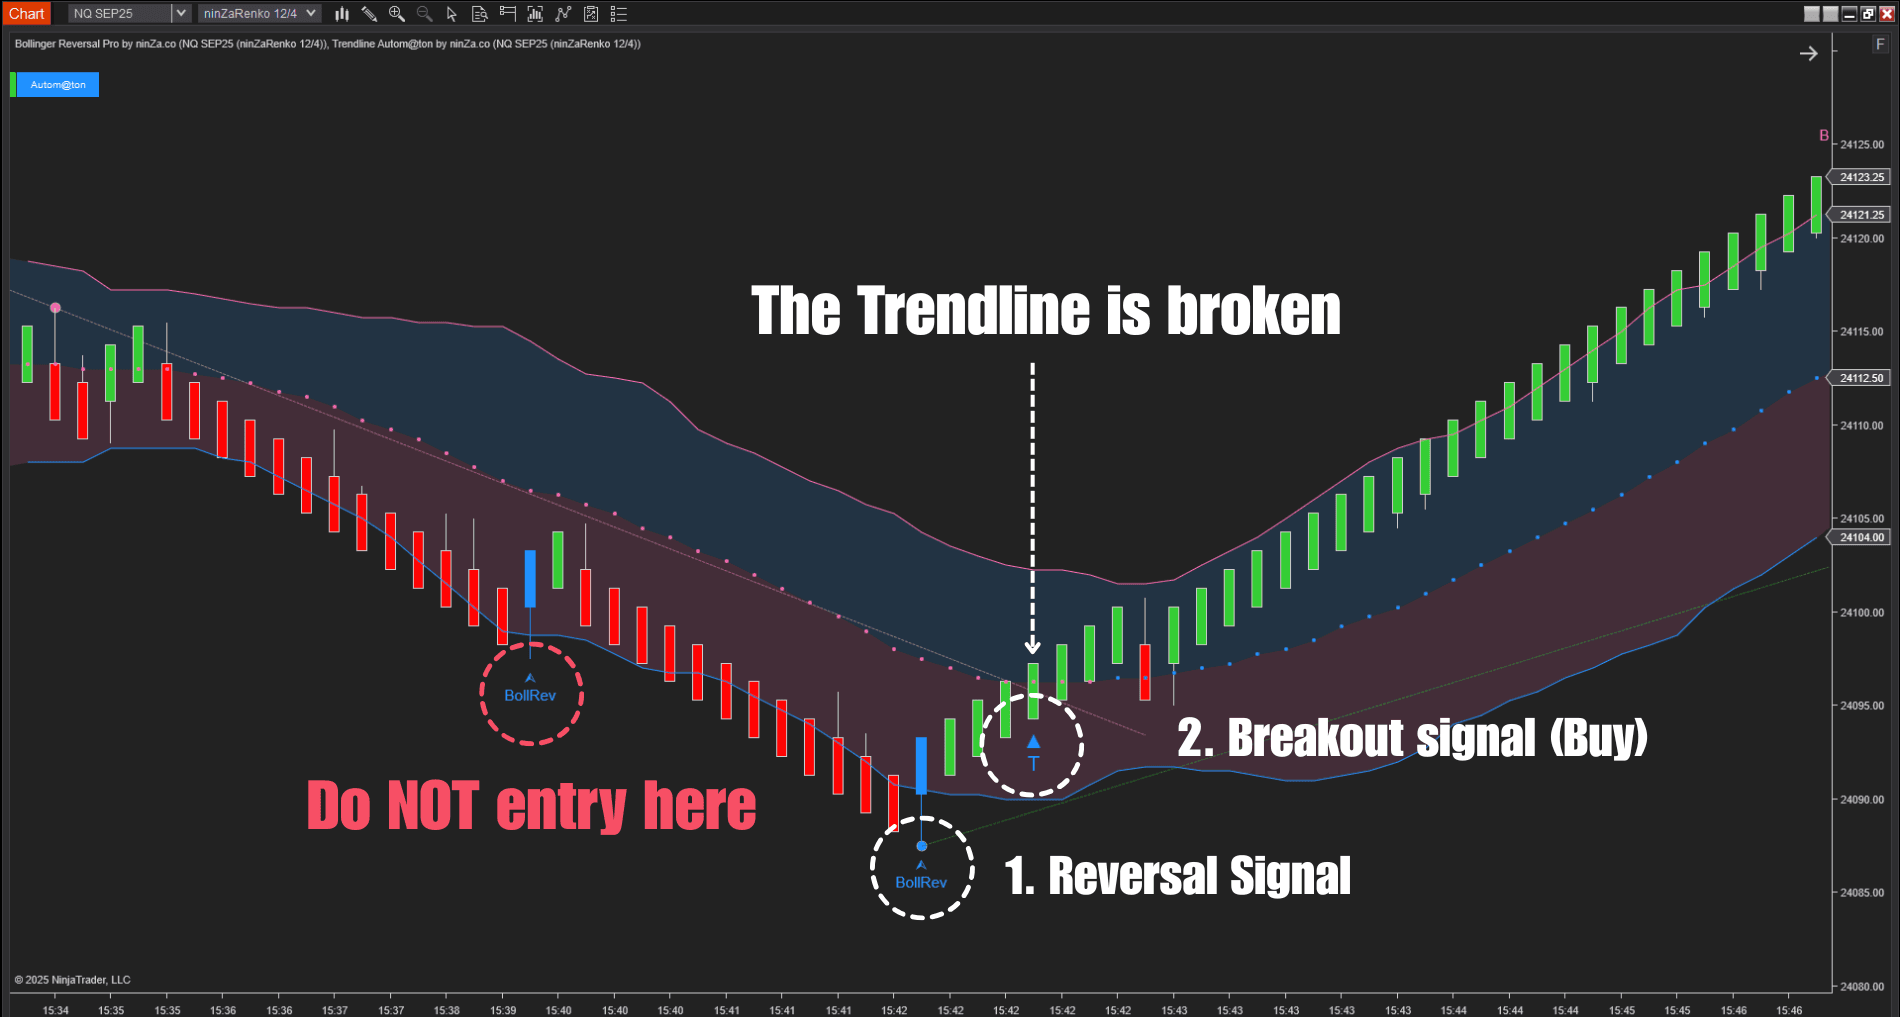
A reversal signal followed quickly by a trendline break indicates stronger momentum, helping traders differentiate meaningful reversals from short-lived bounces.
Key takeaways
- Pair indicators with different strengths – trend, momentum, volume – to avoid redundant signals.
- Always backtest combos on historical data and practice in a demo environment before trading live.
- Use risk management rules so that confirmation from multiple tools complements, rather than replaces, solid trade discipline.
Pro tips & common mistakes in signal-based trading
Trading success isn’t just about picking the “perfect” indicator – it’s about how you manage risk and evaluate performance over time. Whether you’re testing a best trading signal indicator or any other tool, 2 key areas often overlooked are capital management and the overemphasis on win rate.
Focus on capital management, not just entries
Strong money management protects your account through inevitable losing streaks. Risking a small, fixed percentage per trade – such as 1–2% of your account – helps you survive market swings and compound gains steadily.
A structured capital plan, like allocating risk based on account tiers or using position-sizing formulas, keeps losses from spiraling even when signals misfire.
Win rate isn’t everything
A high percentage of winning trades can look impressive but means little if the average loss is larger than the average win. Many profitable strategies succeed with win rates under 50% because they let winners run and cut losses quickly.
Instead of chasing a lofty win rate, track metrics like risk-reward ratio, expectancy, and maximum drawdown to judge a system’s true edge.
Practical tips
- Set a maximum loss per day or week to prevent emotional decision-making.
- Review trades by expectancy: (average win × win rate) − (average loss × loss rate).
- Combine clear stop-loss rules with indicator signals to maintain discipline.
By prioritizing sound capital management and realistic performance metrics, traders give any indicator − no matter how advanced − a much stronger chance to deliver consistent, long-term results.
Download ~ 40 FREE indicators & reach more useful resources !!!
ninZa.co Indicators
0 online
![]()
ninZa.co is an official member of NinjaTrader Ecosystem together with 600+ industry-leading professionals that provide traders with quality trading products & services.


even more payment methods
Quick Links
Instructions
Support
Resources & Information
© Copyright 2026 All Rights Reserved

![]()

Because software products may be copied and stored easily, we will NOT issue refunds of any kind. ALL SALES ARE FINAL & NON-REFUNDABLE!
Futures, foreign currency, and options trading contains substantial risk and is not for every investor. An investor could potentially lose all or more than the initial investment. Risk capital is money that can be lost without jeopardizing one's financial security or lifestyle. Only risk capital should be used for trading and only those with sufficient risk capital should consider trading. Past performance is not necessarily indicative of future results.
Hypothetical performance results have many inherent limitations, some of which are described below. No representation is being made that any account will or is likely to achieve profits or losses similar to those shown; in fact, there are frequently sharp differences between hypothetical performance results and the actual results subsequently achieved by any particular trading program. One of the limitations of hypothetical performance results is that they are generally prepared with the benefit of hindsight. In addition, hypothetical trading does not involve financial risk, and no hypothetical trading record can completely account for the impact of financial risk of actual trading. For example, the ability to withstand losses or to adhere to a particular trading program in spite of trading losses are material points which can also adversely affect actual trading results. There are numerous other factors related to the markets in general or to the implementation of any specific trading program which cannot be fully accounted for in the preparation of hypothetical performance results and all which can adversely affect trading results.
NinjaTrader® is a registered trademark of NinjaTrader Group, LLC. No NinjaTrader company has any affiliation with the owner, developer, or provider of the products or services described herein, or any interest, ownership or otherwise, in any such product or service, or endorses, recommends or approves any such product or service.