
![[Auction Δxis] A comprehensive overview of Auction Δxis](https://forestcms.nyc3.digitaloceanspaces.com/media/small_Thumbnail New release Auction ∆XIS_1784002540029.jpg)
_1784001871922.jpg)
_1783425884112.jpg)
![[July Exclusive] Liberty Edge Bundle](https://forestcms.nyc3.digitaloceanspaces.com/media/small_liberty-edge-bundle-hdhdh_1783139262484.png)
![[AbsP] MEO #92: ICT PhantomTrace + Solar Wave](/_next/image?url=https%3A%2F%2Fforestcms.nyc3.digitaloceanspaces.com%2Fmedia%2Fmedium_solar-ict-hdhd_1784391284855.png&w=1920&q=75)
[08 Jul] Auction ∆xis: Pure Intraday Support & Resistance - Explore solution
[25 Jun] Captain Optimus Strong v2: Trader feedback shaped this upgrade - Explore solution
[22 Jun] Highway Fractal Zone: Support & Resistance needs more than a swing - Explore solution
[12 Jun] ICT PhantomTrace: Why most ICT traders keep falling short - Explore solution
[03 Jun] BigTrade Sweep: Detecting Big Trades in every candle - Explore solution
[08 May] New Horizon: A new standard in intraday automated trading ☀️ - Explore solution
Product Description
Identify liquidity-driven trend opportunities in real time – with ICT structure and lag-minimized trend confirmation
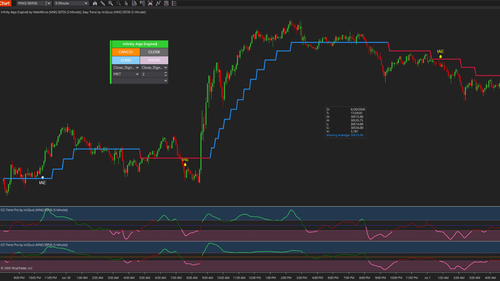
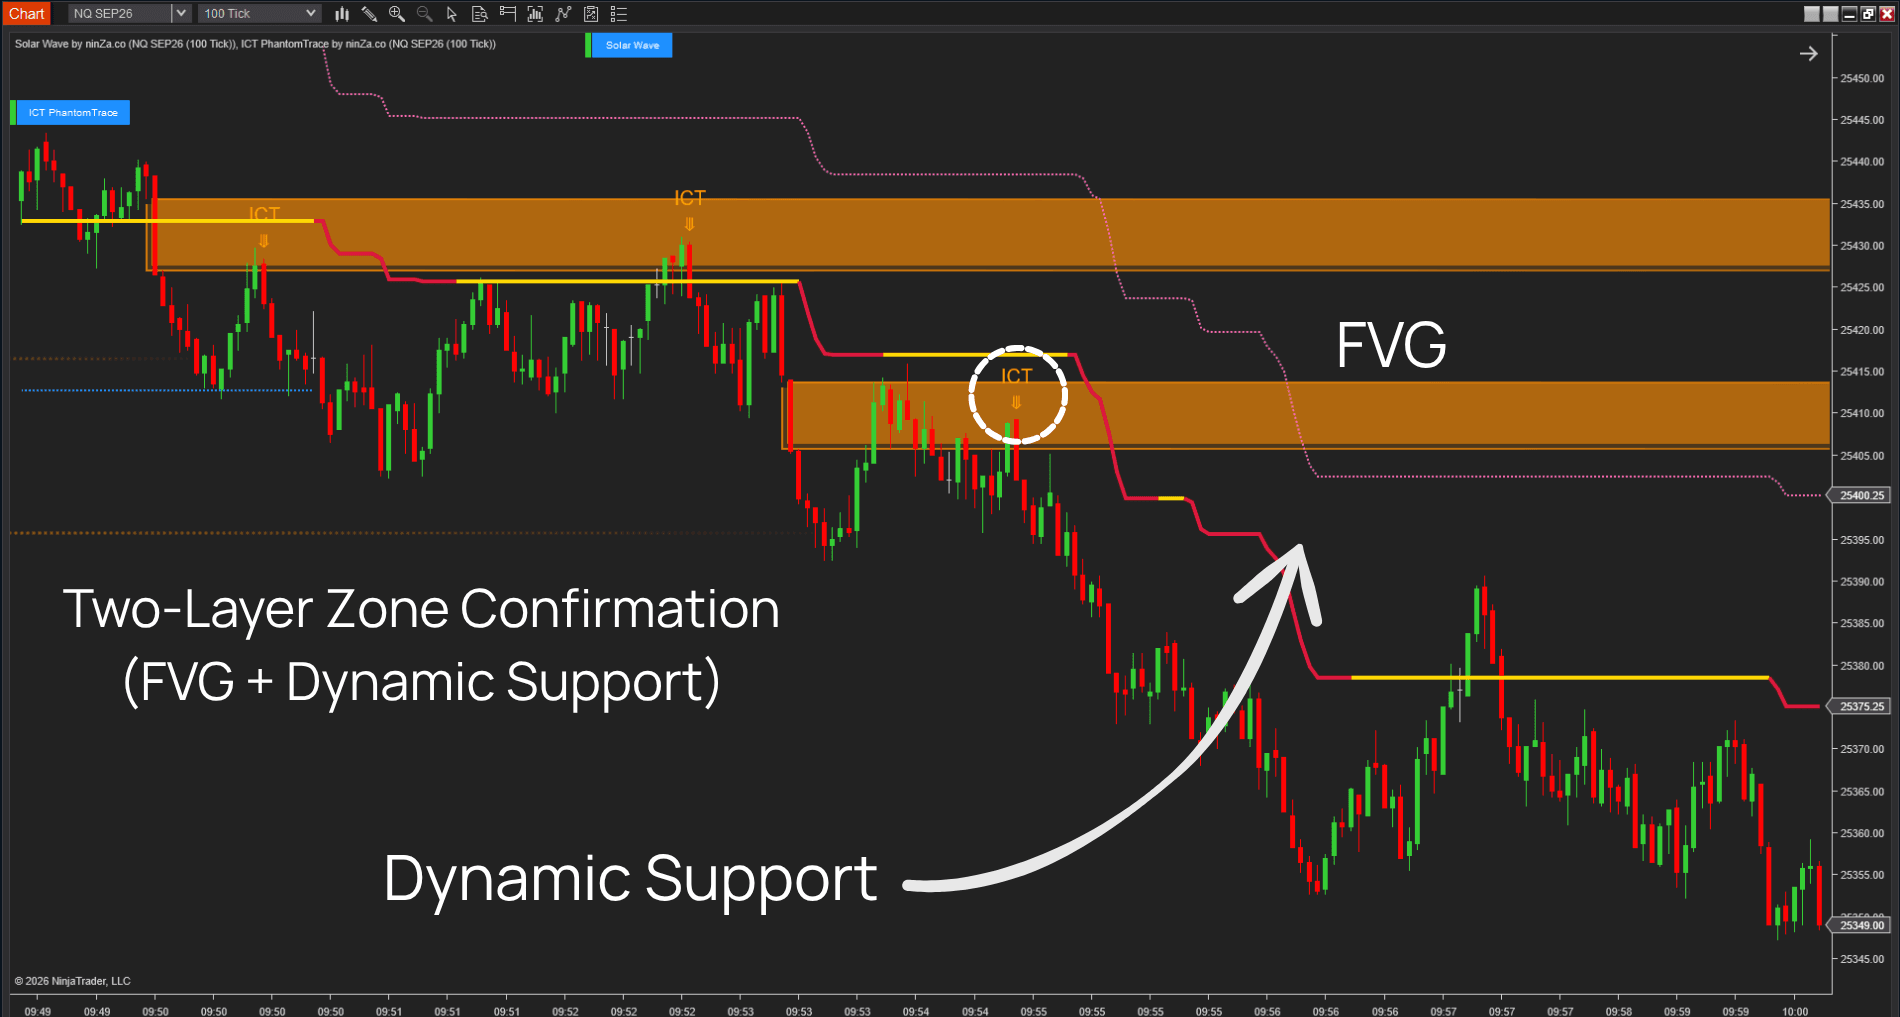
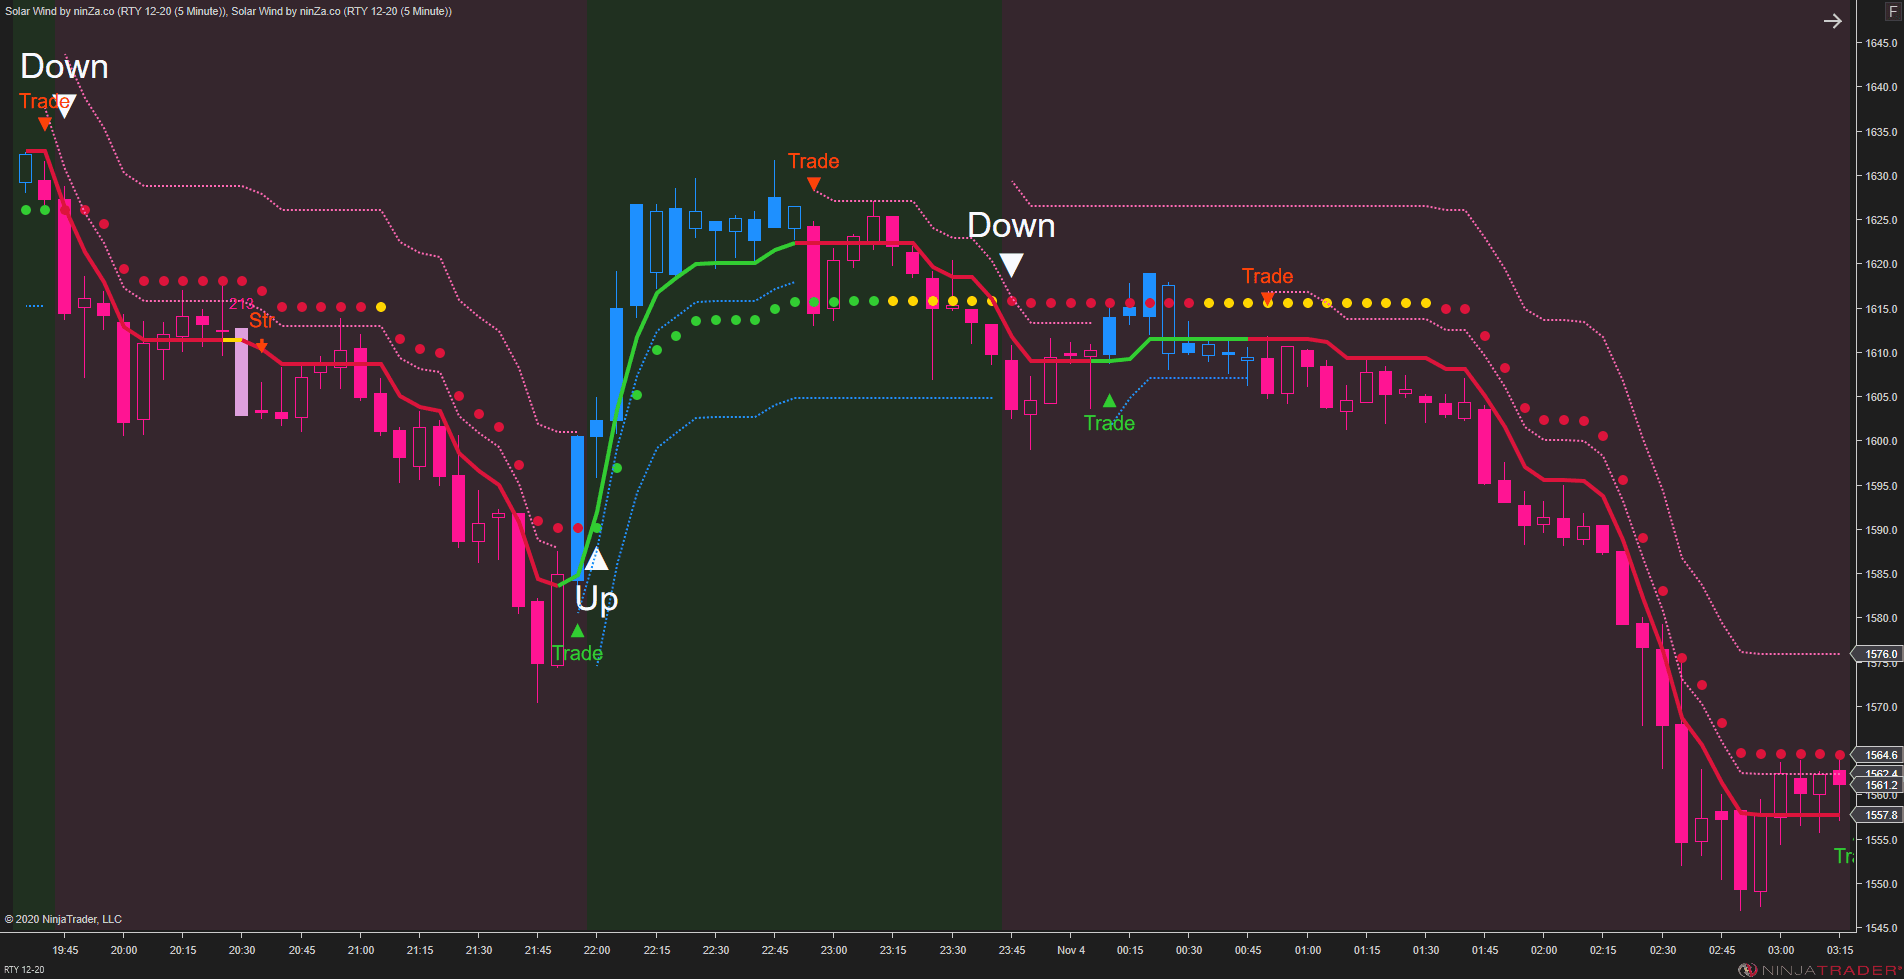
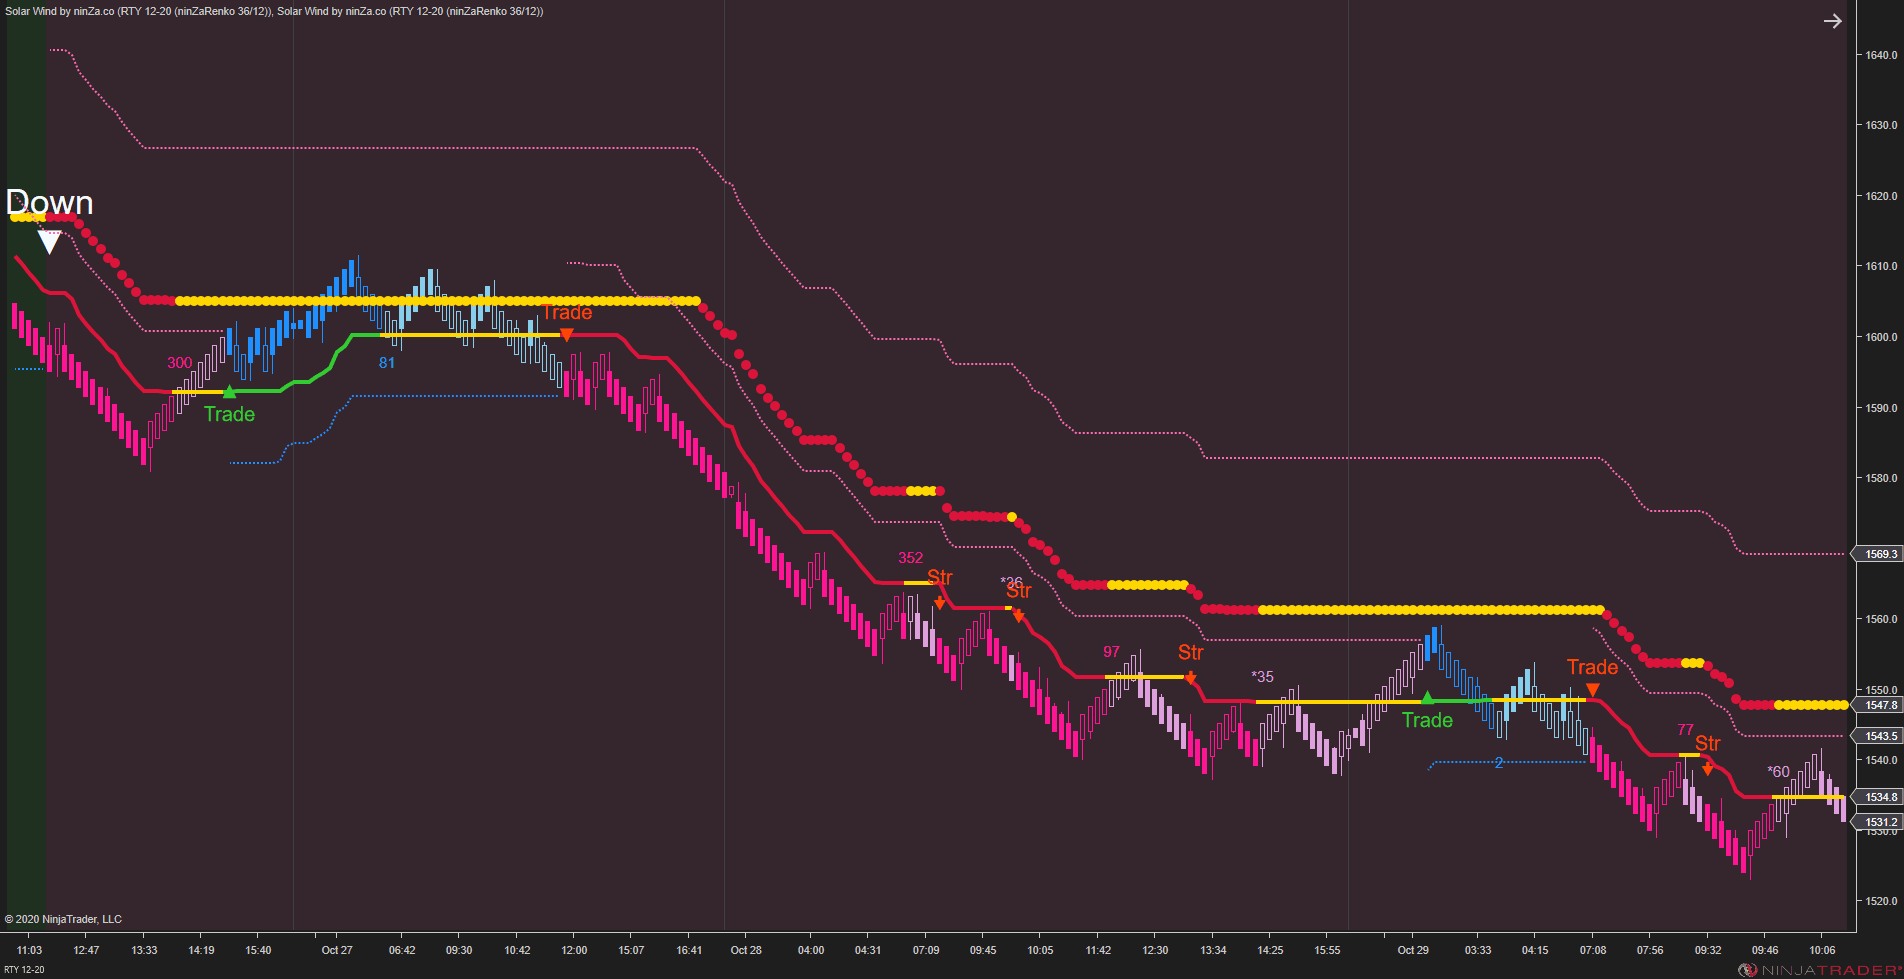
ICT PhantomTrace reveals whether liquidity is transitioning or continuing toward its next objective. Solar Wave then evaluates the direction and strength of the resulting trend, helping you identify relevant pullbacks and manage the position as the move develops.
Together, they provide a clearer path from market context to execution and trade management.
A valid market event is not always a complete trade opportunity
A Market Structure Shift may appear without meaningful continuation.
A Fair Value Gap may form without supporting the market’s broader liquidity objective.
A pullback may look attractive even as trend strength begins to weaken.
Each event may be useful, but evaluating it independently creates a fragmented process. Traders still need to determine:
- Where has liquidity been collected?
- Is order flow transitioning or continuing?
- Where is price likely seeking liquidity next?
- Does the resulting move have sufficient trend strength?
- Is the pullback still aligned with the active market context?
The challenge is not identifying more signals. It is connecting liquidity behavior, trend strength, entry timing, and trade management within one decision process.
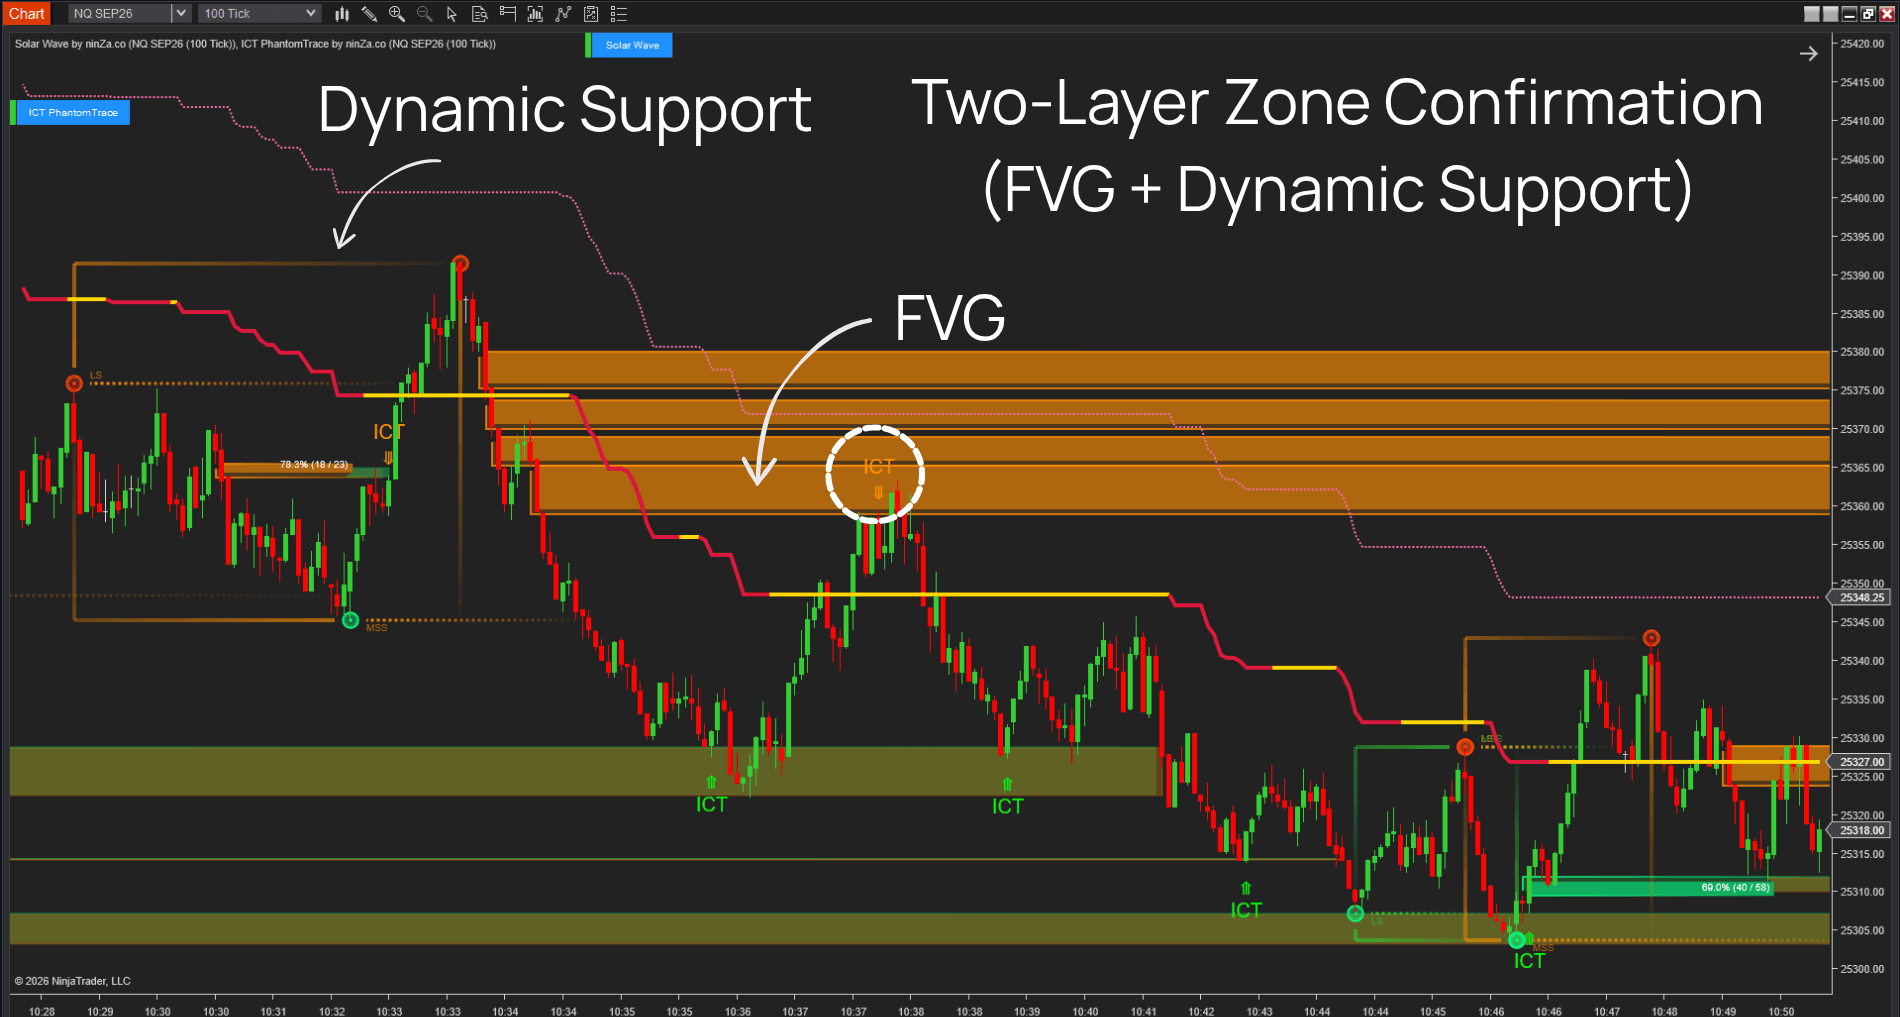
From liquidity context to trend execution
01. Understand the liquidity process
ICT PhantomTrace connects core ICT concepts into 2 structured market behaviors.
Liquidity Transition
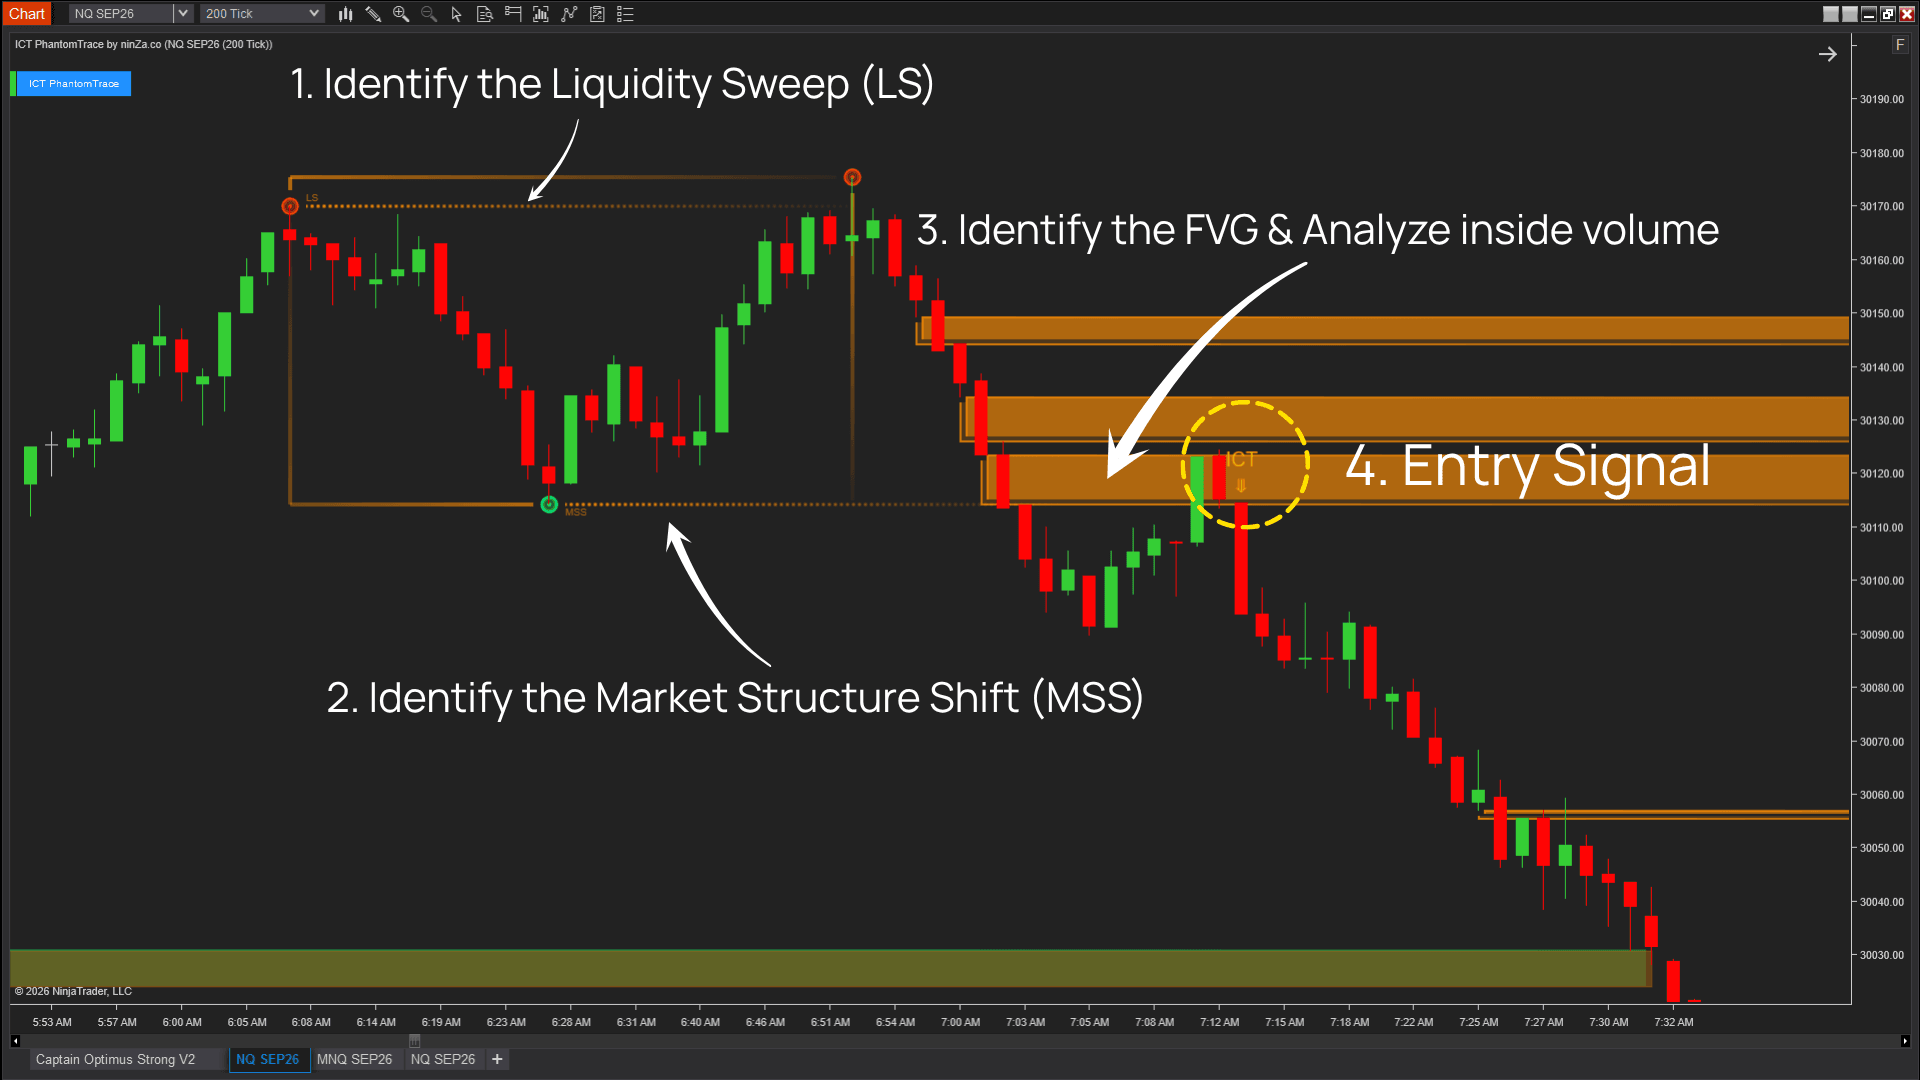
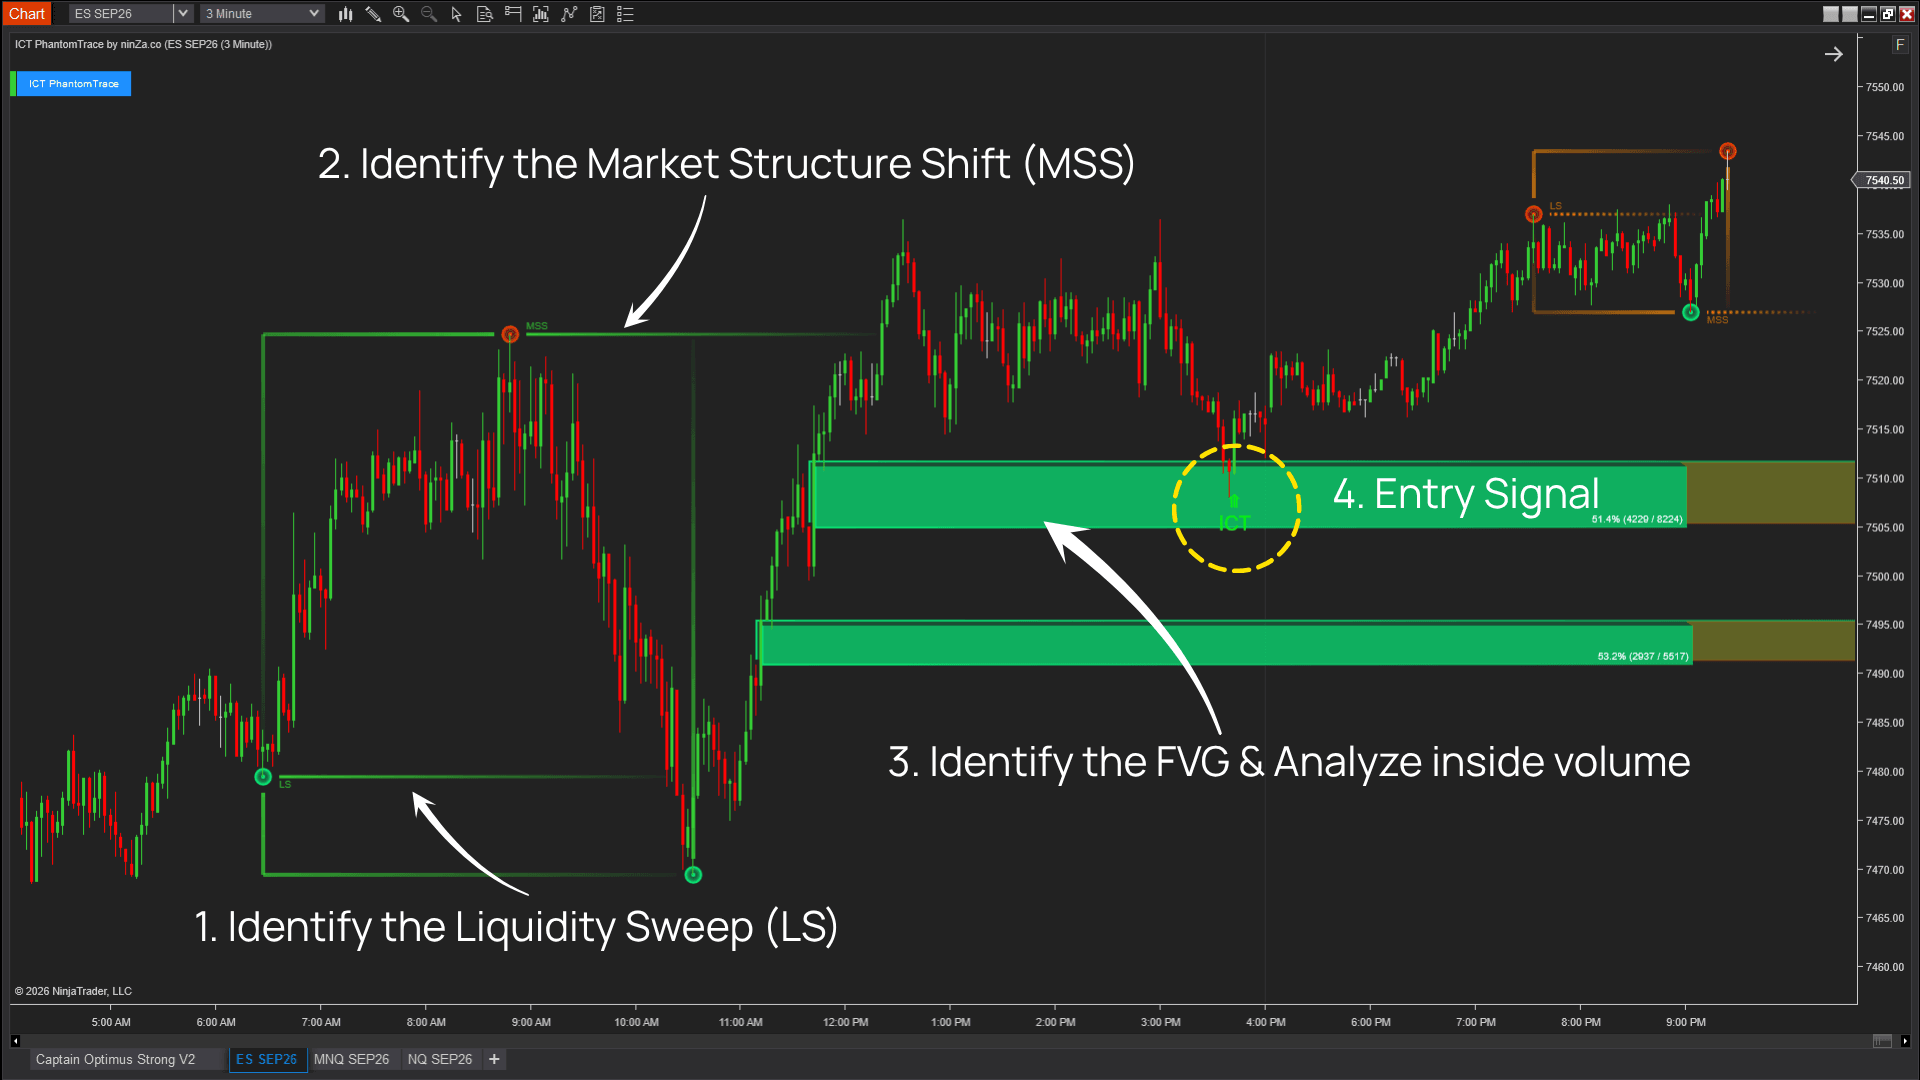
Stop Run → Market Structure Shift → Fair Value Gap → FVG Retracement → Reaction Signal
This sequence helps identify when liquidity has been taken and order flow may be beginning to shift.
Liquidity Continuation
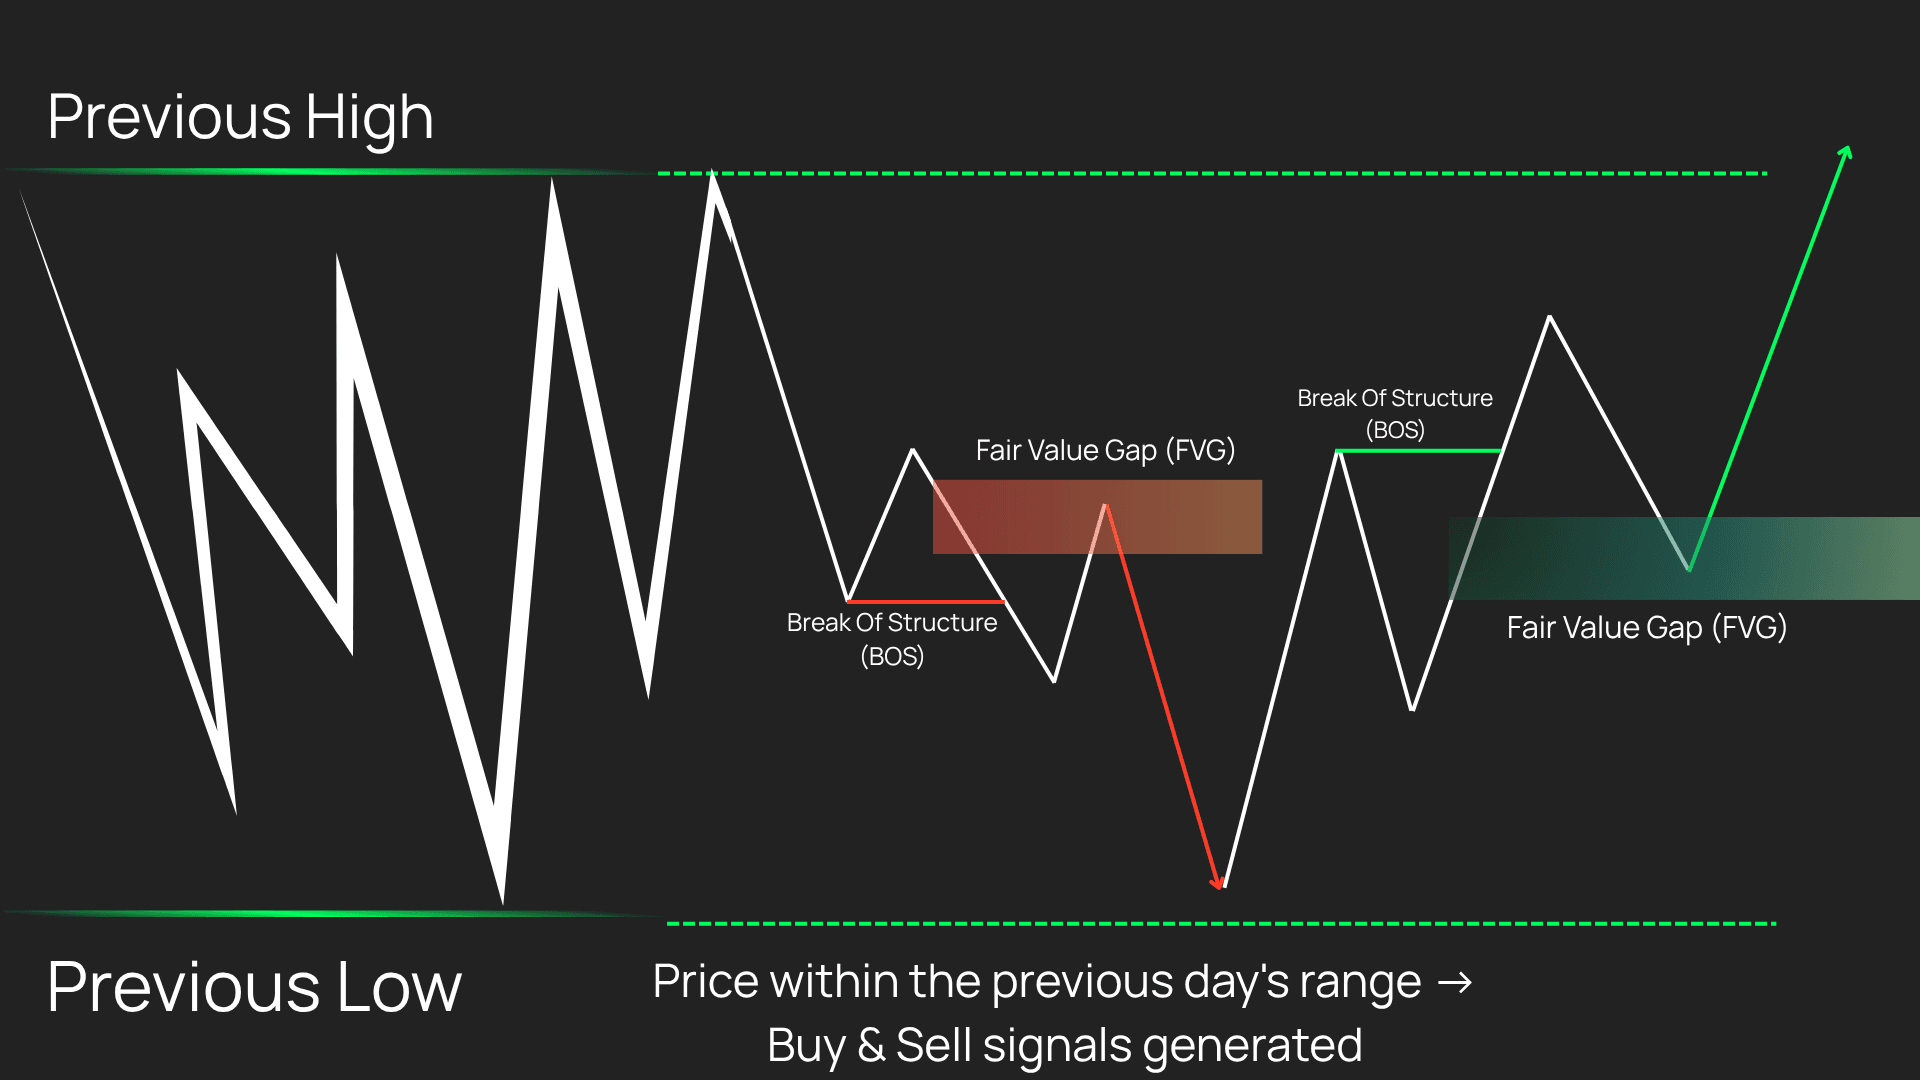
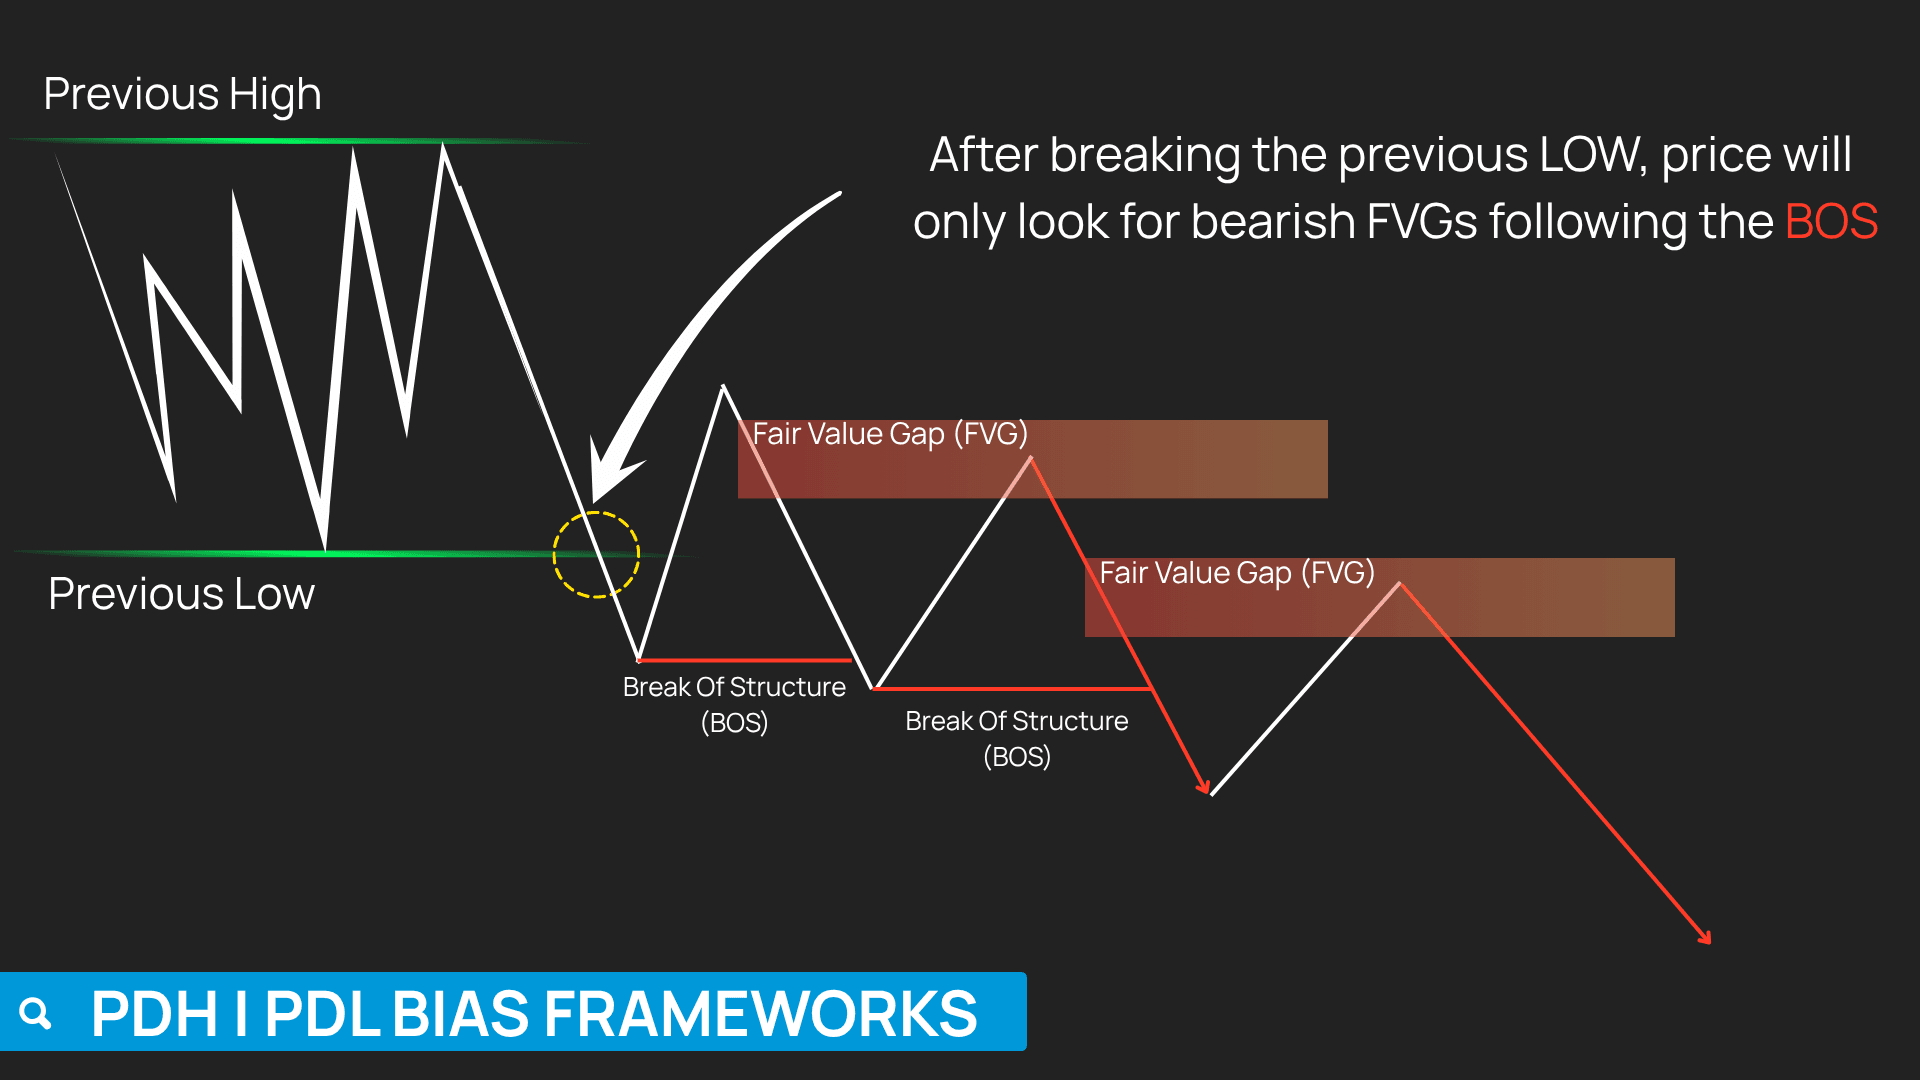
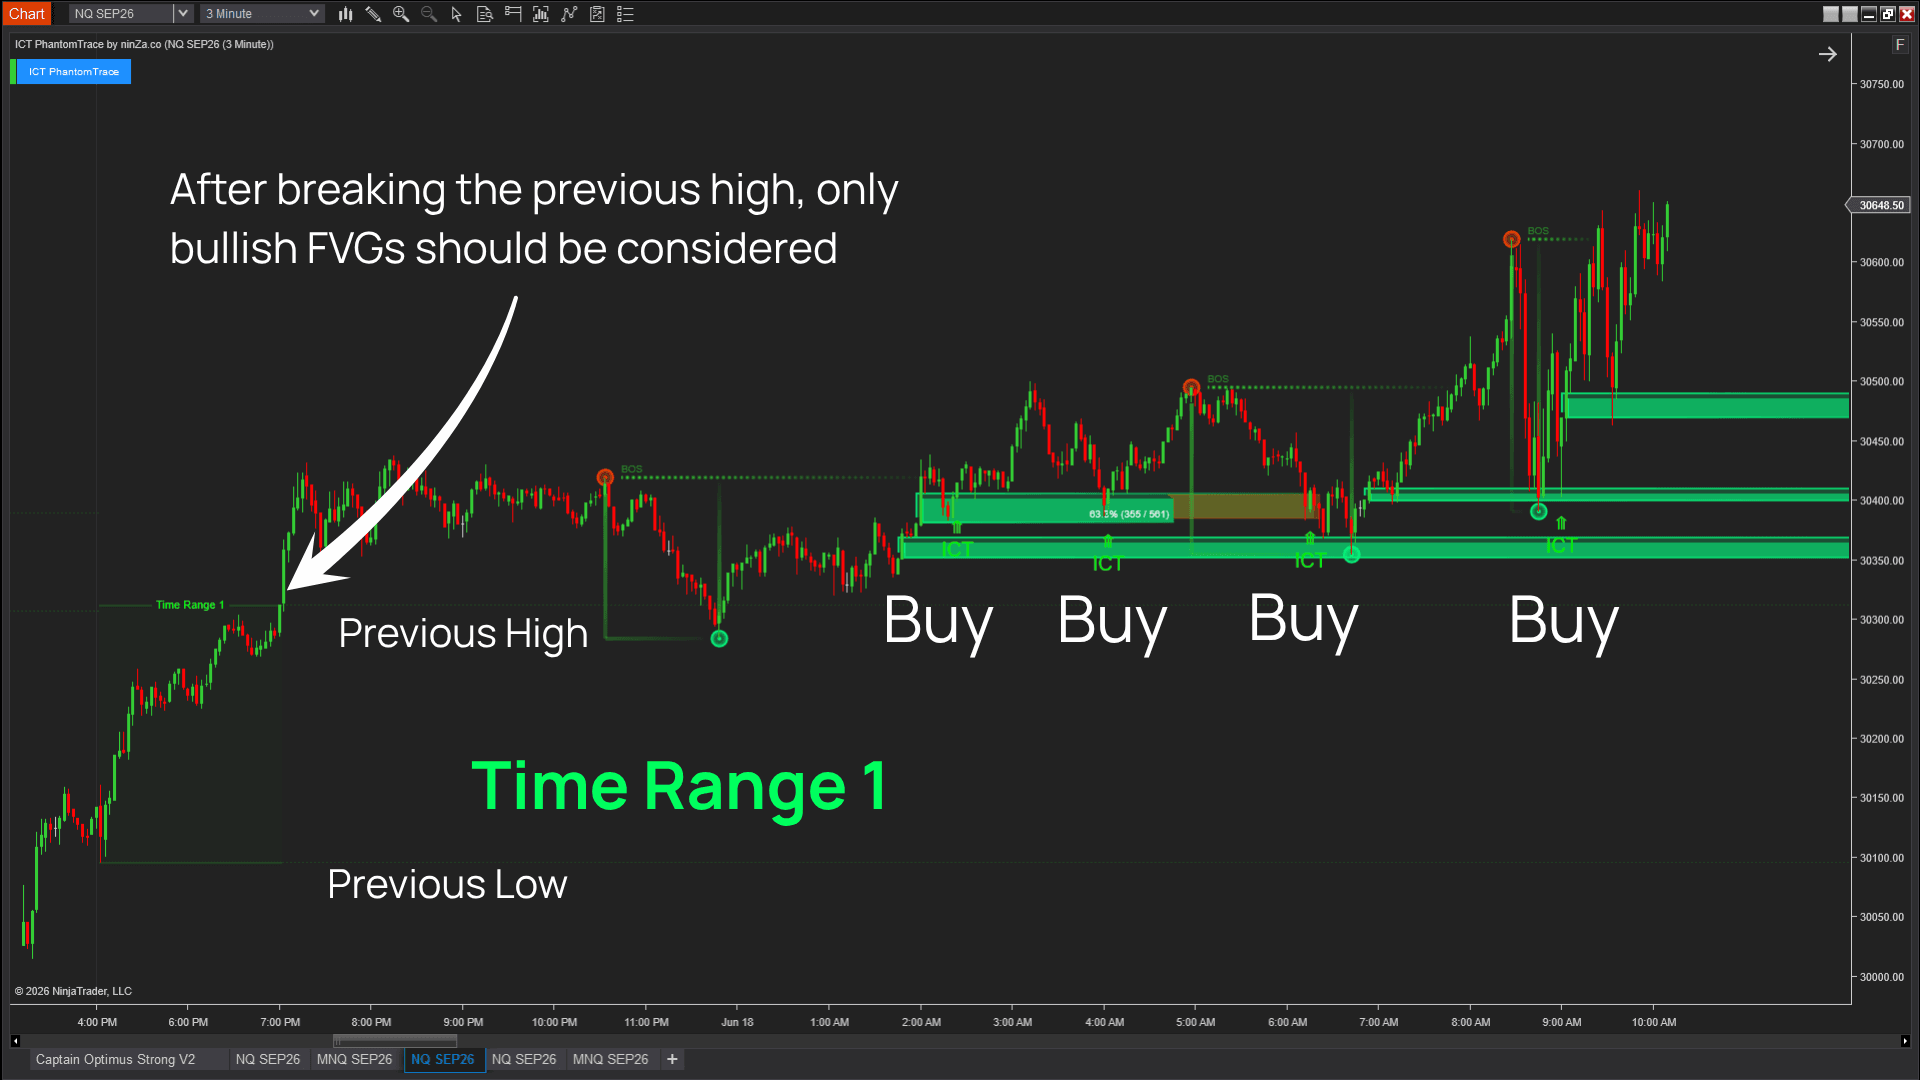
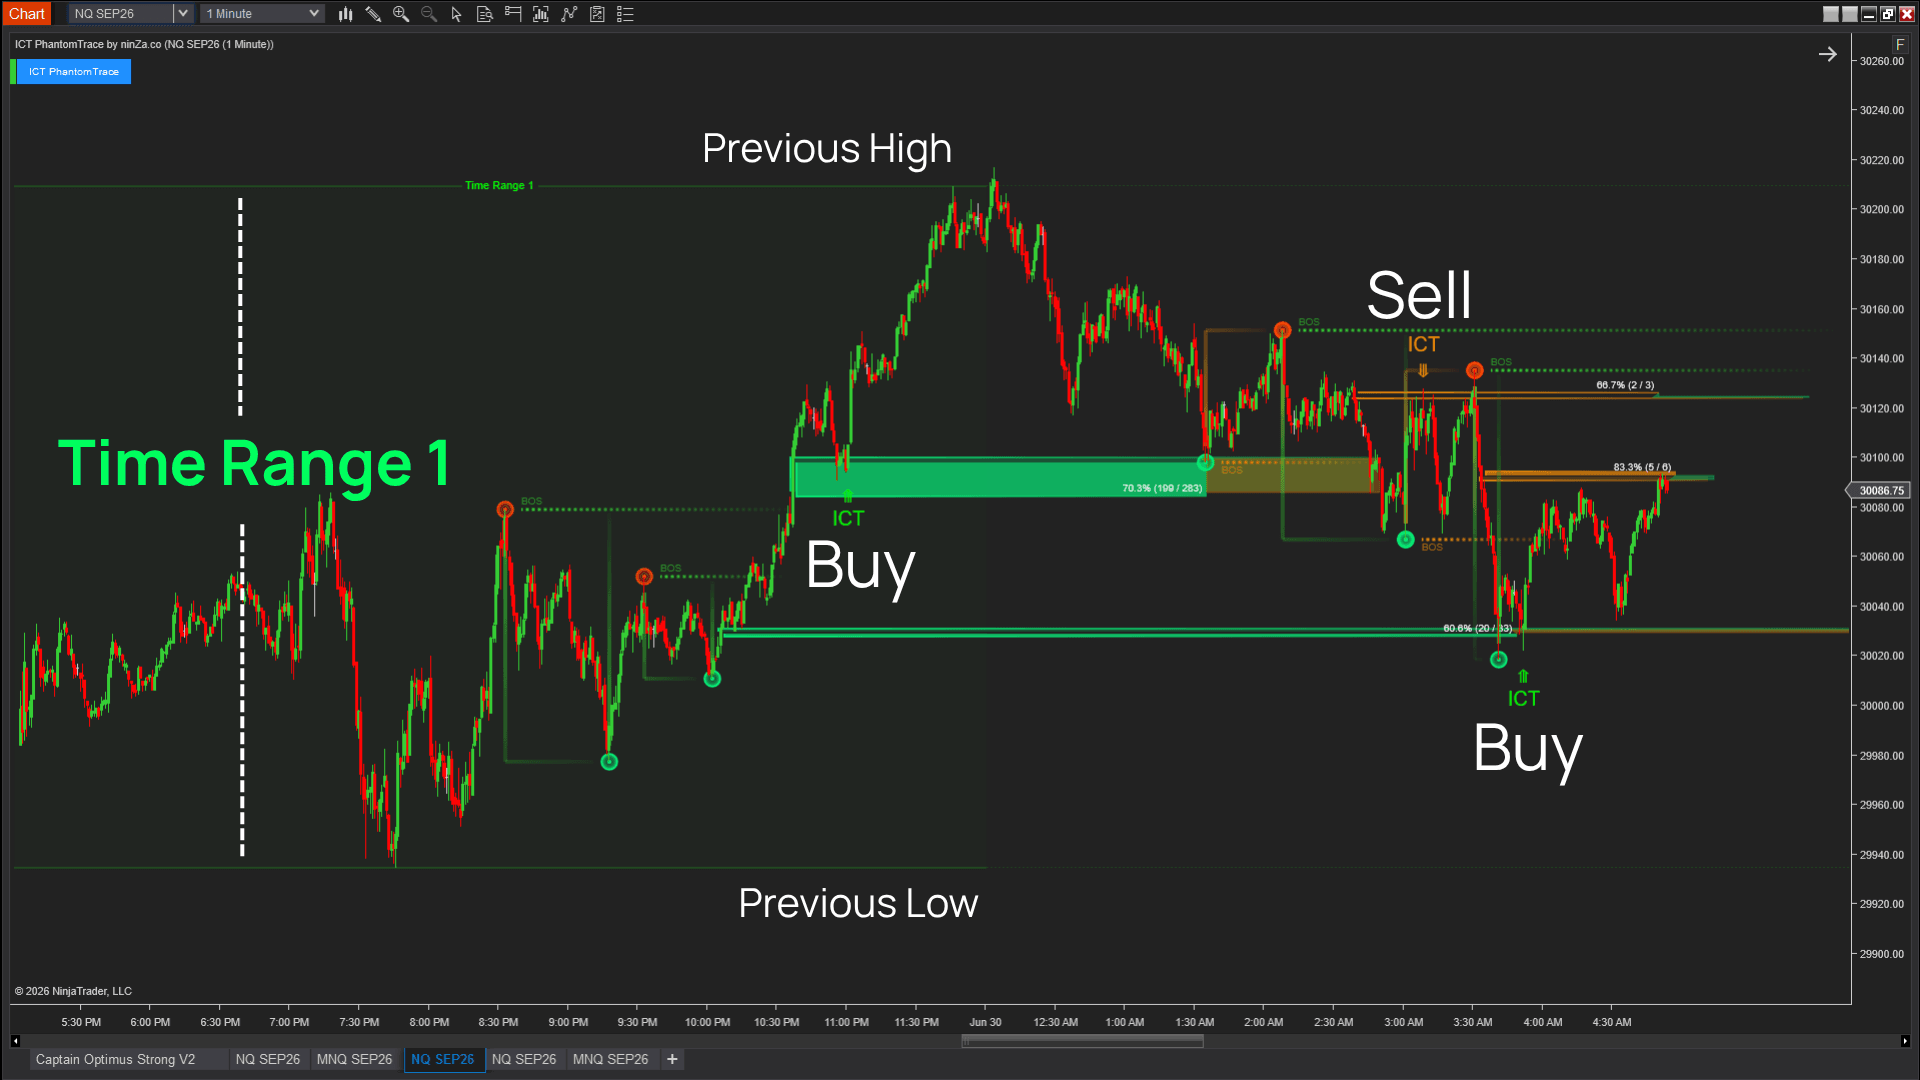
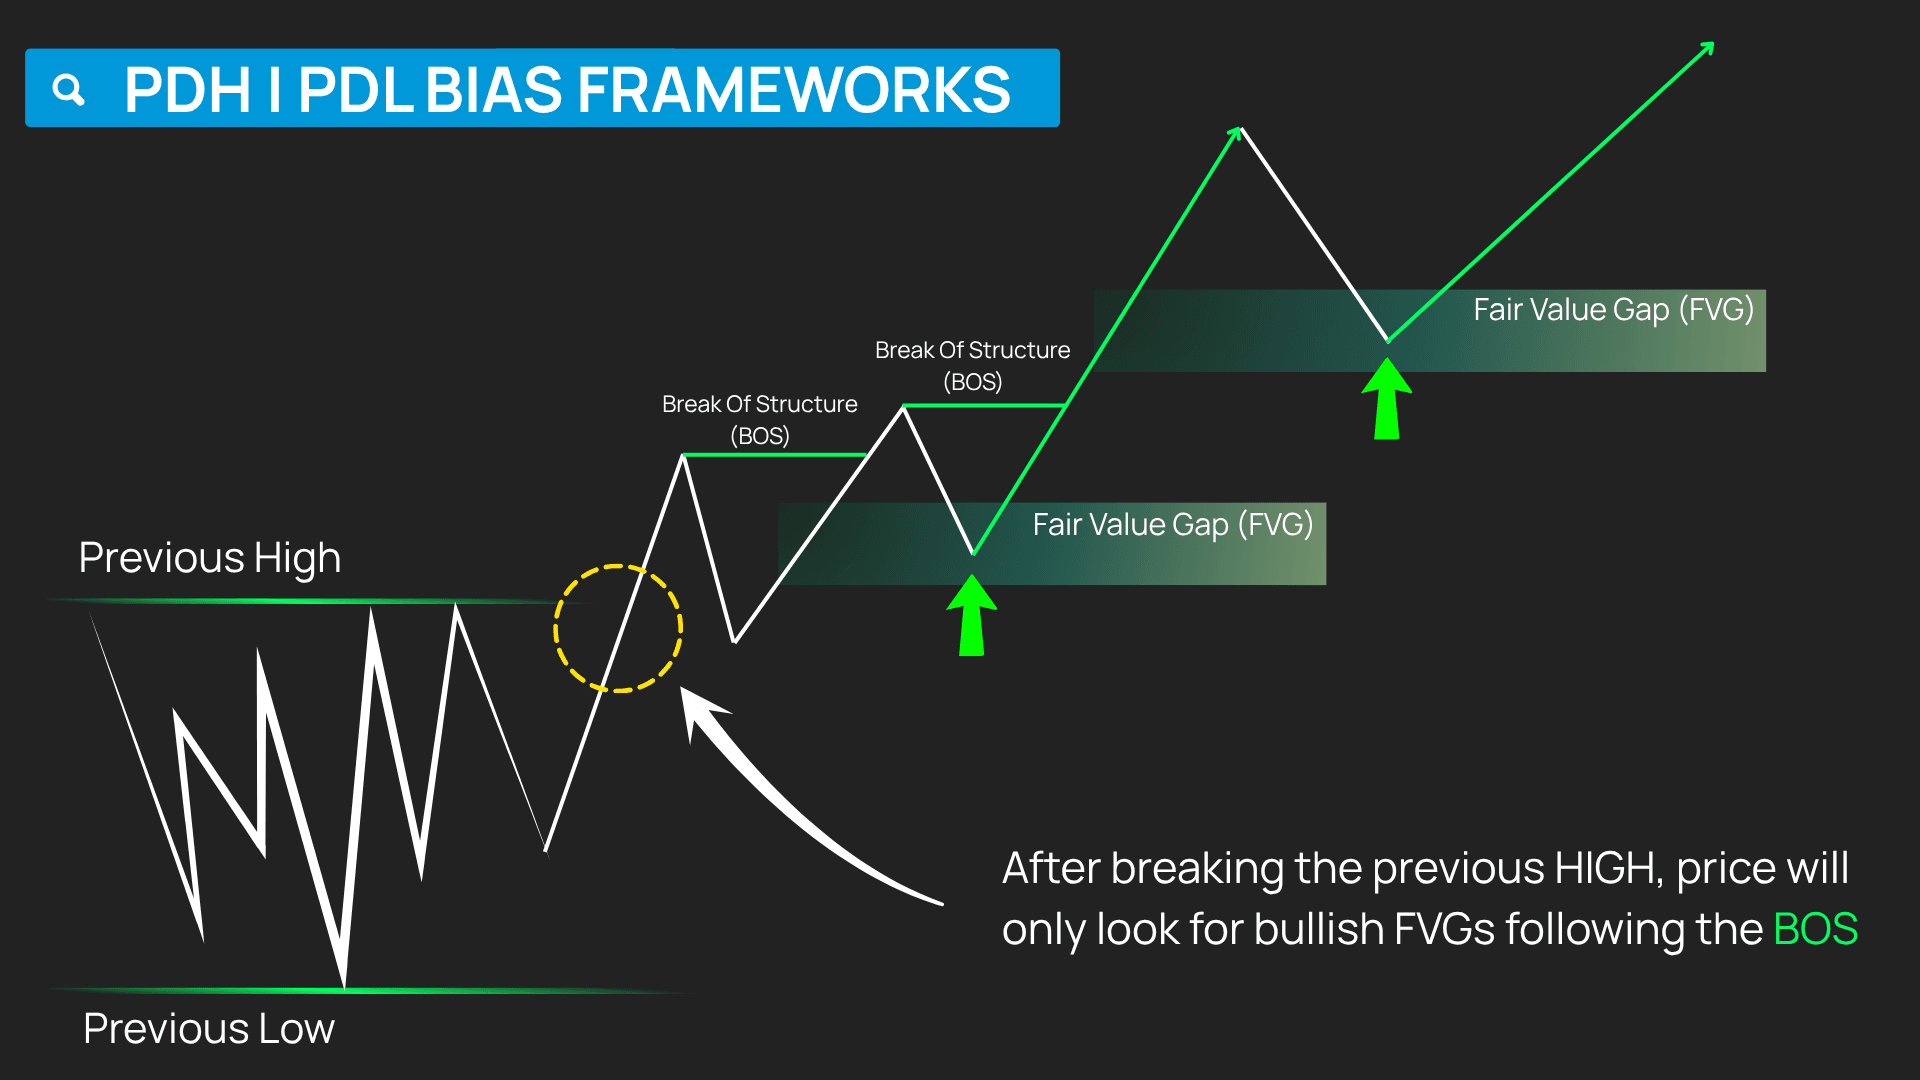
PDH/PDL Tracking → Liquidity Bias → BOS Filtering → Fair Value Gap → Reaction Signal
This framework helps determine whether Buy-Side or Sell-Side liquidity is favored and where price may seek liquidity next.
 2026_06_02 (1_55_05 AM)_1784392283860.png)
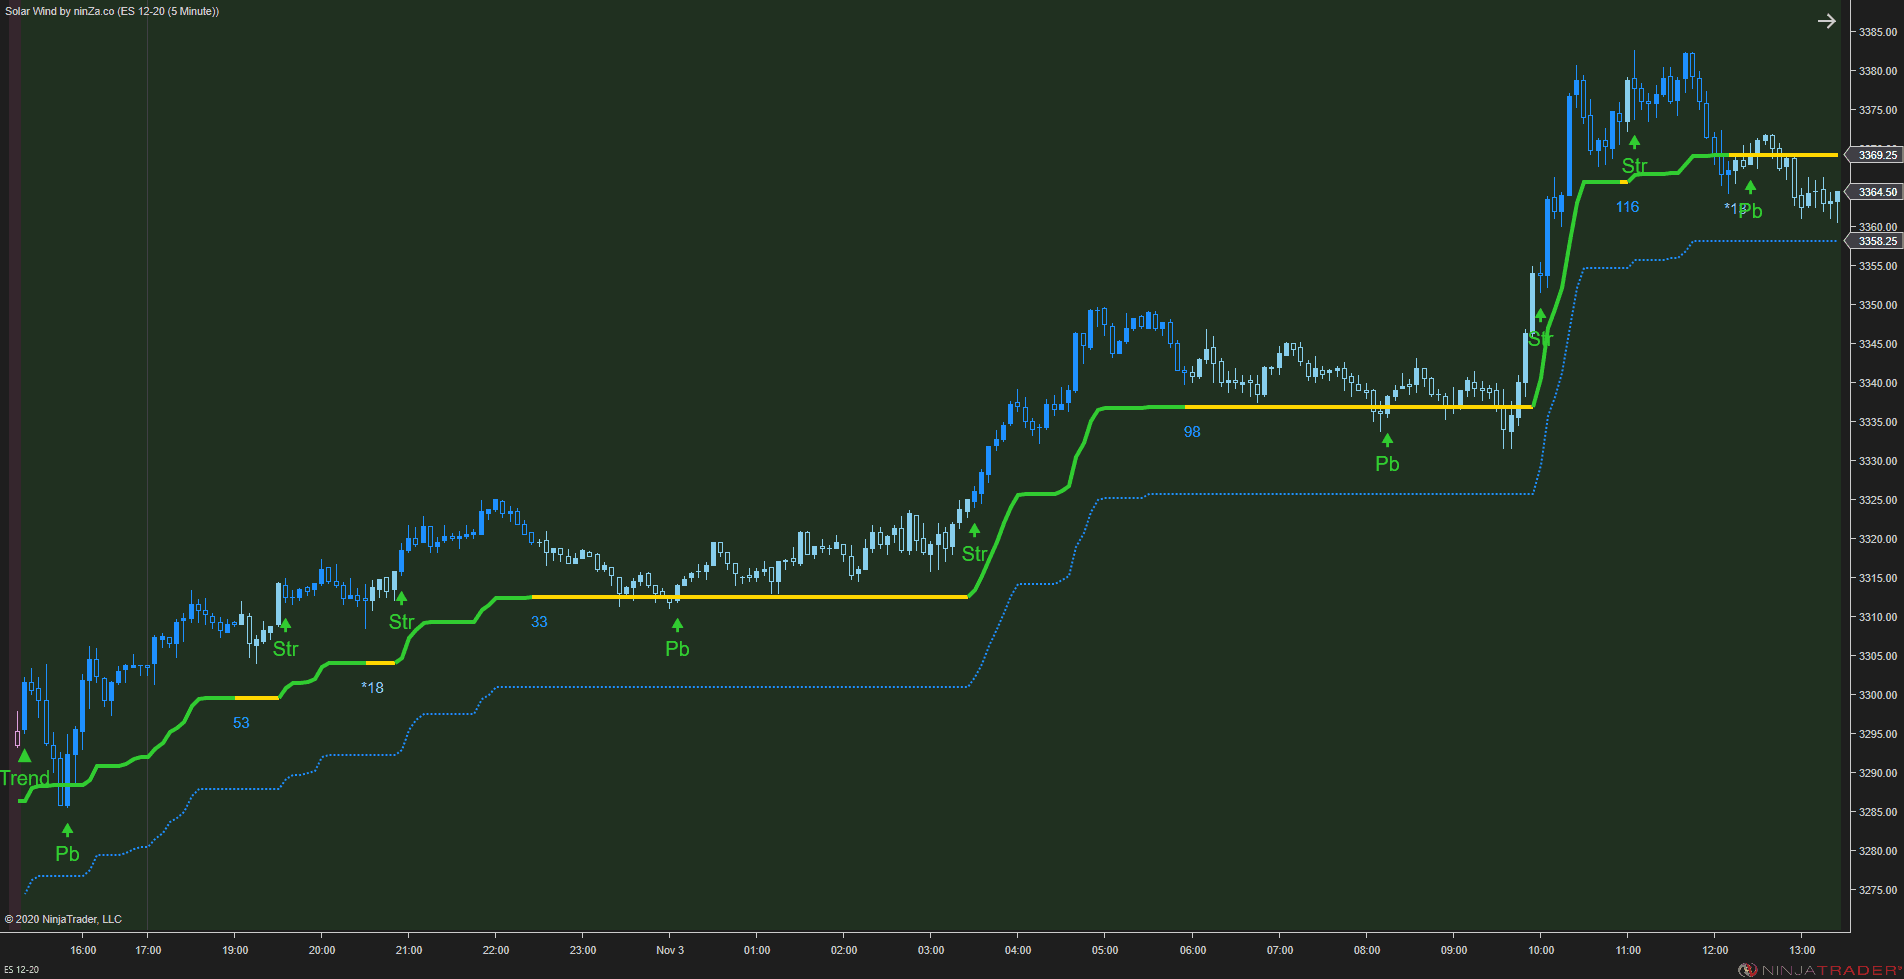
02. Confirm trend direction and strength
Once the liquidity context becomes clear, Solar Wave evaluates whether the resulting trend is strong or weak.
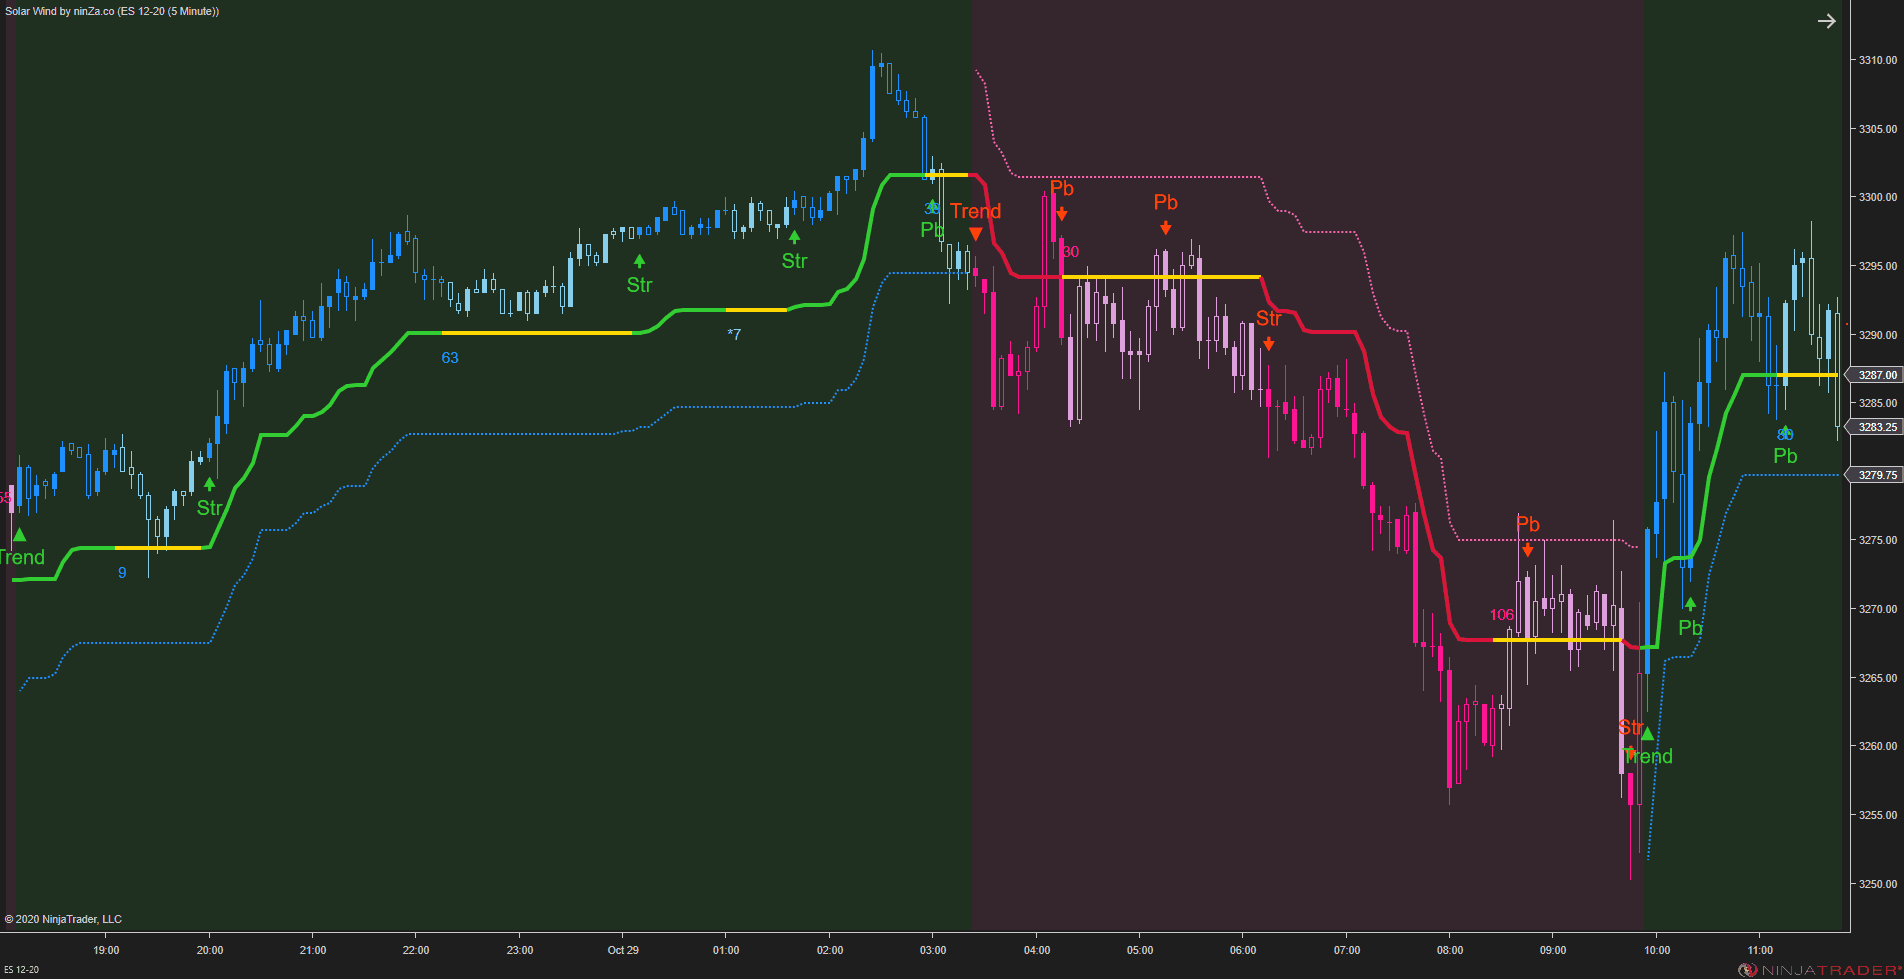
Its Trend Vector classifies the market into 4 conditions:
- Strong uptrend
- Weak uptrend
- Strong downtrend
- Weak downtrend
Solar Wave is built from ninZaATR and price action without moving averages or smoothing, helping reduce the lag commonly associated with traditional trend indicators.
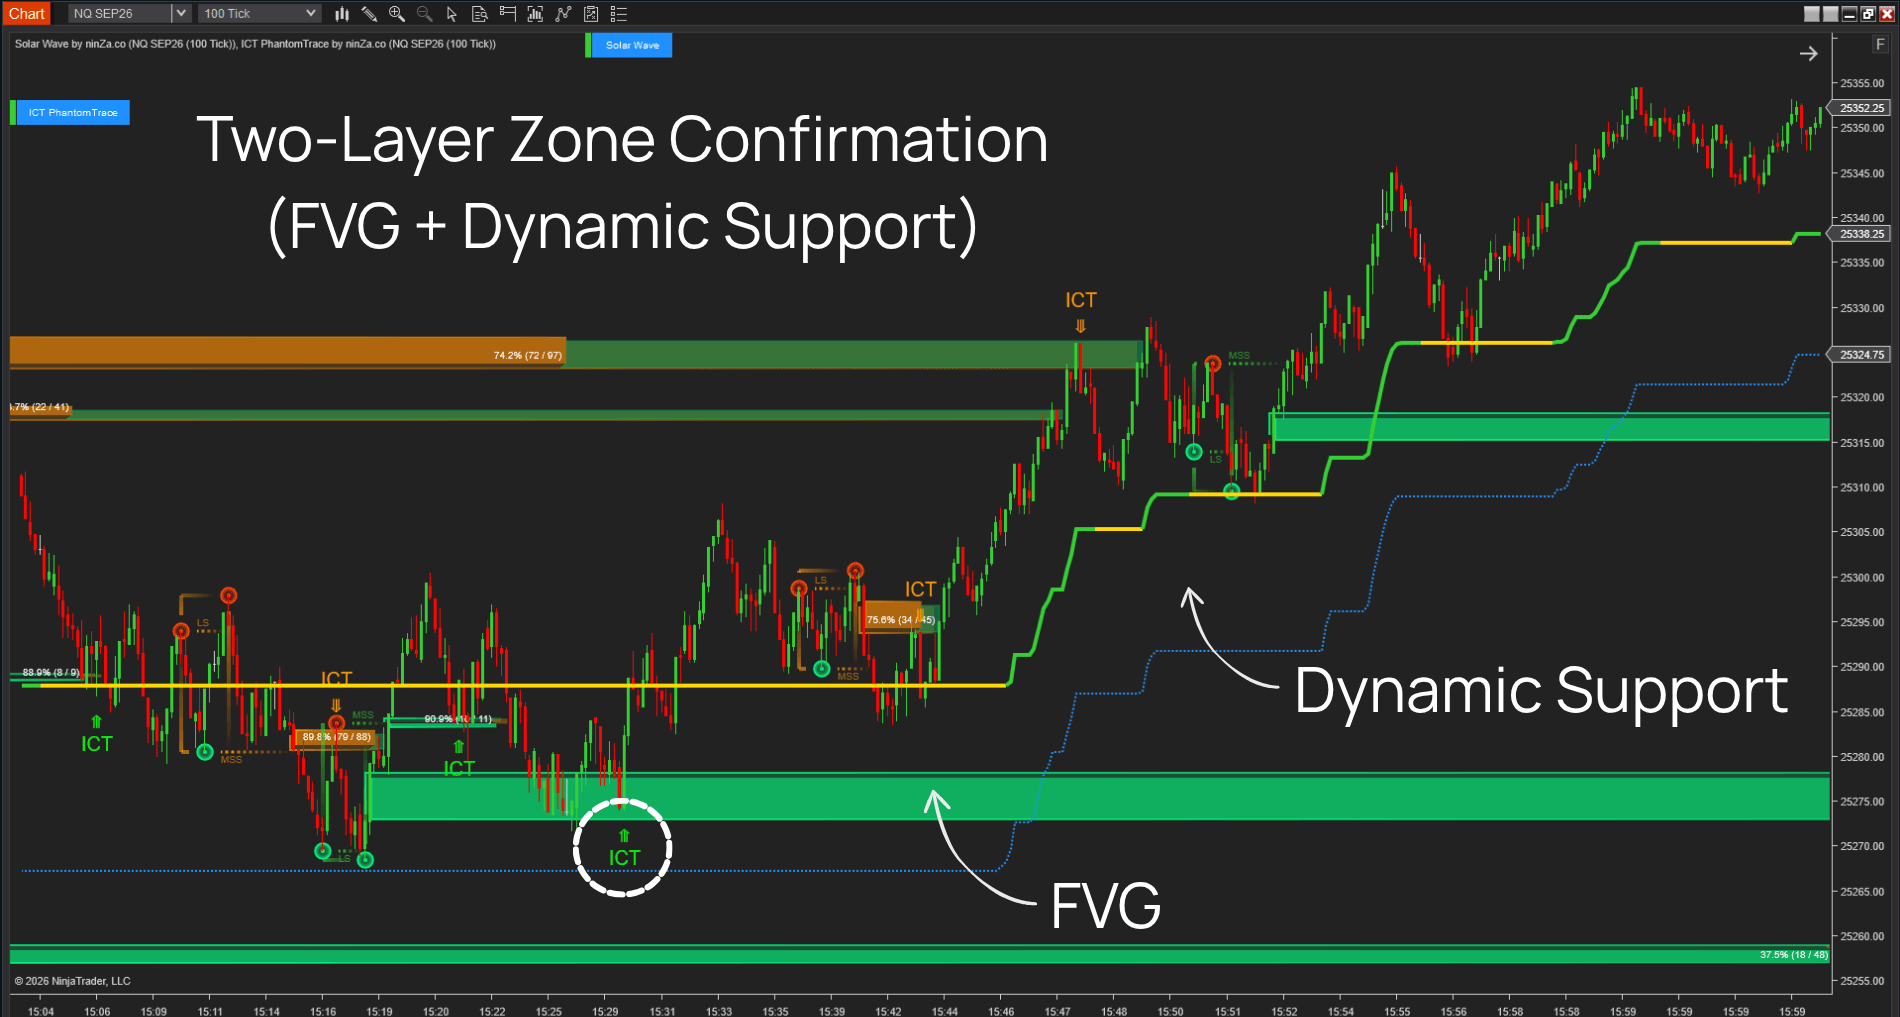
03. Evaluate the pullback and manage the move
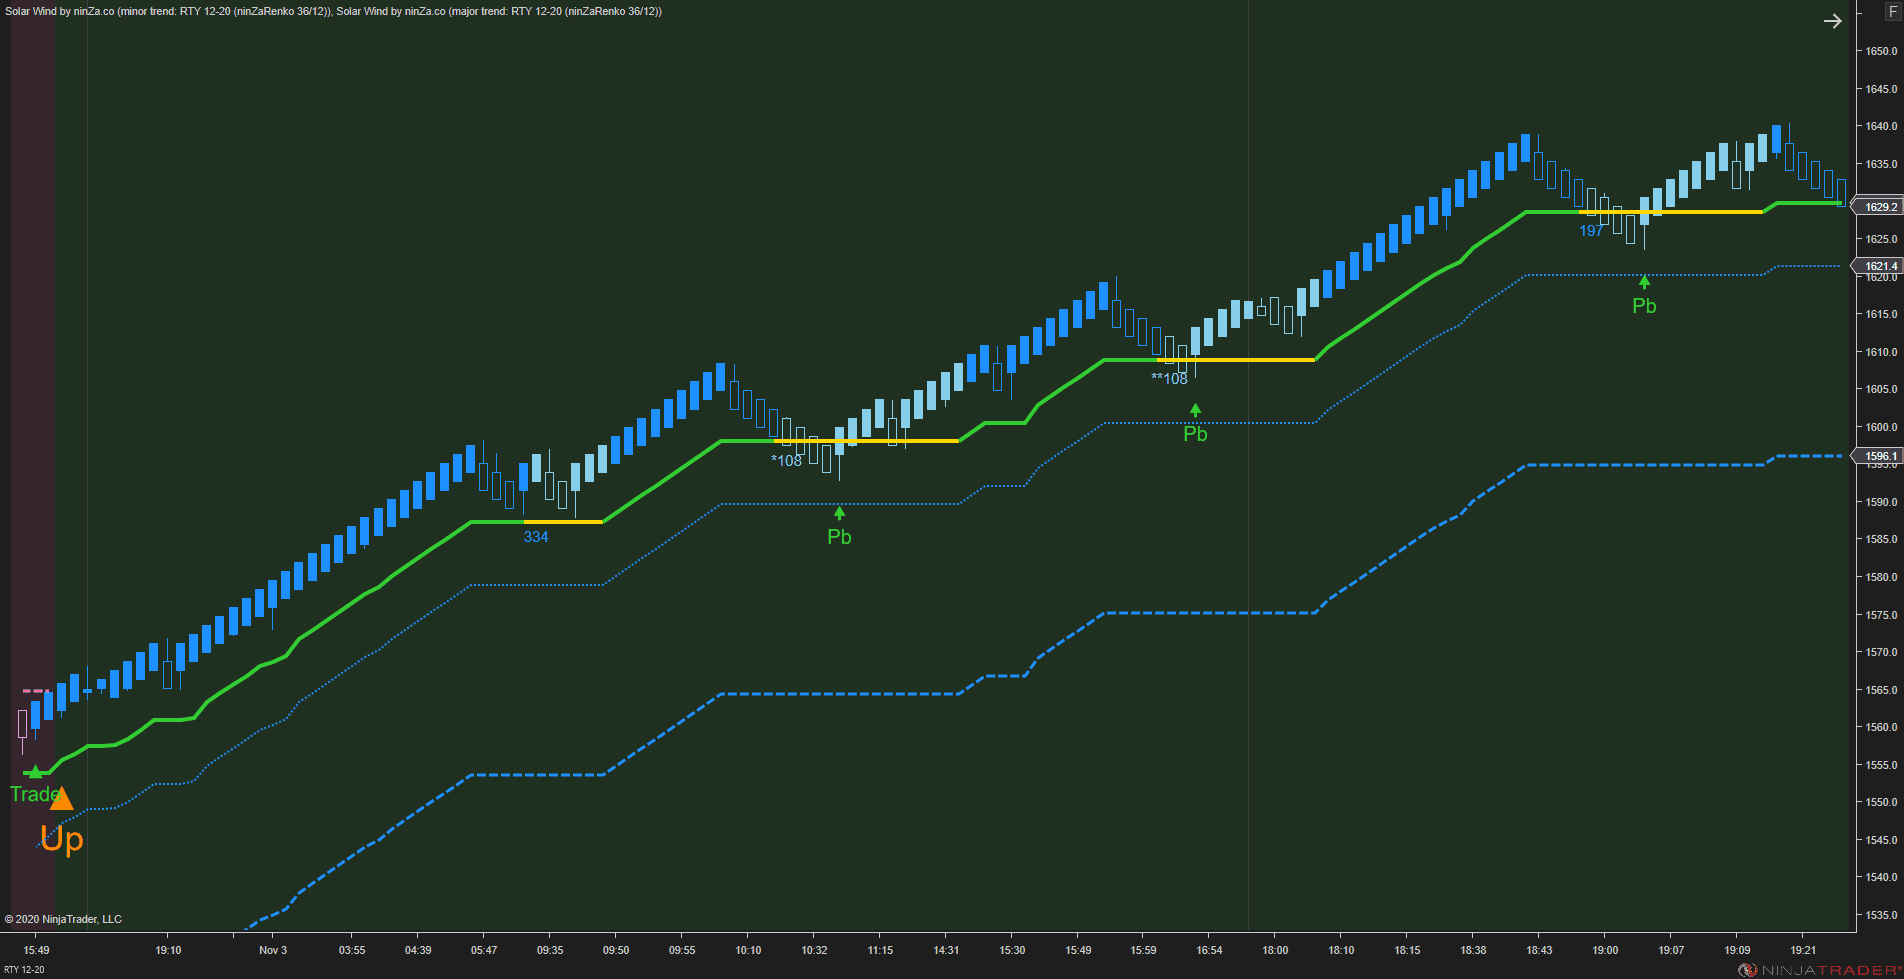
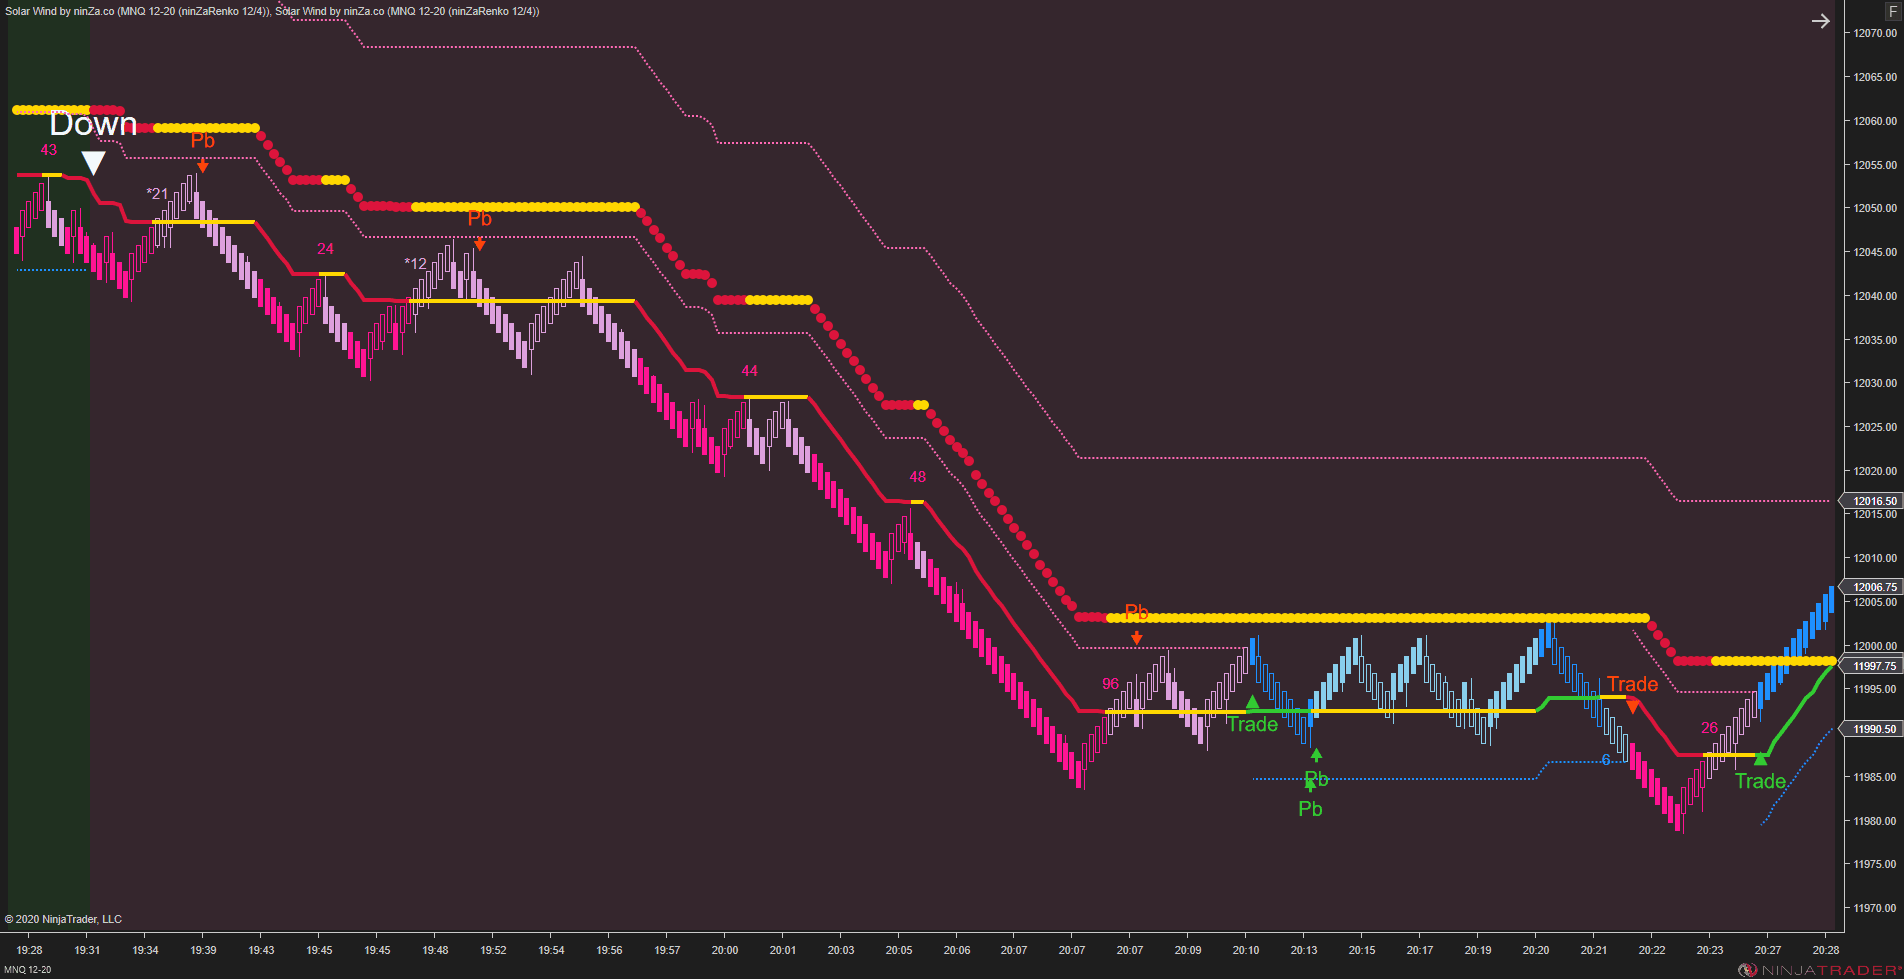
Solar Wave highlights pullbacks within the active trend, with the first and second pullbacks generally representing its preferred entry opportunities.
ICT PhantomTrace adds the liquidity context needed to determine whether that pullback supports a genuine transition or continuation objective.
After entry, Solar Wave’s Trailing Stop provides an objective reference for position management, while decreasing trend steps help identify when directional strength may be deteriorating.
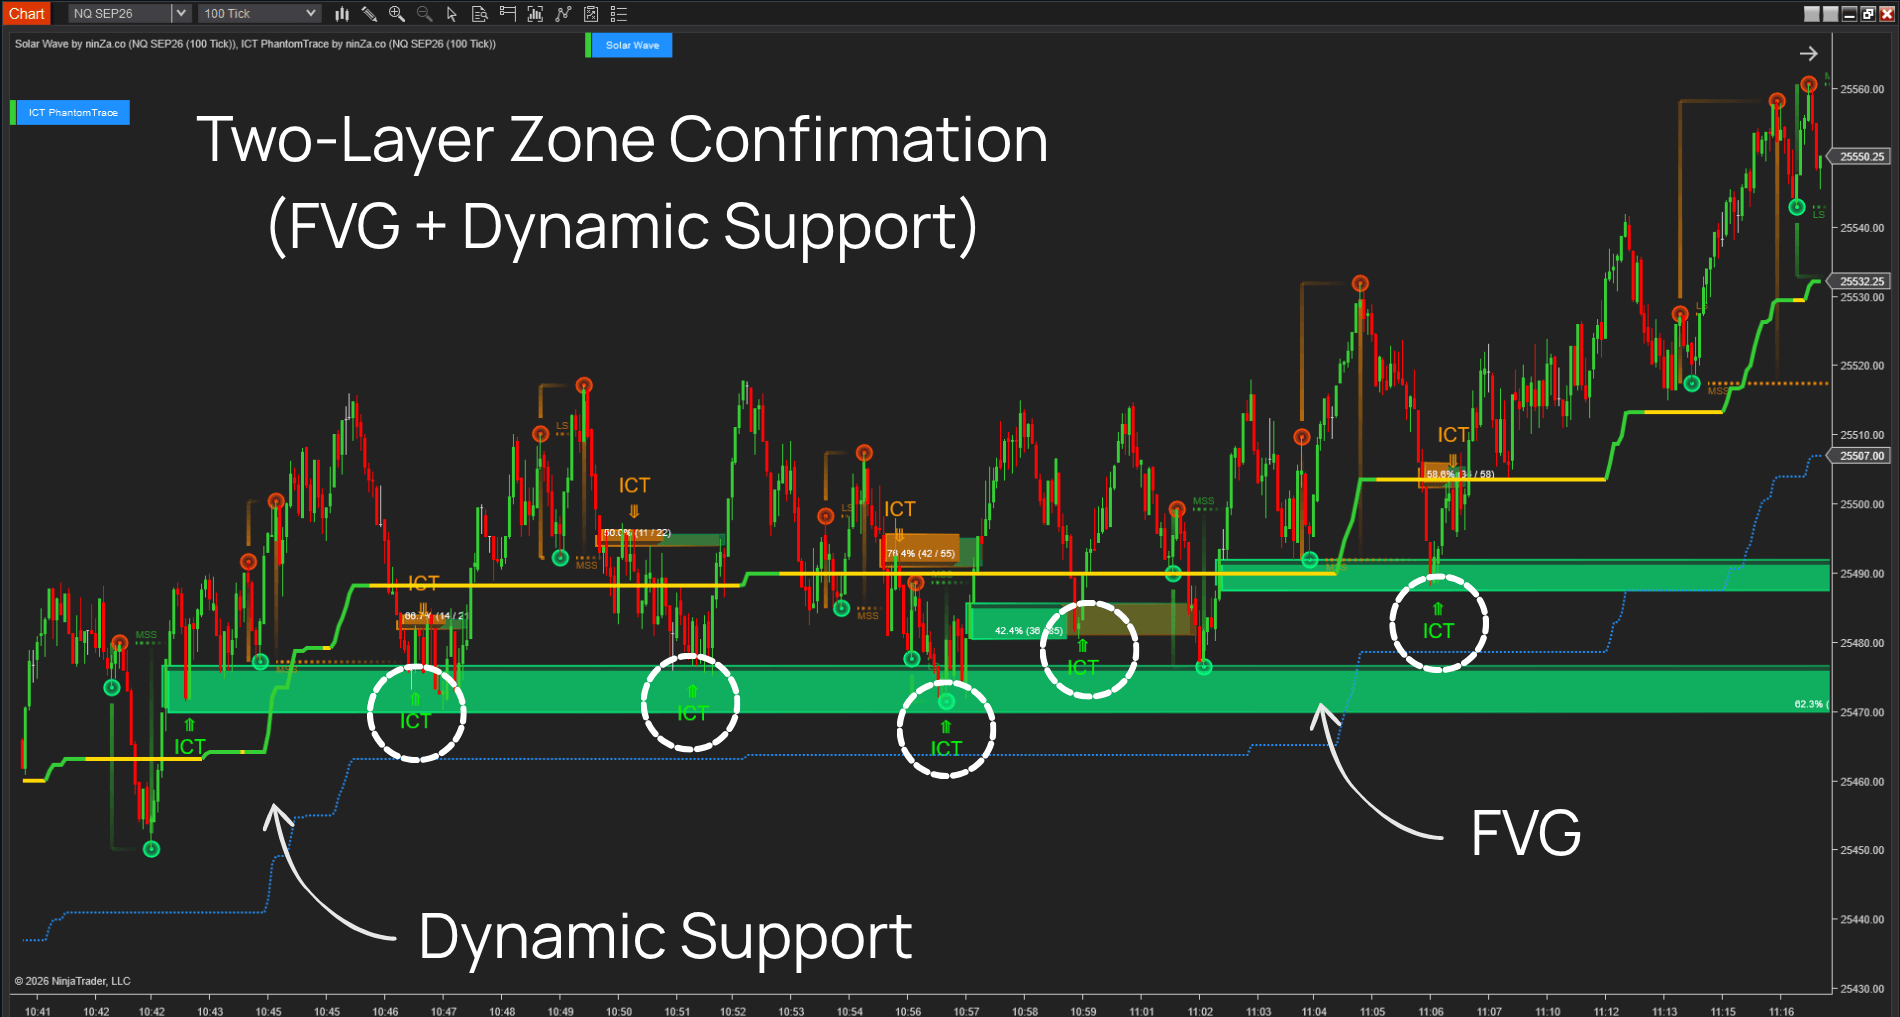
One connected trading workflow
Liquidity collection → Order-flow transition or continuation → Next liquidity objective → Trend direction and strength → Pullback evaluation → Position management
Instead of treating every MSS, FVG, breakout, or pullback as an independent signal, you can evaluate each setup within the market’s broader liquidity and trend structure.
What changes in your trading process
- From isolated ICT events: You identify an MSS or FVG but still need to determine whether the market has sufficient directional strength to continue.
- To liquidity-backed trend evaluation: You understand where liquidity has been taken, which objective may be active, and whether the resulting trend supports the opportunity.
- From chasing trend expansion: You react after price has already moved or enter every pullback without knowing whether the trend remains strong.
- To more selective pullback timing: You evaluate pullbacks only after confirming both liquidity context and current trend strength.
- From emotional position management: You exit a valid trend too early or continue holding after the move begins to weaken.
- To structured trade management: You use an objective trailing reference and trend-step deterioration to manage the position as conditions change.
ICT PhantomTrace
See the liquidity objective behind market movement
ICT PhantomTrace is an ICT indicator for NinjaTrader 8 that connects recurring liquidity behaviors into one decision framework.
It helps you identify:
- Where liquidity has been collected
- When order flow begins to shift
- Where displacement creates a Fair Value Gap
- When price returns and reacts at the imbalance
- Whether PDH or PDL is the active liquidity objective
- Whether continuation conditions align with the current liquidity bias
The result is a clearer understanding of why price is moving and where liquidity may be sought next.
Solar Wave
Read trend strength without traditional moving-average lag
Solar Wave is a complete trend-following indicator based on ninZaATR and price action.
It helps you:
- Read trend direction and strength through the Trend Vector
- Distinguish strong trends from weak, correcting, or mature conditions
- Identify pullbacks within the active trend
- Follow the first and second pullbacks as preferred entry opportunities
- Manage positions through a dedicated Trailing Stop
- Recognize weakening momentum through decreasing trend steps
The result is a clearer framework for confirming, entering, and managing a developing trend.
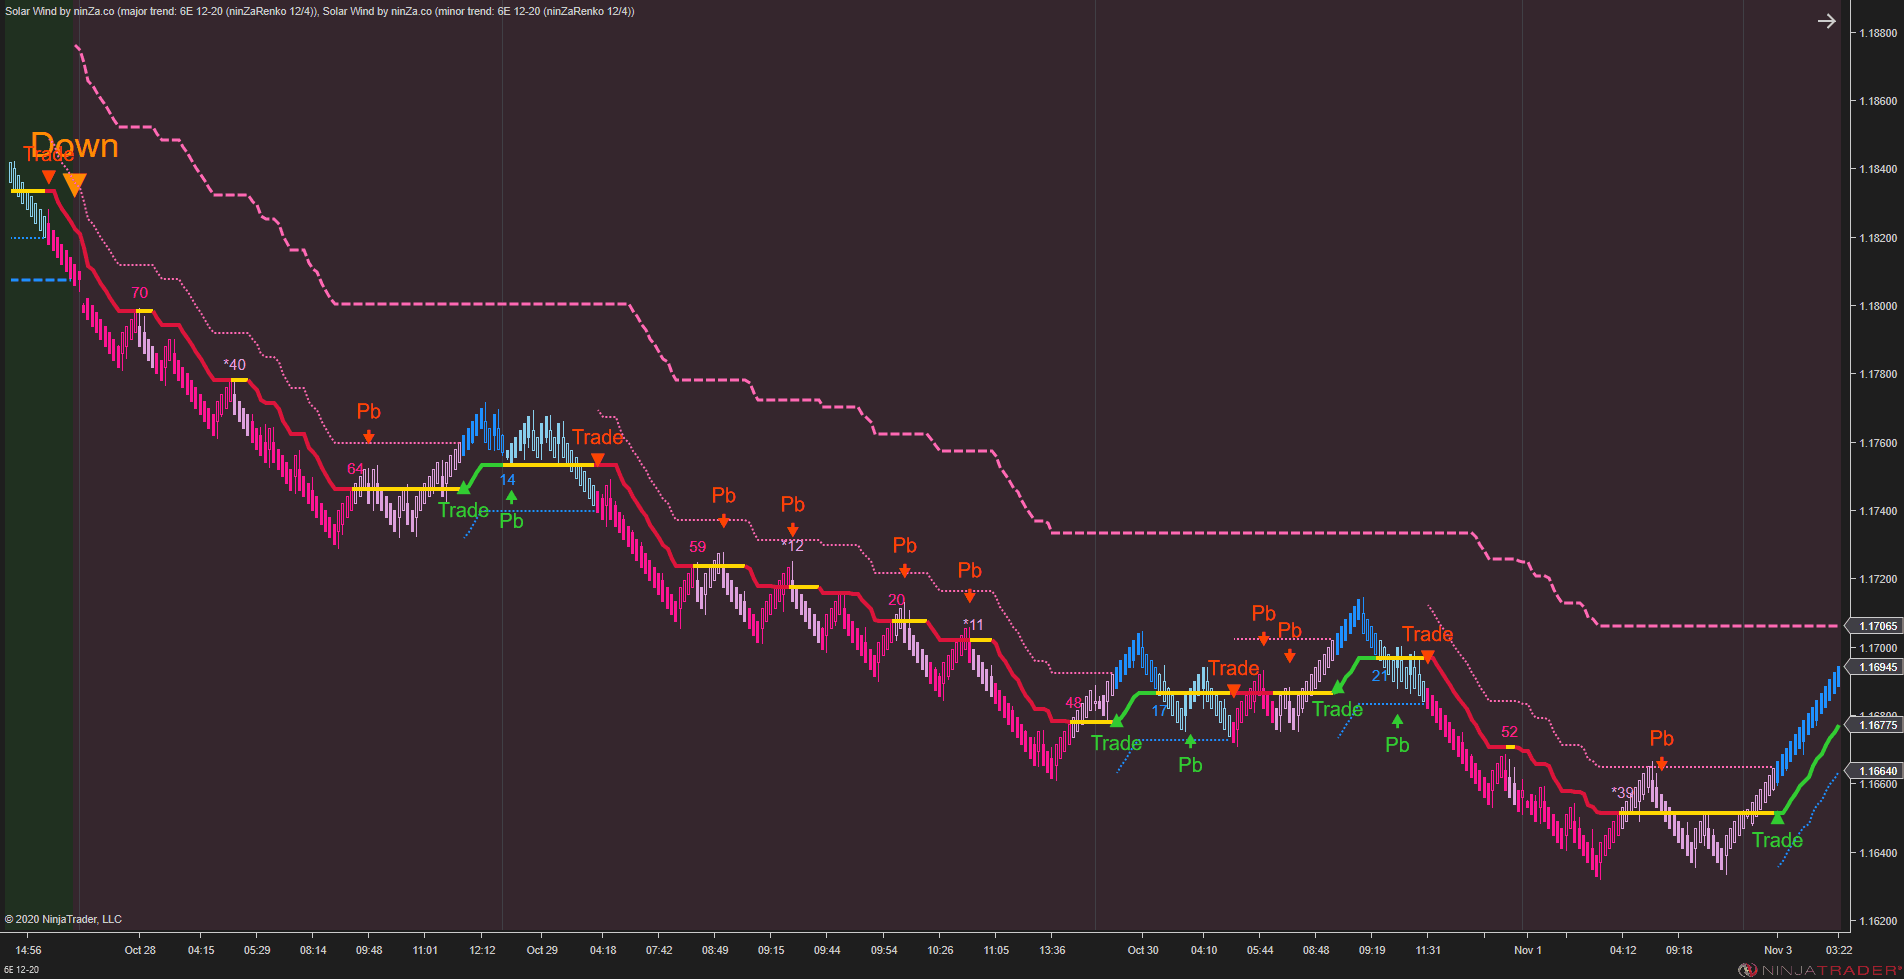
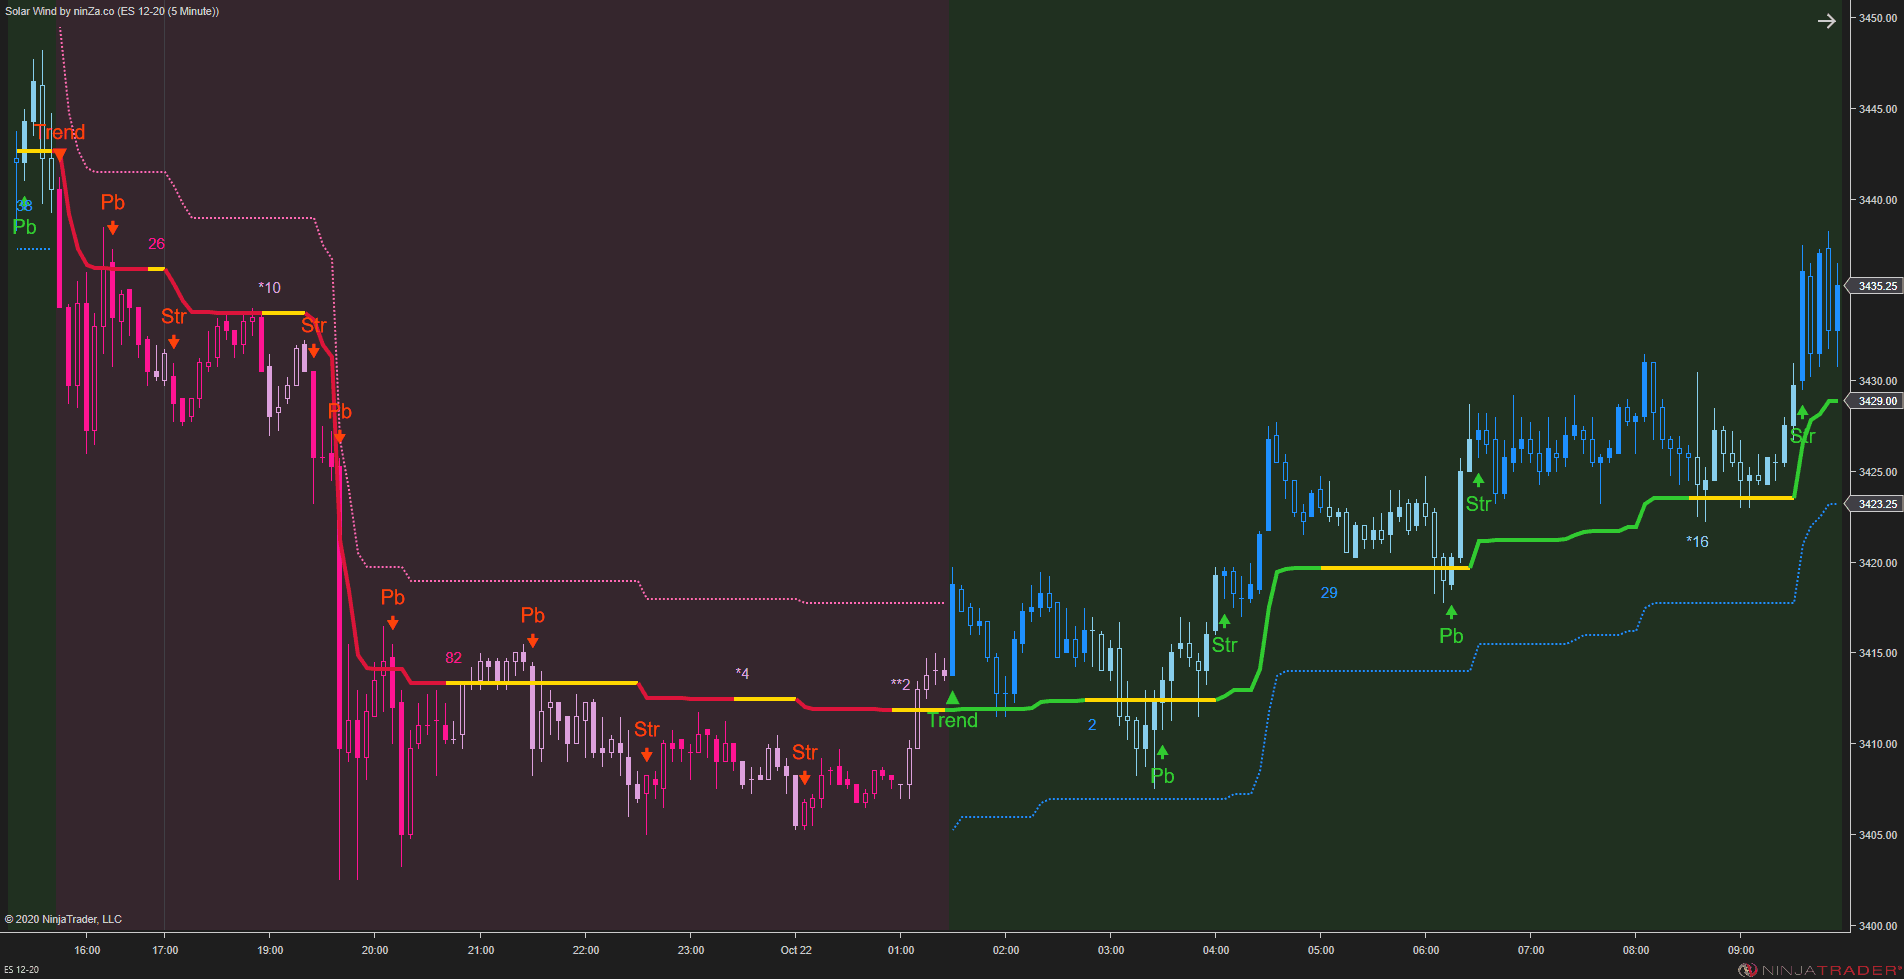
ICT PhantomTrace + Solar Wave offer
- ICT PhantomTrace (value: $550)
- Solar Wave (Value: $750)
- Combined value: $1,300
Today’s access price: $550
Access both indicators for the standalone value of ICT PhantomTrace.
Product Media
These media materials may have been recorded/captured in favorable markets. Please review our “acceptable marketing practices”.
Images
From Happy Customers
by M.
Indicators Improved My Charts. Hannah's Help And Great Customer Service. Will Buy Again.
I have been using the ninZa.co indicators for several months now and am very happy with what a valuable addition they have been to my charts. I recently decided to add one of the recently released indicators from ninZa.co. But after using for a few days, it wasn’t quite what I had been looking for. I contacted ninZa.co and had the pleasure of working with Hannah for an exchange to a different one of the many available indicators. At the time, the indicator I wanted to purchase to replace the one I had recently bought was on sale. Hannah put through an exchange and without my having to ask, gave me the advantage of the sale price. She also included a pdf that provided education about the indicator I chose to switch to. Any time I have had contact with one of the associates from ninZa.co, I have received excellent customer service, and will not hesitate to purchase from them again.
by Bartosz
Grace Goes Above And Beyond: A Customer Support Experience That Exceeds Expectations!
Thank You, Grace! Your support is extraordinary I wish all companies have such great support. Keep going I’m 200% satisfied.
by Kari L.
ConnorsRSI Pro With Grace's Outstanding Customer Service
Thank you very much for your excellent customer service, Grace! You are doing an excellent job making customers' lives much easier.
by T.
An Exemplary Customer Experience At NinZa.Co: Unveiling The Power Of Cumulative Delta
I'm a new customer with ninZa.co and i was needing help today in making a purchase. I made a request on your chat platform and Hannah came to my rescue. She helped me find the what I needed and even offered me a discount. Everything went very smoothly from that point. I made the purchase and she even provided me some documentation on the indicator. I am very pleased with her assistance. Thanks again Hannah for your excellent customer service !!
See Highway Fractal Zone in real market conditions
→ Watch it scalp NQ with 9 winning trades in under 3 minutes.

ninZa.co Indicators
0 online
What indicator, system, or feature should we build next?
Tell us what you need →

Complete ICT workflow explained by James Buchman
🎬Watch webinar replay