
![[Auction Δxis] A comprehensive overview of Auction Δxis](https://forestcms.nyc3.digitaloceanspaces.com/media/small_Thumbnail New release Auction ∆XIS_1784002540029.jpg)
_1784001871922.jpg)
![[July Exclusive] Liberty Edge Bundle](https://forestcms.nyc3.digitaloceanspaces.com/media/small_liberty-edge-bundle-hdhdh_1783139262484.png)
![[AbsP] MEO #80: ICT PhantomTrace + PANA Kanal](/_next/image?url=https%3A%2F%2Fforestcms.nyc3.digitaloceanspaces.com%2Fmedia%2Fmedium_ICT%20PhantomTrace%20%2B%20PANA%20Kanal_1782879476128.png&w=1920&q=75)
[08 Jul] Auction ∆xis: Pure Intraday Support & Resistance - Explore solution
[25 Jun] Captain Optimus Strong v2: Trader feedback shaped this upgrade - Explore solution
[22 Jun] Highway Fractal Zone: Support & Resistance needs more than a swing - Explore solution
[12 Jun] ICT PhantomTrace: Why most ICT traders keep falling short - Explore solution
[03 Jun] BigTrade Sweep: Detecting Big Trades in every candle - Explore solution
[08 May] New Horizon: A new standard in intraday automated trading ☀️ - Explore solution
Product Description
Read where liquidity is heading, then let the trend and its structure guide execution
Use ICT PhantomTrace and PANA Kanal together to understand where liquidity is being sought, confirm the prevailing trend and its dynamic support and resistance, and approach each ICT-based setup within a considered liquidity-and-trend framework.
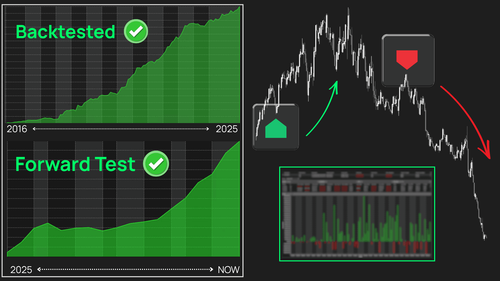
Reading ICT signals in isolation only tells part of the story
A stop run, a Market Structure Shift, or a Fair Value Gap can appear valid on the chart. The more useful question is whether price is genuinely shifting direction, or simply continuing within the prevailing trend.
When liquidity context and trend condition are considered separately, it becomes easy to act early, position against the active direction, or treat every setup as equally significant. Bringing the two together restores that context.
A considered liquidity-and-trend workflow
ICT PhantomTrace tracks liquidity behavior – liquidity collection, structure shifts, Fair Value Gaps, and directional objectives such as Previous Day High and Previous Day Low.
PANA Kanal combines a Fibonacci algorithm with ATR to form a ribbon band that identifies the trend and highlights dynamic support and resistance, while offering trade-management references and a reading of trend momentum through market structure.
Together, they help you focus on setups where liquidity behavior and trend condition support one another.
What this combo helps you do
- Recognize where liquidity may be targeted before price movement becomes obvious.
- Follow potential reversal conditions after stop runs, Market Structure Shifts, and Fair Value Gap reactions.
- Identify continuation setups as price moves toward larger liquidity objectives.
- Confirm whether the prevailing trend and its dynamic support/resistance align with the setup.
- Reference a trailing stop line and target markers when managing a position.
ICT PhantomTrace highlights
ICT PhantomTrace brings recurring liquidity behaviors into a unified decision framework, helping you read the market with greater context and focus on where liquidity is likely to be sought next – rather than simply where price has already moved.
It is built around 2 recurring liquidity behaviors:
- Liquidity Transition – when order flow begins to shift
- Liquidity Continuation – when the market continues toward its next liquidity objective
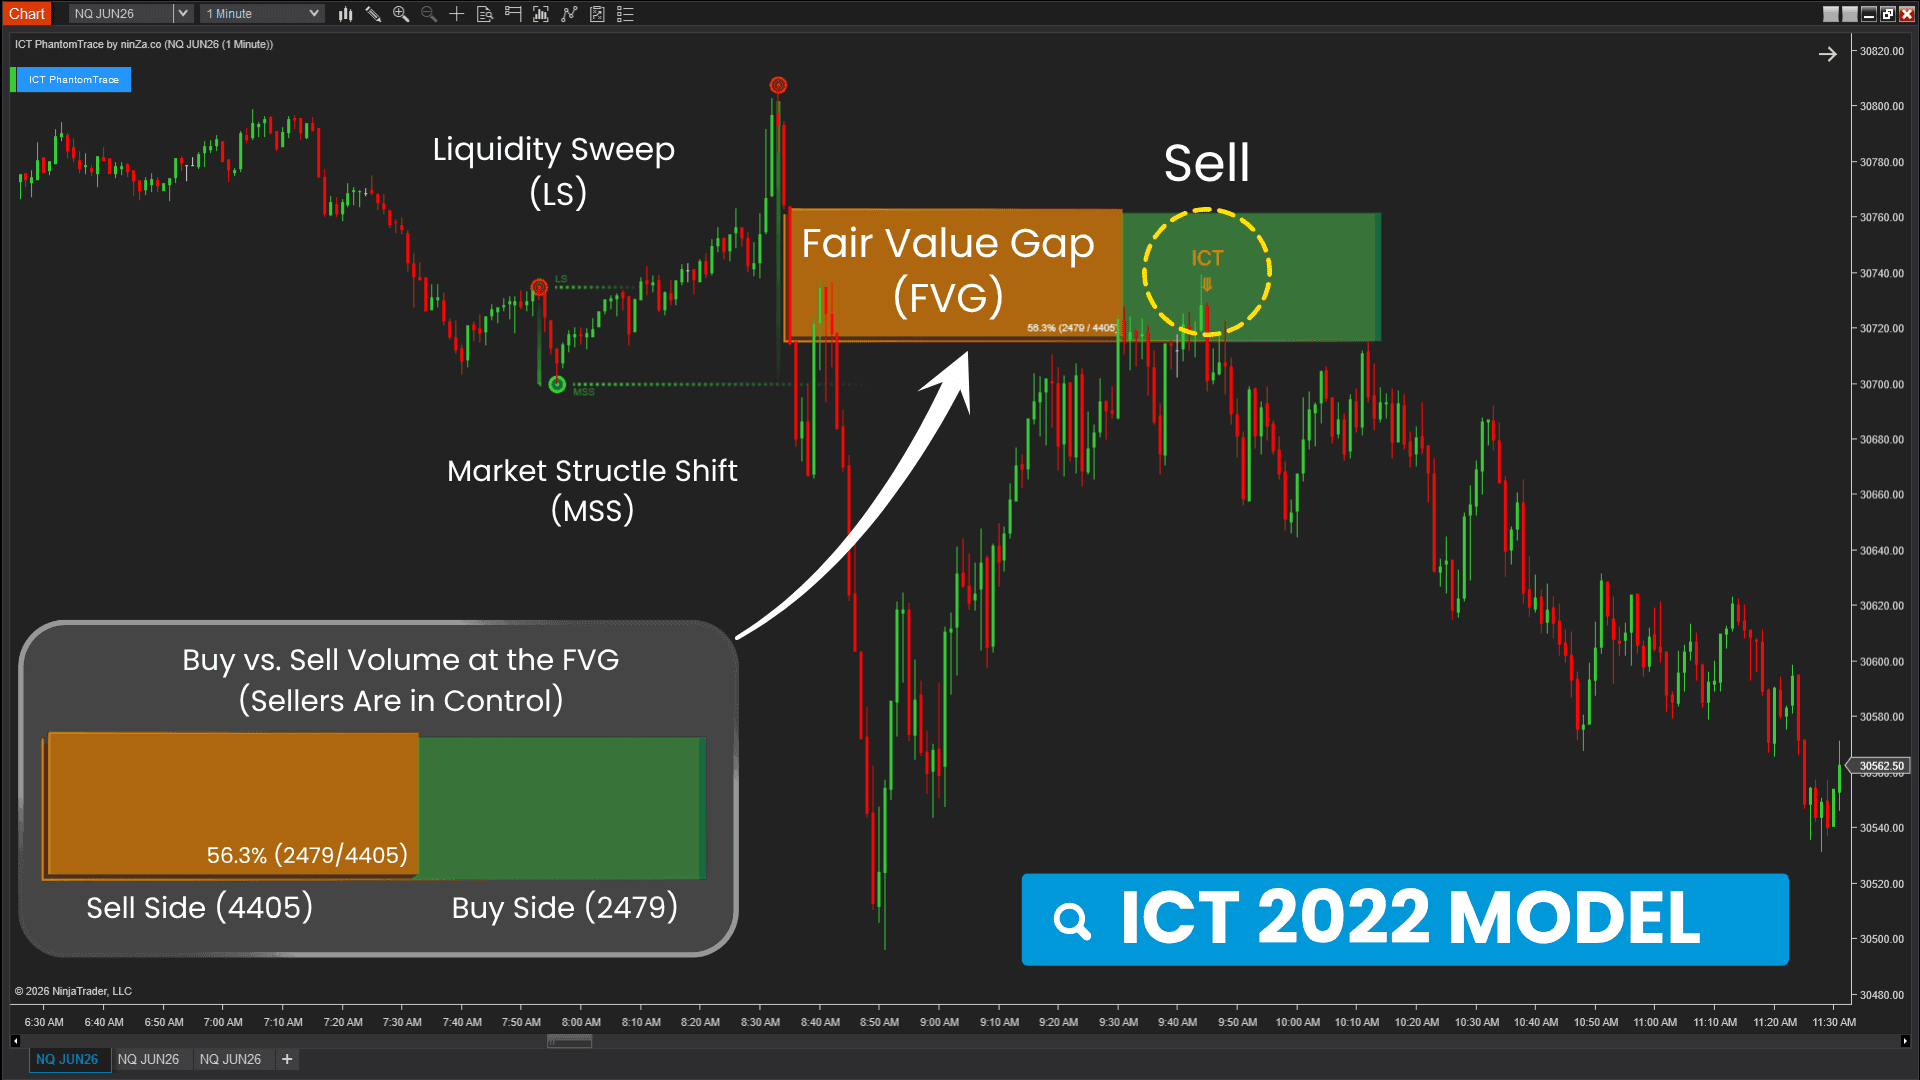
Liquidity transition detection (ICT 2022 Model) – tracked through 5 steps:
- Stop Run – identifies where liquidity has been collected
- Market Structure Shift (MSS) – detects when order flow begins to change
- Fair Value Gap (FVG) – highlights the imbalance created by displacement
- FVG Retracement – tracks price returning to the imbalance
- Reaction Signal – identifies when price reacts at the Fair Value Gap, completing the sequence
_1782879741992.png)
_1782879741645.png)
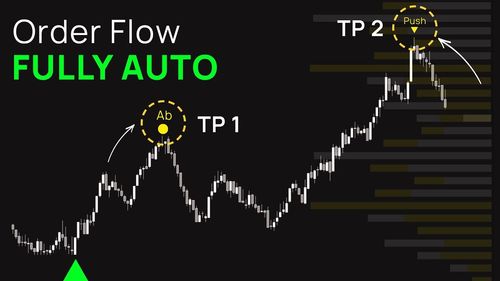
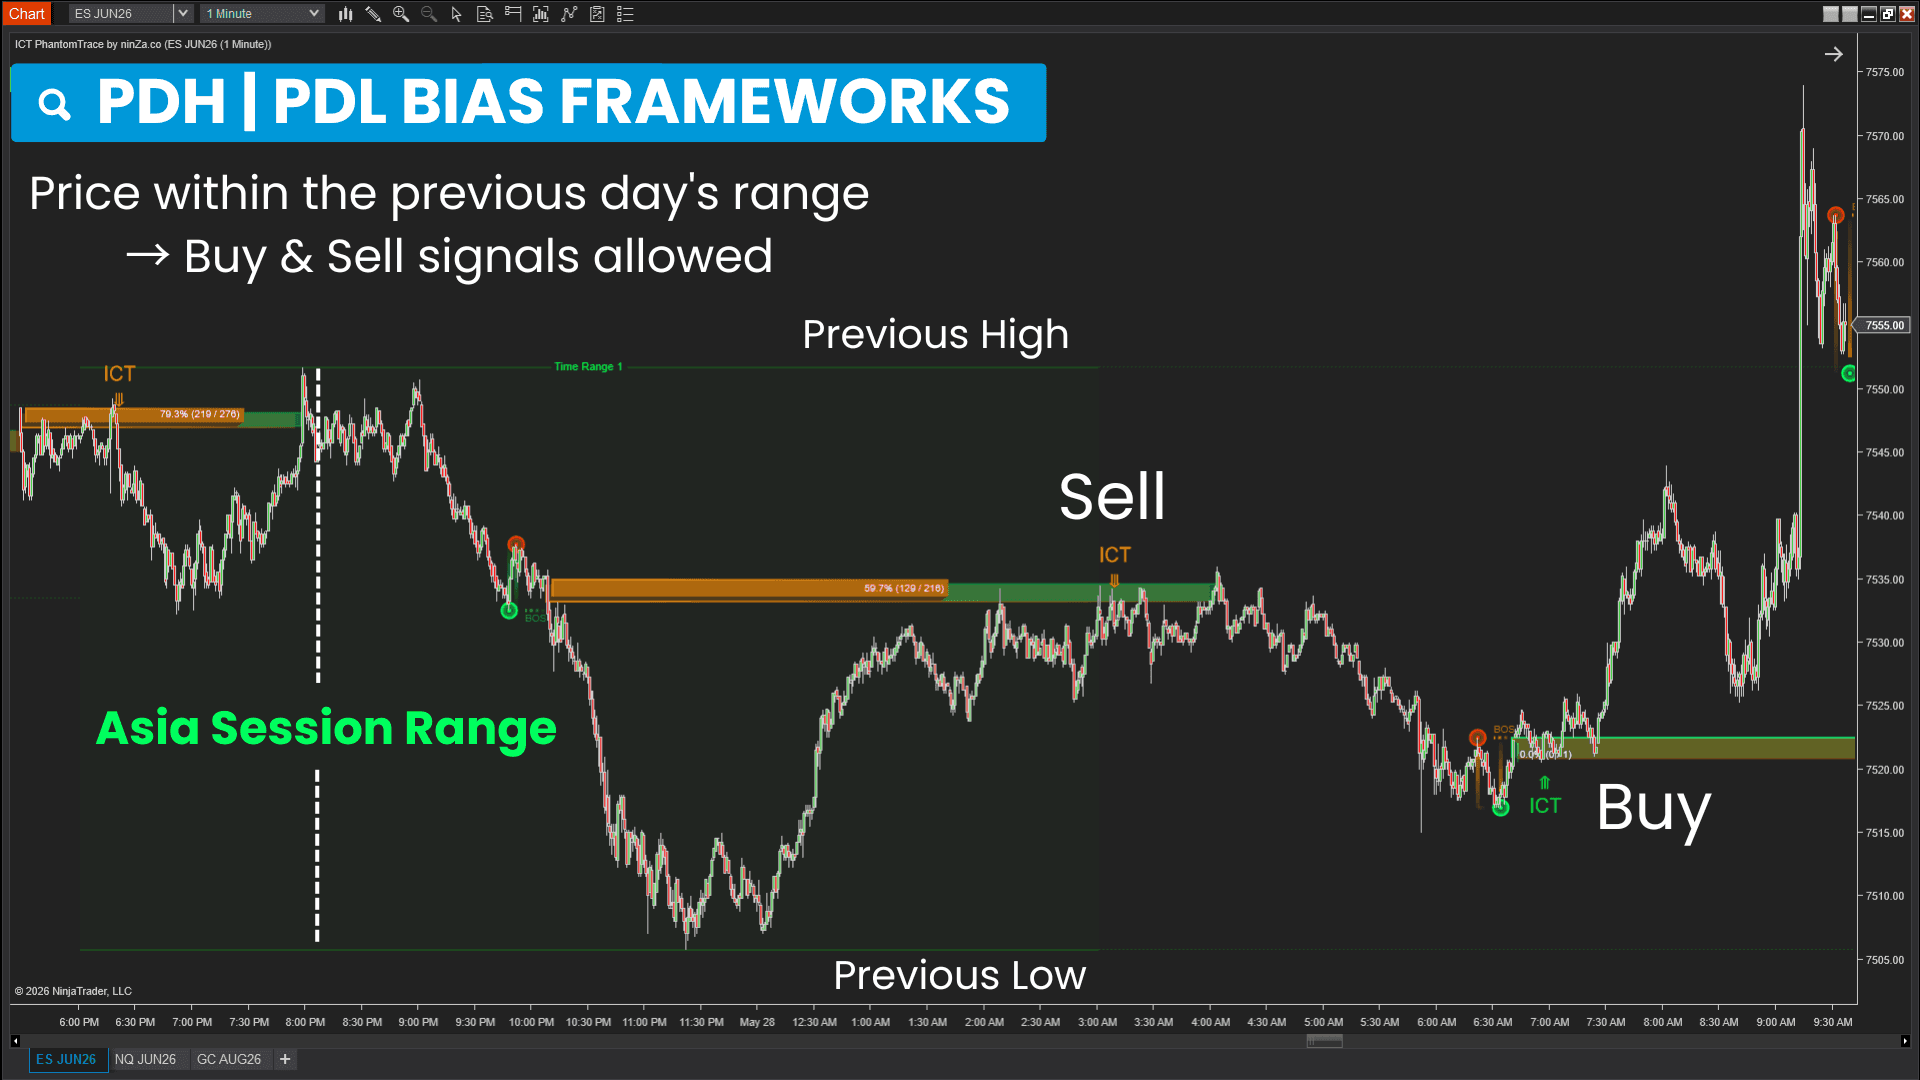
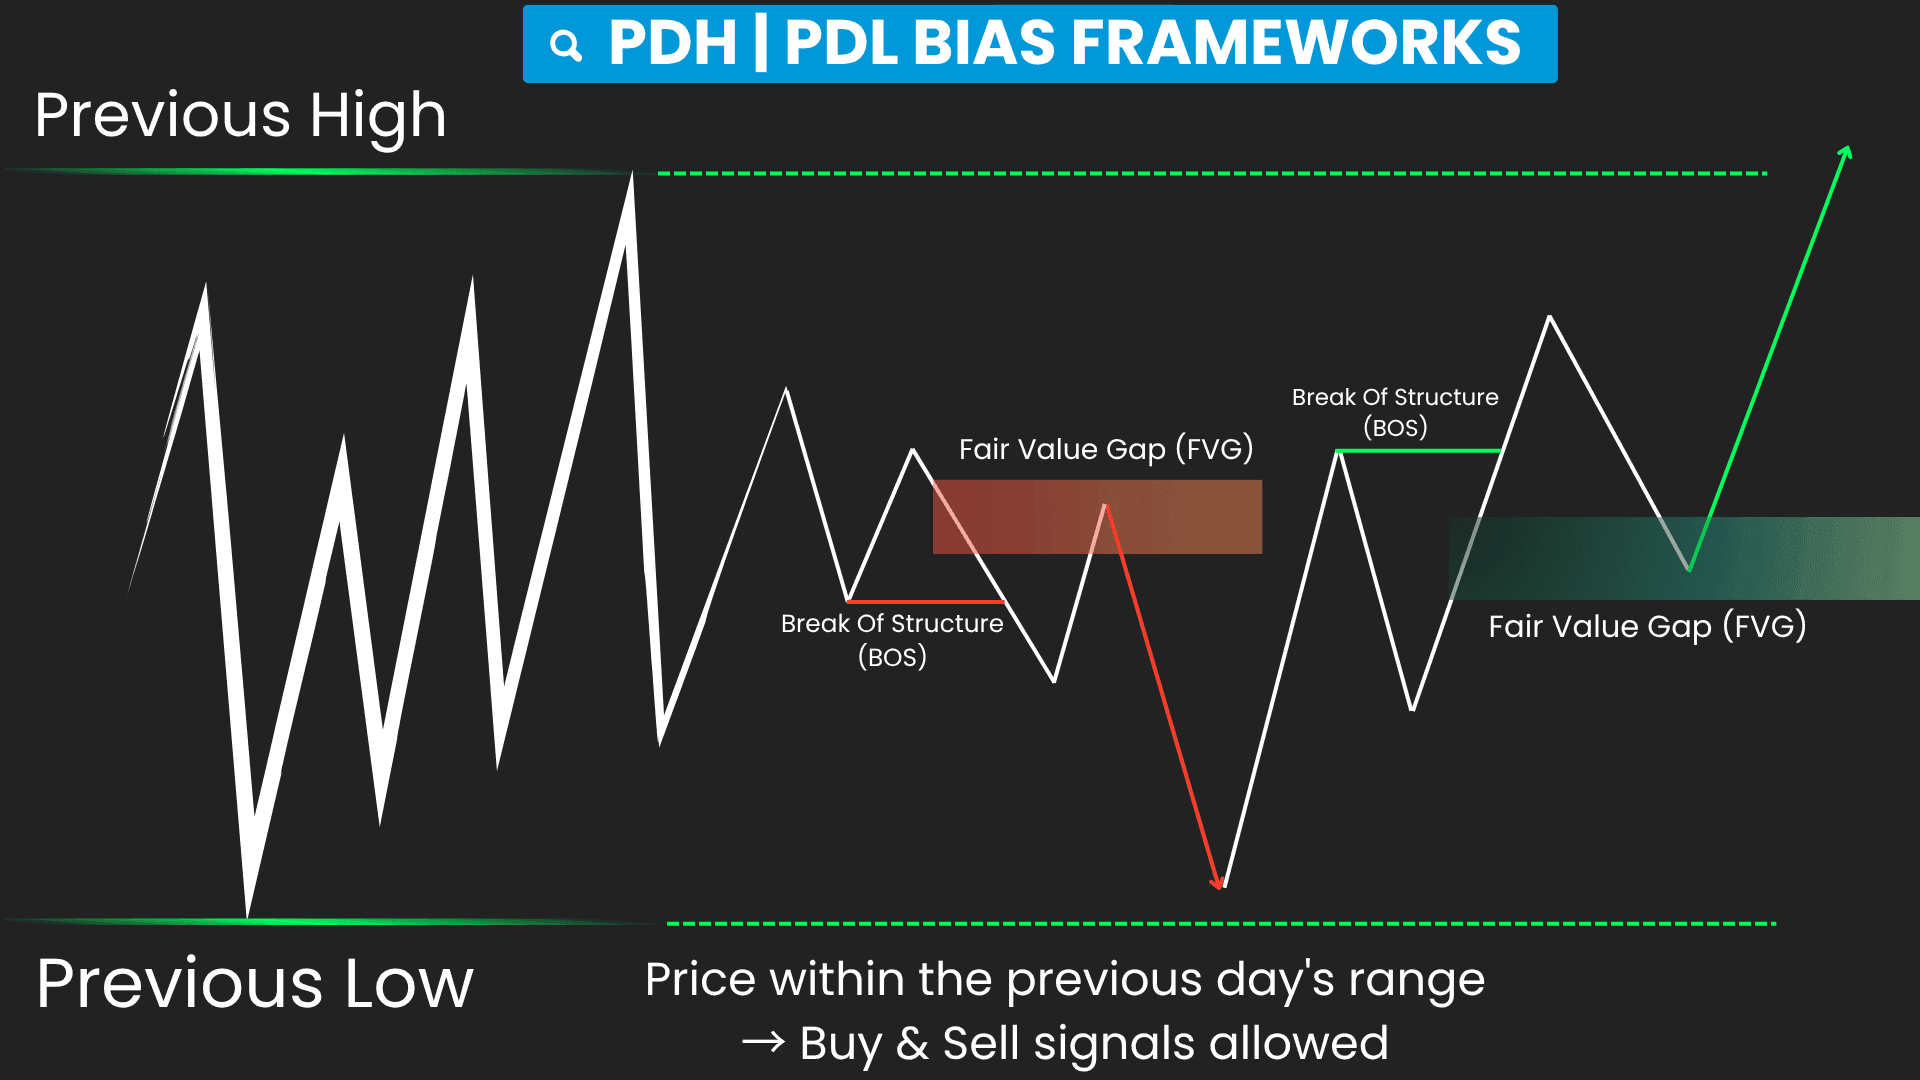
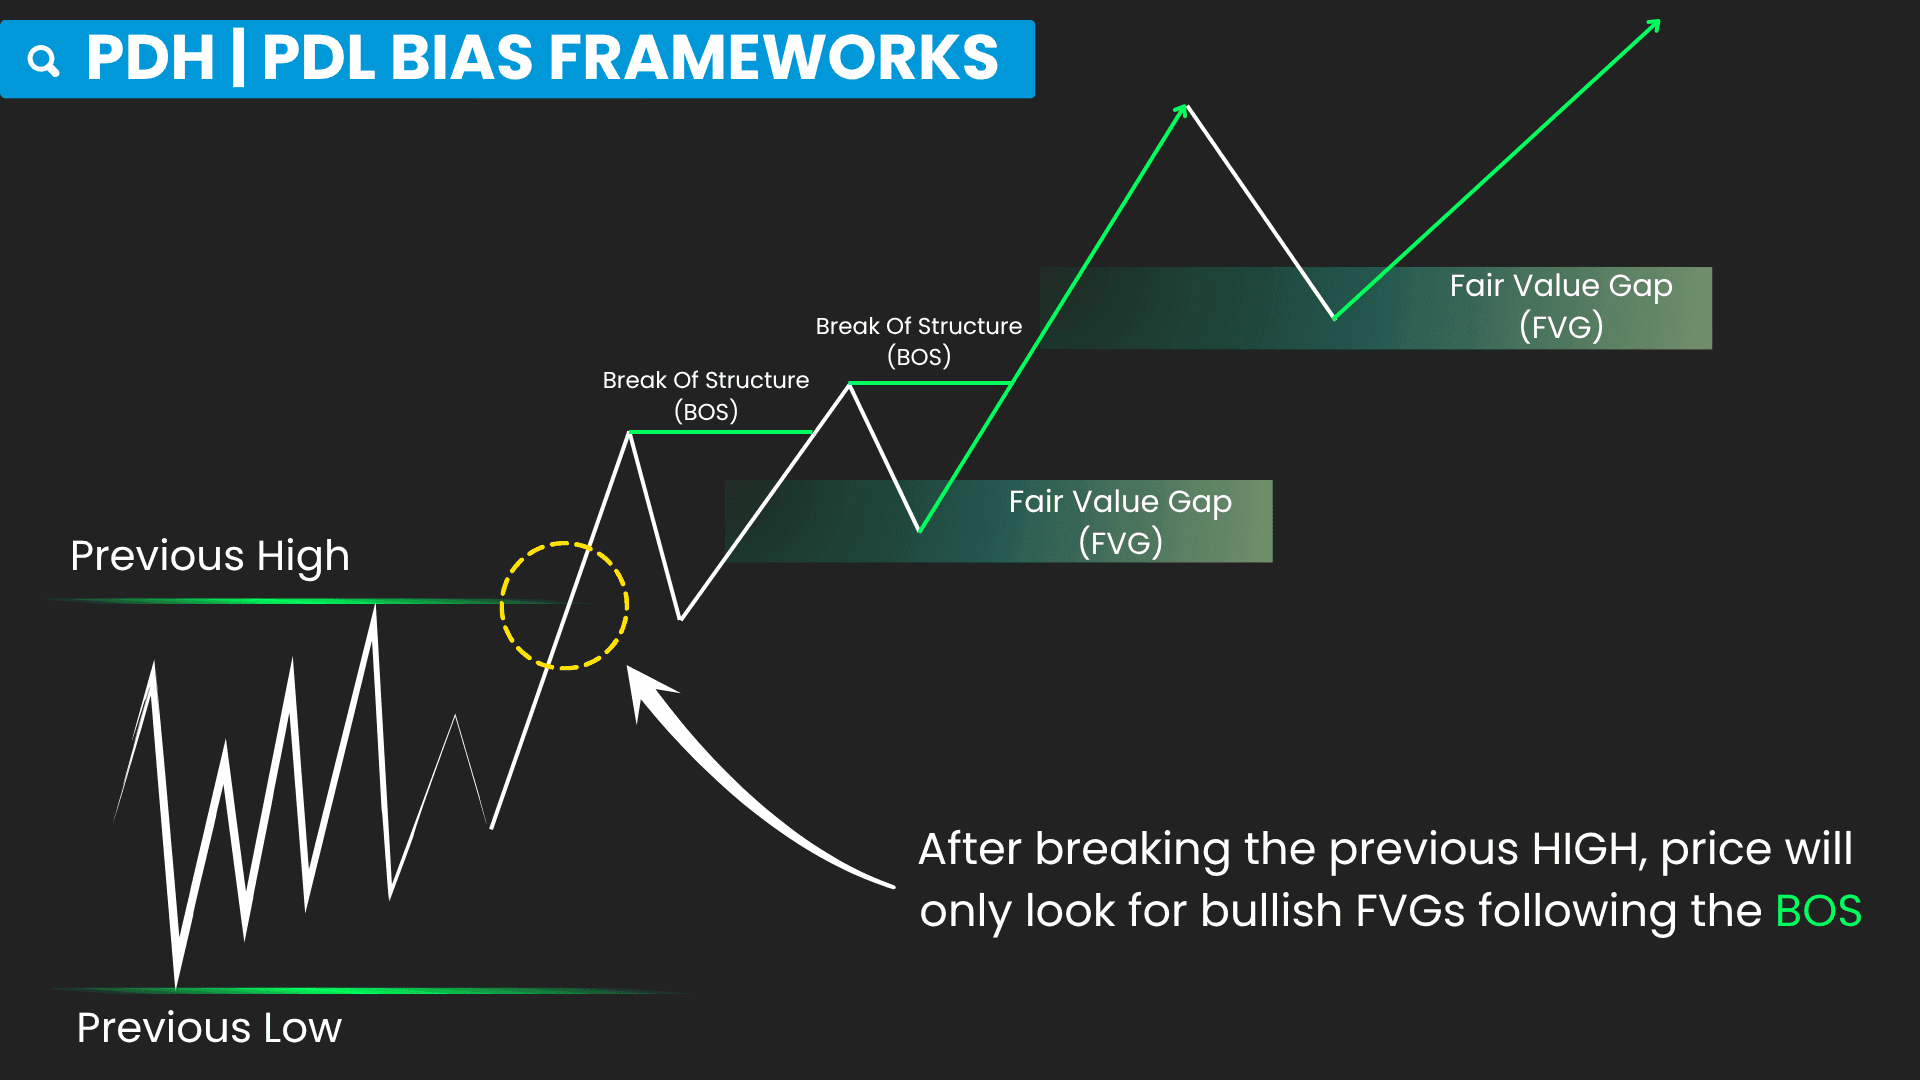
Liquidity continuation tracking (PDH / PDL Bias Framework) – tracked through 5 steps:
- PDH / PDL Tracking – identifies major liquidity pools that may become future targets
- Liquidity Bias – determines whether Buy-Side or Sell-Side liquidity is currently favored
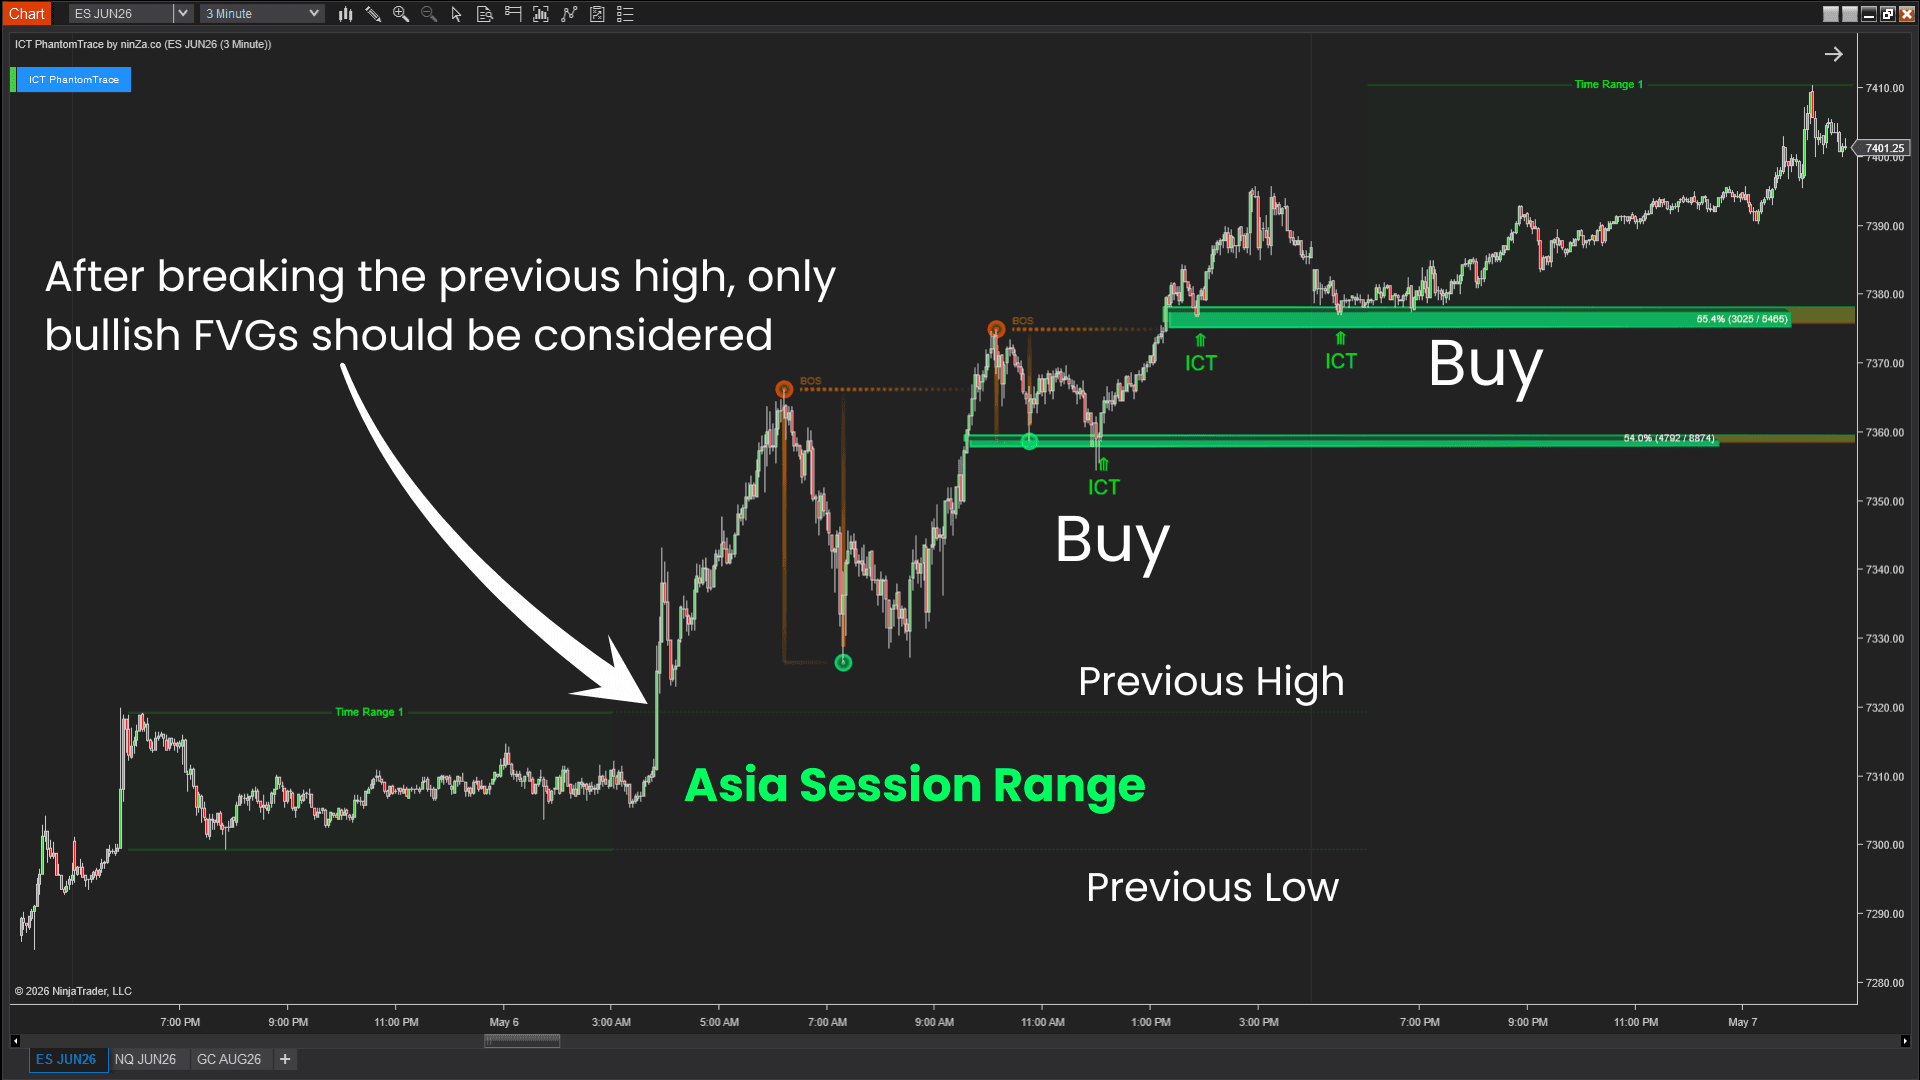
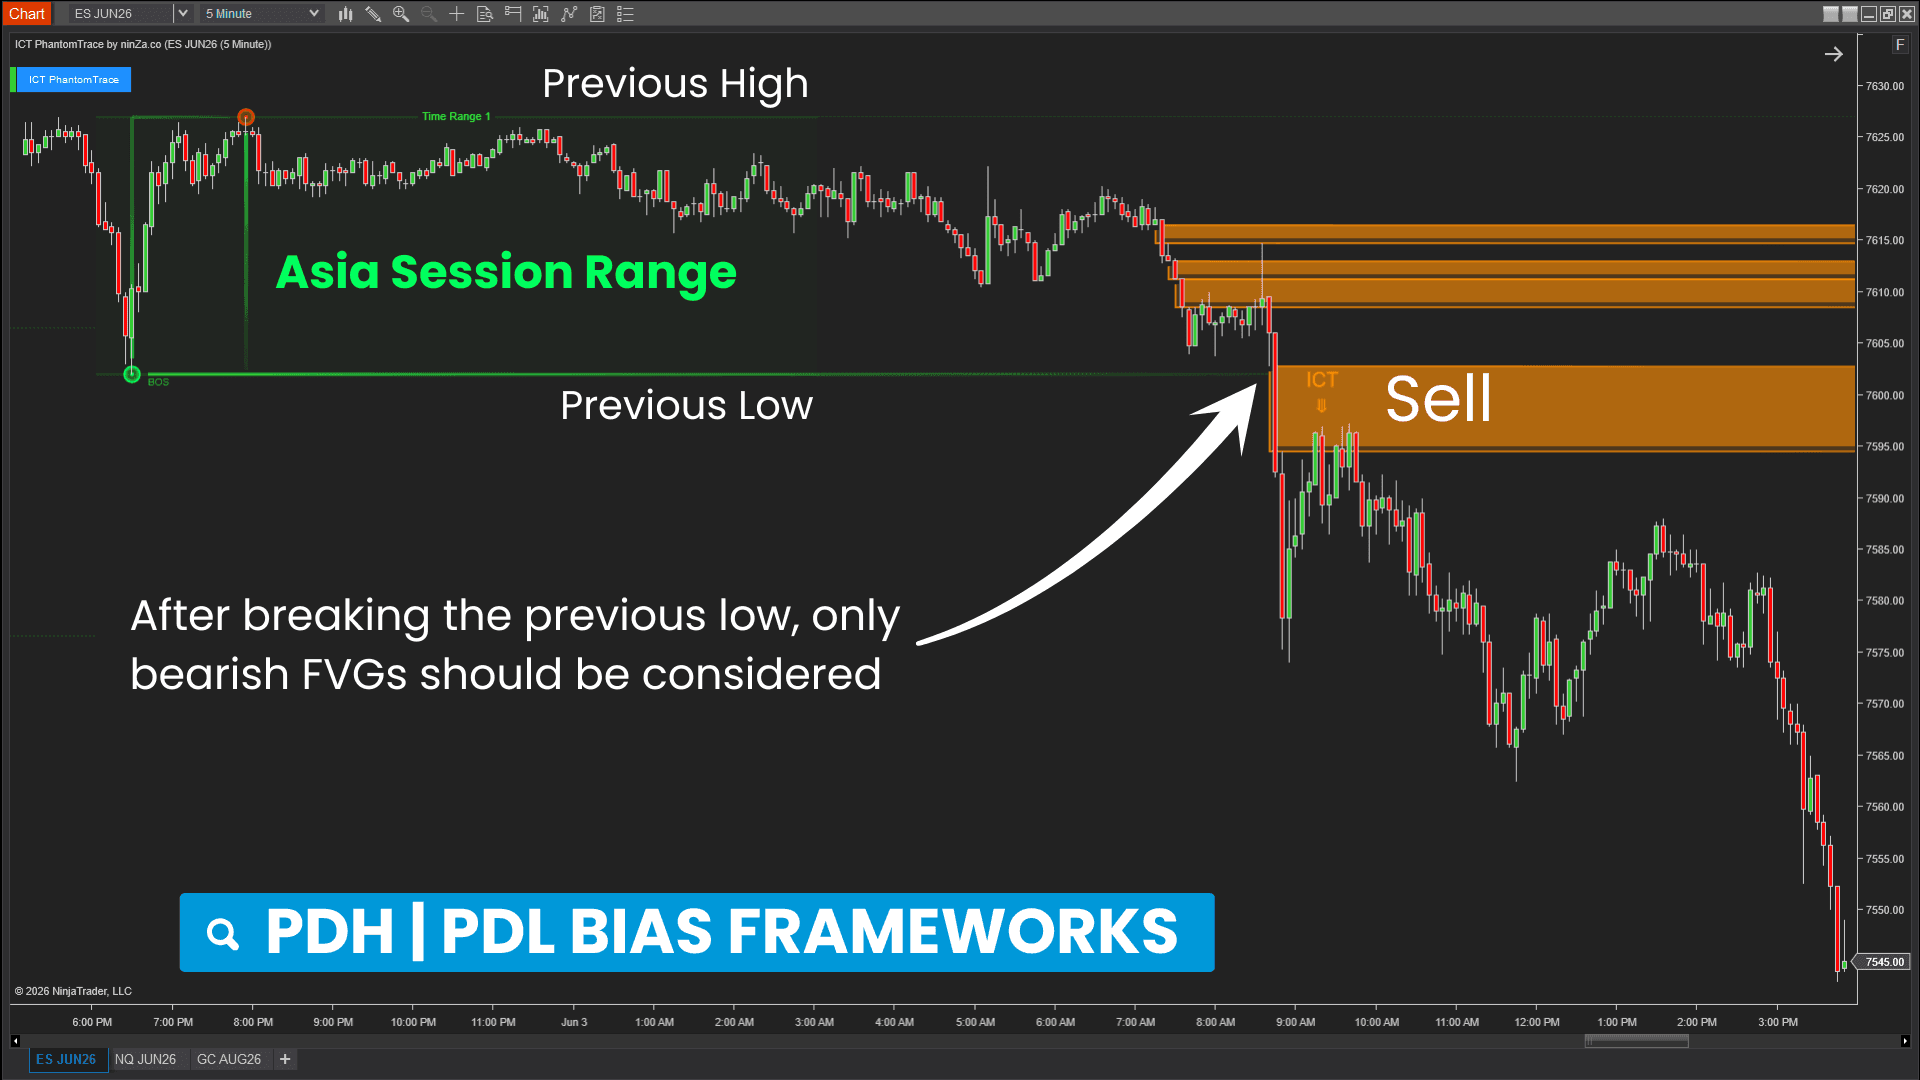
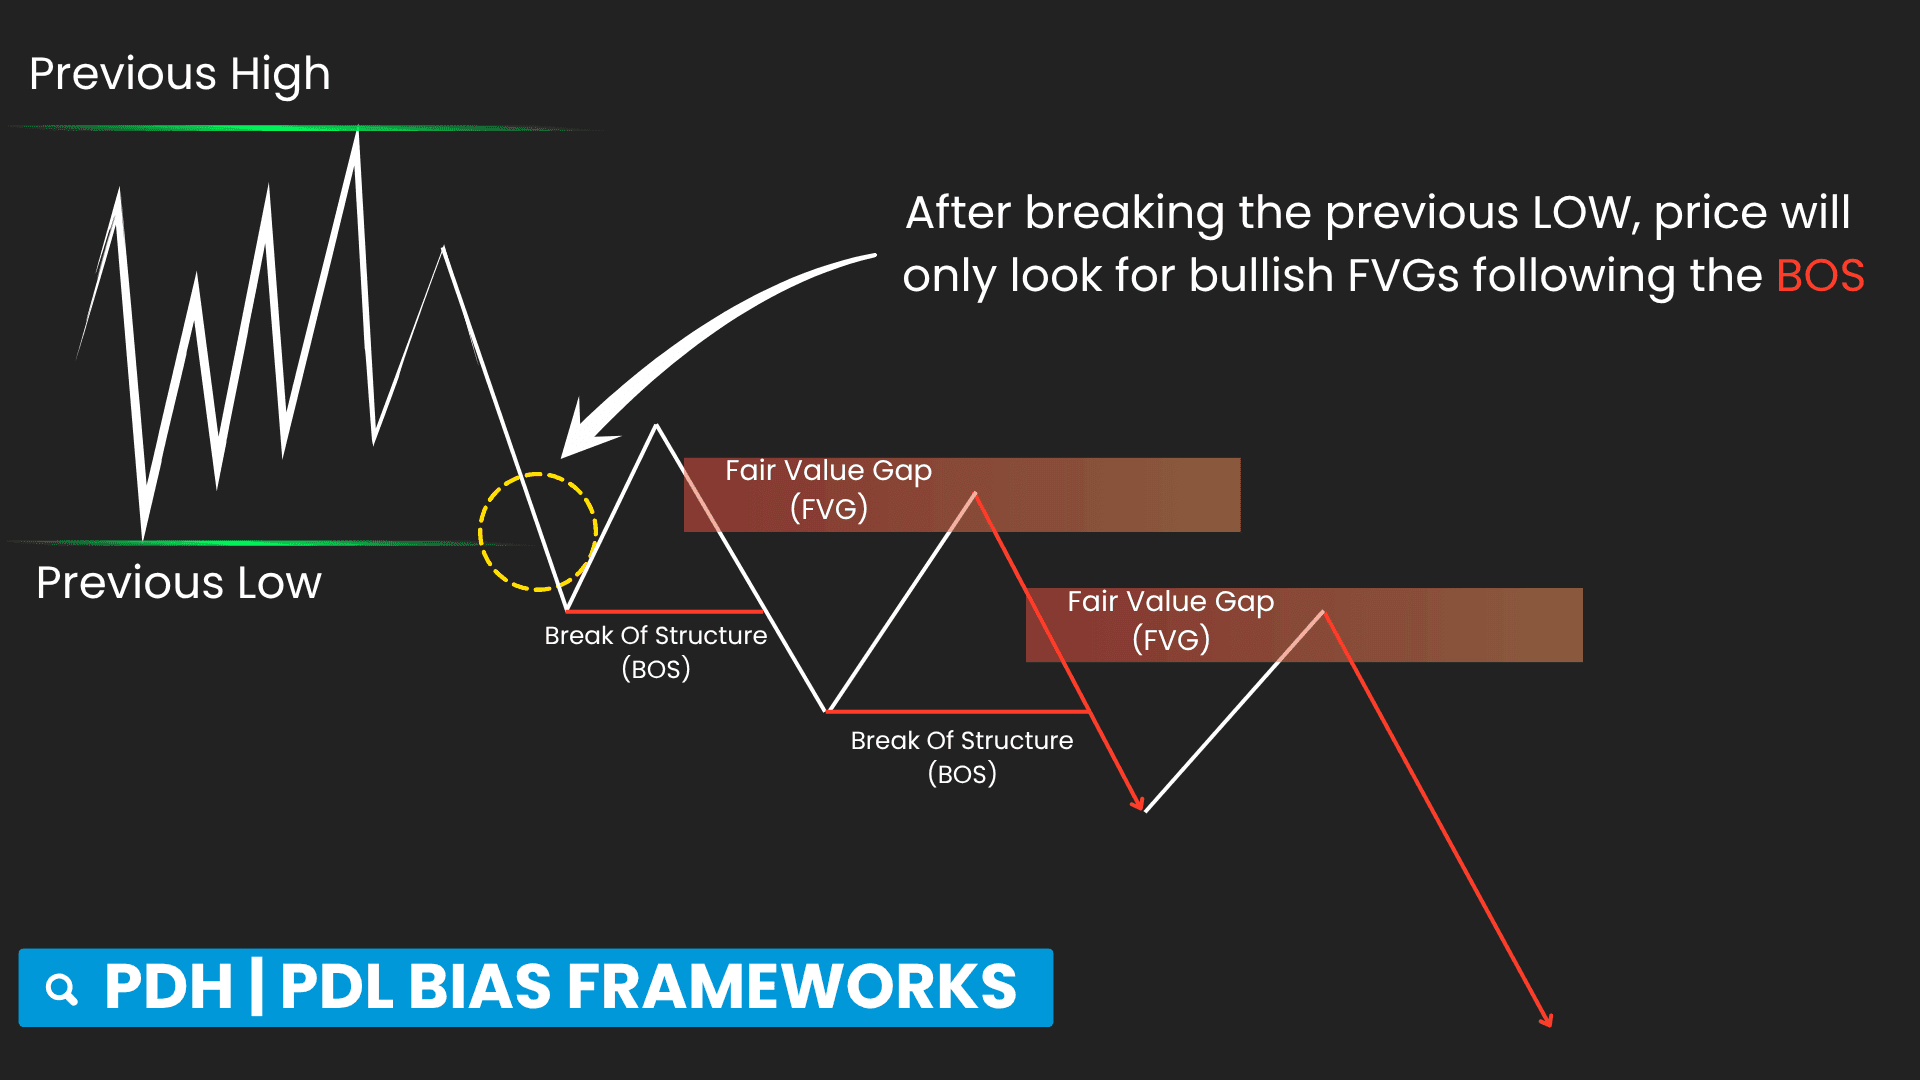
- BOS Filtering – filters continuation signals based on the active liquidity direction
- Fair Value Gap (FVG) – highlights imbalance areas aligned with the current liquidity objective
- Reaction Signal – identifies when price reacts at the Fair Value Gap in alignment with the active bias
It includes dedicated NinjaScript Signals (Signal_Trade, Signal_Zone, Signal_State) for advanced usage.
PANA Kanal highlights
PANA Kanal combines a Fibonacci algorithm with ATR to create a ribbon band that clearly identifies the trend and highlights dynamic support and resistance levels for determining signals.

- Pullback signal – appears only once in a trend. With the recommended settings, it can be spotted right at the beginning of the trend, offering higher reliability and eliminating subsequent pullback signals.
- Trailing stop line – place stops above or below it when you enter a trade.
- Target markers – clearly indicate where the indicator suggests placing your target, also marking potential future price points.
- Market structure reading – a sign that helps interpret trend momentum:
- Uptrend – market structure continuously breaks the highs
- Downtrend – market structure continuously breaks the lows
- Weakening – market structure cannot surpass its nearest peak
- Sideways – the ribbon flattens
Recognizing these conditions adds an extra layer of context and confidence while trading.


Built for cleaner trade selection
ICT PhantomTrace provides the liquidity framework. PANA Kanal provides trend confirmation, dynamic support and resistance, and clear trade-management references.
Together, they help reduce signal overload and keep attention on higher-relevance areas where liquidity behavior and trend condition are aligned.
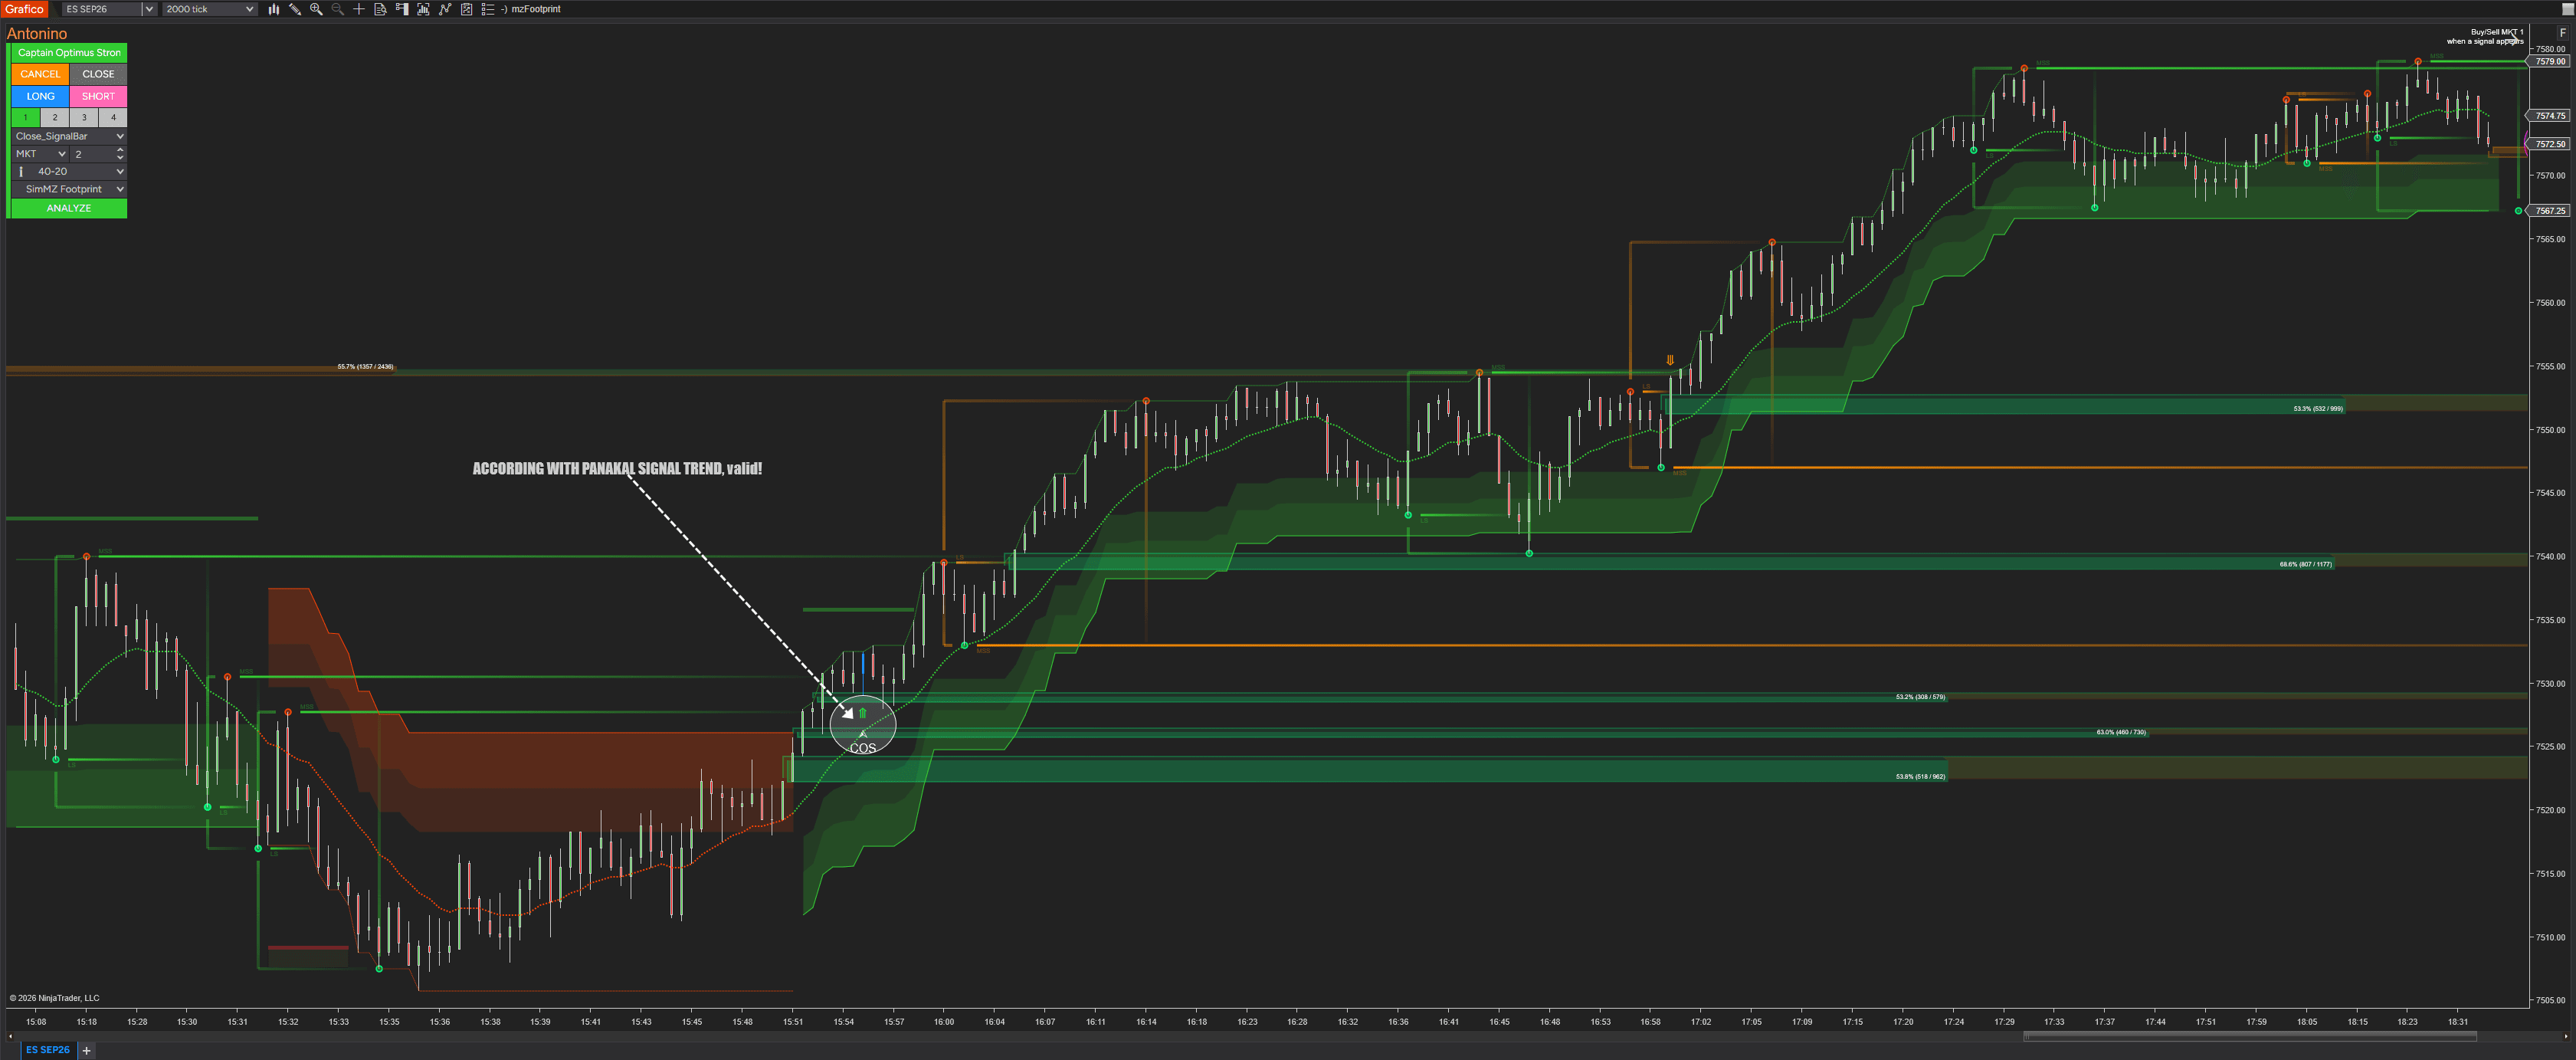
How this combo works in the real market
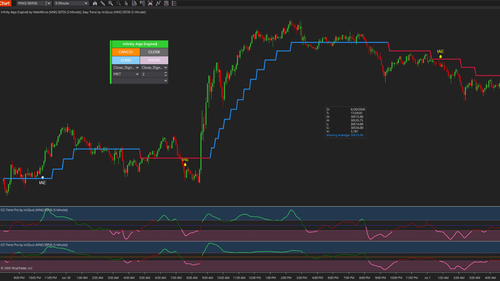
ICT PhantomTrace and PANA Kanal on the ES 2000-tick futures chart, shared by trader Antonino Venuto.
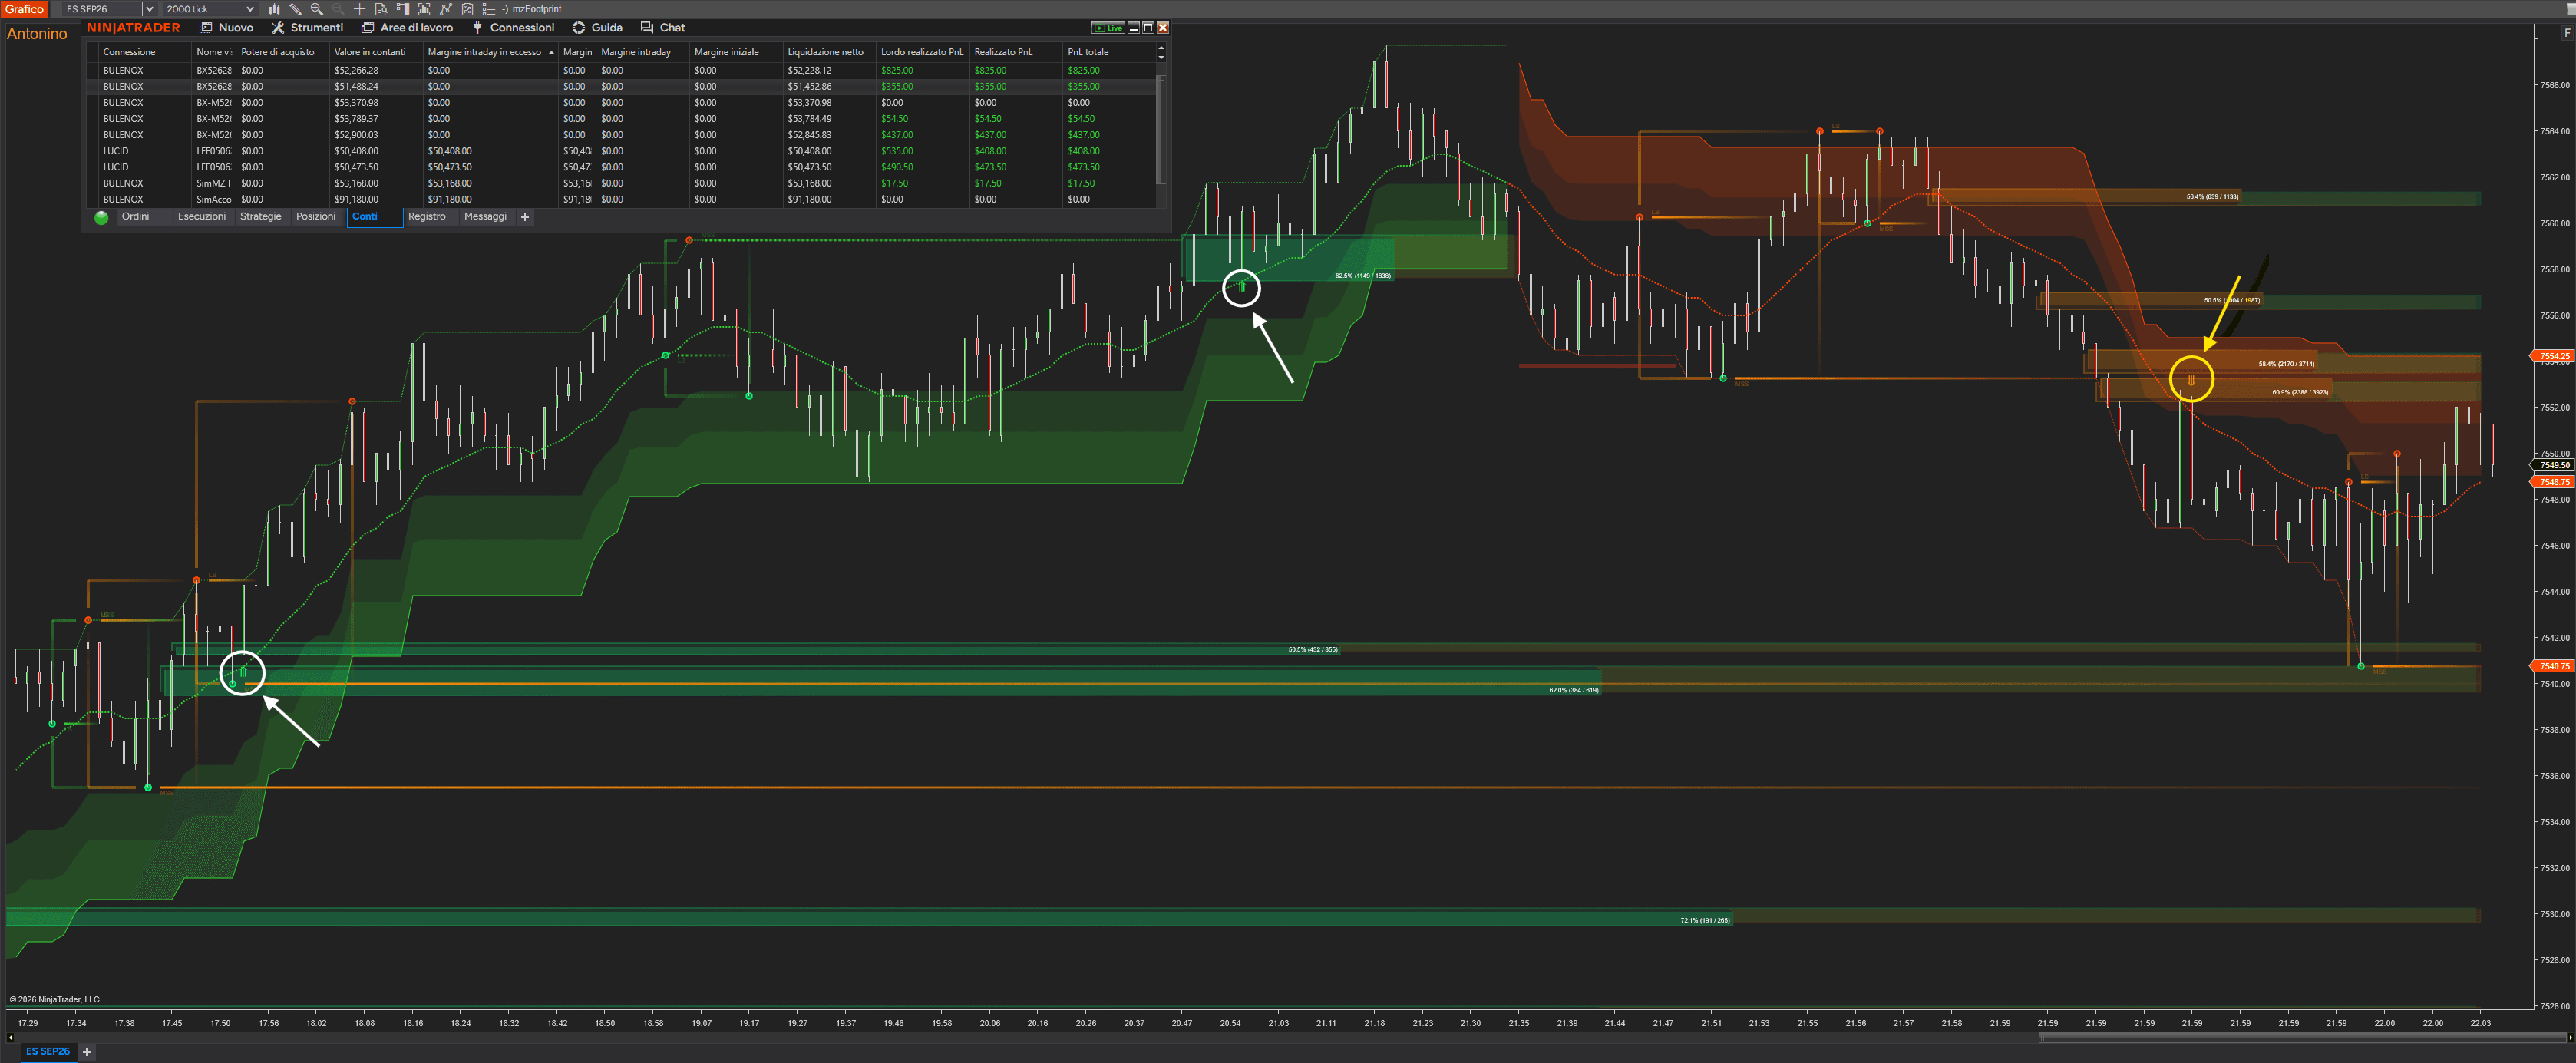
Reading the chart:
The example shows the two tools working side by side. PANA Kanal's ribbon defines the prevailing trend and its dynamic support and resistance – rising and green through the advance, then rolling over and turning orange as momentum shifts lower. ICT PhantomTrace marks the liquidity context around those moves, with its structure and Fair Value Gap references highlighting where price reacts.
Rather than acting on an isolated signal, this is the intended workflow: read the liquidity context, confirm it against the trend and the ribbon's support/resistance, and use those references to frame execution. When both layers agree – liquidity behavior pointing one way and the trend structure supporting it – the setup carries more context than either tool would provide alone.
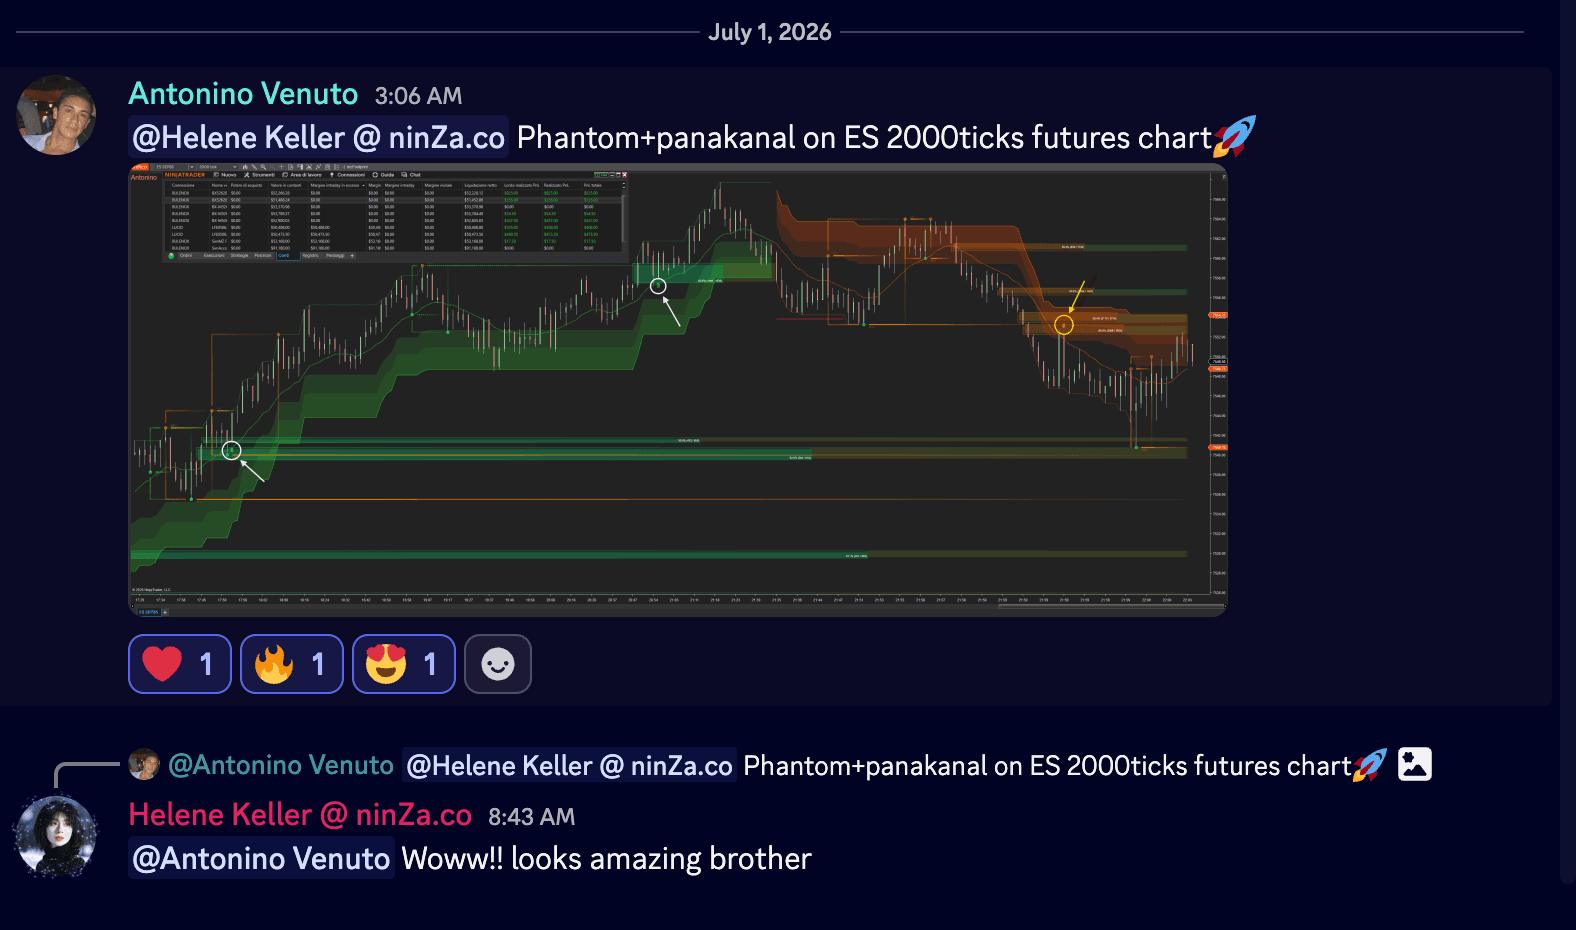
The same setup viewed across a broader session shows how the ribbon and the liquidity references hold up through multiple trend phases:
 on es 2000 ticks chart_1782985420979.png)
"ICT PhantomTrace + PANA Kanal on ES 2000ticks futures chart"
— Antonino Venuto
How a pro trader uses this combo
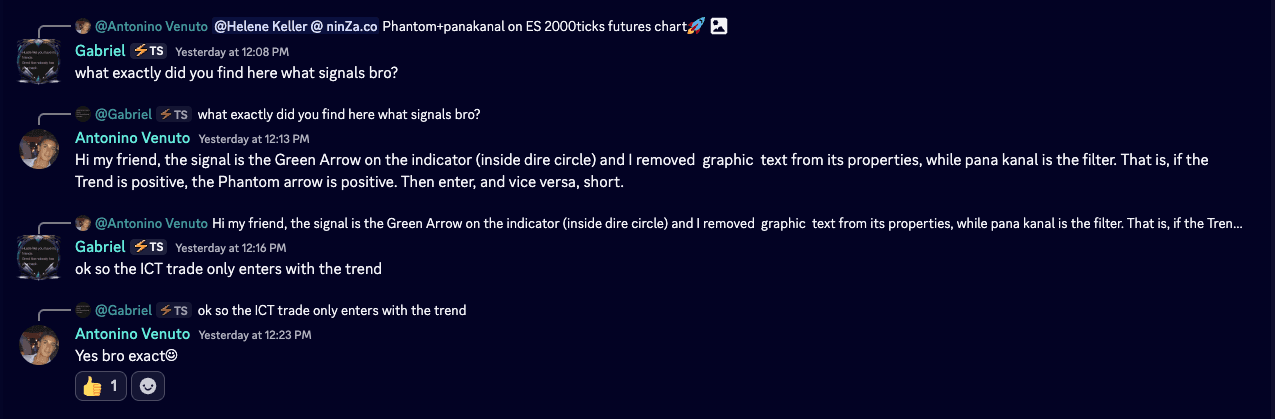
Trader Antonino Venuto shared how he applies the two tools together. His framing is straightforward: PANA Kanal is the filter and the context, and ICT PhantomTrace is the entry.
"During this summer period, given that volatility increases – intraday ranges are wider because trading books are lighter due to the summer holidays in many countries – I prefer to use ES Futures, which is more relaxed and often forgiving of errors. I use it on the 2000-tick chart. I use the template like this, but in the future I could also create a protocol where PANA Kanal is the trend, ICT PhantomTrace is the zone, and I would add a trigger indicator. In any case, here PANA Kanal is the filter, the context, and ICT PhantomTrace is the entry."
— Antonino Venuto
The rule he follows:
- PANA Kanal (filter / context) → defines the trend direction through the ribbon
- ICT PhantomTrace (entry) → the green arrow signal marks the entry
- He takes the entry only when it agrees with the trend: if the trend is positive, he acts on a positive ICT PhantomTrace arrow (long); if the trend is negative, he acts on the opposite side (short)
In his own words, the ICT PhantomTrace entry is taken only in the direction of the PANA Kanal trend.
He also confirmed he runs the combo on default settings on the ES 2000-tick chart, again describing PANA Kanal as the filter and context, and ICT PhantomTrace as the entry:
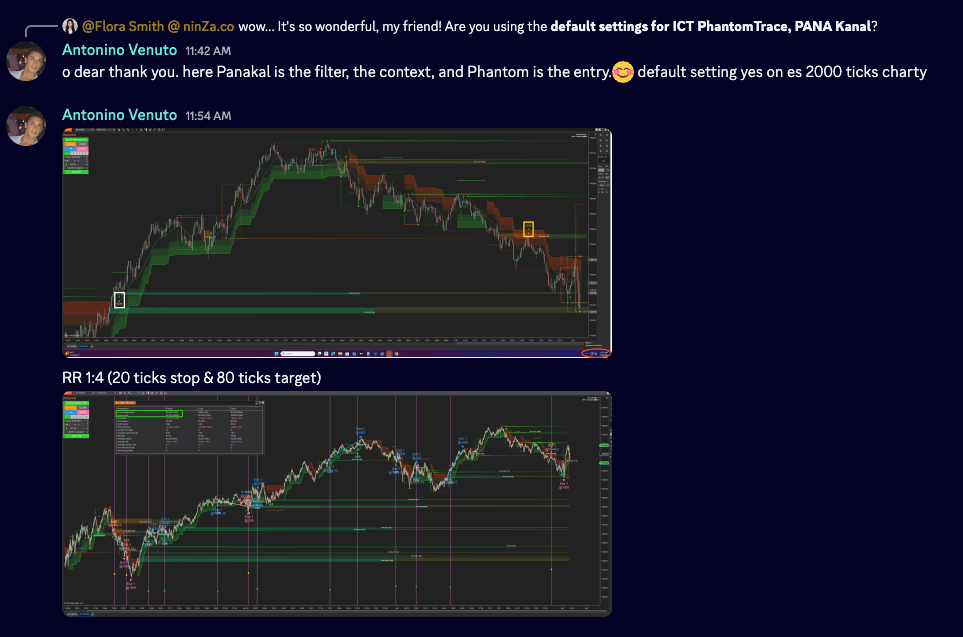
An entry aligned with the ribbon trend – marked on the chart as "according with PANA Kanal signal trend, valid":
On risk-to-reward:
He runs the setup at a defined risk-to-reward of 1:4 – a 20-tick stop and an 80-tick target – on the ES 2000-tick chart. Defining the stop and target in advance keeps each trade within a fixed, repeatable structure.
 on es 2000 ticks chart_1782985670187.png)
The chart above reflects a backtest window on historical data. Backtested and hypothetical results have inherent limitations and are not a guarantee of future performance. This material is for informational purposes and is not financial advice; trading futures carries substantial risk.
Combo offer
Access ICT PhantomTrace and PANA Kanal together in this combo.
- ICT PhantomTrace: $550 value
- PANA Kanal: $600 value
→ Access the combo today: $400
Product Media
These media materials may have been recorded/captured in favorable markets. Please review our “acceptable marketing practices”.
Images
From Happy Customers
by M.
Indicators Improved My Charts. Hannah's Help And Great Customer Service. Will Buy Again.
I have been using the ninZa.co indicators for several months now and am very happy with what a valuable addition they have been to my charts. I recently decided to add one of the recently released indicators from ninZa.co. But after using for a few days, it wasn’t quite what I had been looking for. I contacted ninZa.co and had the pleasure of working with Hannah for an exchange to a different one of the many available indicators. At the time, the indicator I wanted to purchase to replace the one I had recently bought was on sale. Hannah put through an exchange and without my having to ask, gave me the advantage of the sale price. She also included a pdf that provided education about the indicator I chose to switch to. Any time I have had contact with one of the associates from ninZa.co, I have received excellent customer service, and will not hesitate to purchase from them again.
by Bartosz
Grace Goes Above And Beyond: A Customer Support Experience That Exceeds Expectations!
Thank You, Grace! Your support is extraordinary I wish all companies have such great support. Keep going I’m 200% satisfied.
by Kari L.
ConnorsRSI Pro With Grace's Outstanding Customer Service
Thank you very much for your excellent customer service, Grace! You are doing an excellent job making customers' lives much easier.
by T.
An Exemplary Customer Experience At NinZa.Co: Unveiling The Power Of Cumulative Delta
I'm a new customer with ninZa.co and i was needing help today in making a purchase. I made a request on your chat platform and Hannah came to my rescue. She helped me find the what I needed and even offered me a discount. Everything went very smoothly from that point. I made the purchase and she even provided me some documentation on the indicator. I am very pleased with her assistance. Thanks again Hannah for your excellent customer service !!

ninZa.co Indicators
0 online
What indicator, system, or feature should we build next?
Tell us what you need →

Complete ICT workflow explained by James Buchman
🎬Watch webinar replay