

NINZA Columbus Day Sale 2026 – Bundle Builder
The larger the bundle, the better the value
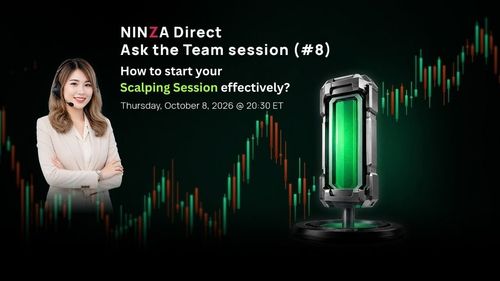
NINZA Direct: Ask the Team session (#8)
How to start your Scalping Session effectively?
_1791367956213.jpg)
FLAMINGO
One trading framework. Two ways to trade.
![[New flagship Renko system] Poseidon Trident —E](https://forestcms.nyc3.digitaloceanspaces.com/media/small_Poseidon Trident —E banner_1789461376412.jpg)
[New flagship Renko system] Poseidon Trident —E
Catch the Sniper Entry. Ride the Strongest Waves.

We hit the limits. So we built ZillaTrader.
A new research & trading platform, built on 12+ years of experience.
Coming November 2026.
Renko Charts Explained: A Trader's Guide
Key takeaways
- Renko charts plot price movement in fixed-size bricks and ignore time, which strips out small fluctuations and makes trends easier to read.
- Brick size is the single most important setting: a fixed value gives consistency, while an ATR-based size adapts to each instrument's volatility.
- Renko lags on reversals because a turn needs roughly two bricks of movement to confirm, so it rewards trend following and punishes choppy ranges.
- Only act on completed bricks. The developing brick can repaint, and ATR-based sizes can recalculate when a chart reloads.
- On NinjaTrader, renko works best paired with a position sizing plan so a late reversal signal never turns into an outsized loss.
Renko charts replace the usual time-based bars with fixed-size bricks that print only when price moves a set amount, which filters out small wiggles and leaves a clean view of direction. That trade-off is the whole story: you gain clarity and lose detail, so the chart is excellent for reading trends and weaker for timing fast reversals.
This guide covers what renko bricks are, how to set brick size without guessing, how renko compares with candlesticks, and how to trade renko on NinjaTrader while avoiding the mistakes that catch new users.
What Renko Bars Are and How They Filter Noise
A renko chart is built from bricks of equal price size. A new brick appears only when price moves the full brick amount in one direction, so time and volume play no role in how the chart is drawn. The name comes from the Japanese word for brick.
Each brick sits at a 45-degree angle, either up or down, and never beside the previous one. Because a move smaller than the brick size produces nothing, the minor back-and-forth that clutters a one-minute candle chart simply vanishes. What remains is the skeleton of the trend.
That filtering is the main appeal. In a choppy session, a candle chart flashes dozens of tiny reversals. The same session on a renko chart might show one steady run of green bricks, then a block of red. Traders who struggle with overtrading often find renko calms the screen and the urge to click.
The cost of that calm is information. A renko brick hides how long the move took, how much volume traded, and where price spiked intrabar. A ten-tick brick that formed in four seconds looks identical to one that took two hours. For context on how much each move actually risks, pair renko with a clear sizing method like the one in our guide to calculating position size for futures trading.
Setting Brick Size the Right Way
Brick size is the one setting that decides everything else about a renko chart. Too small and the noise you wanted to remove creeps back in. Too large and the chart lags so far behind that signals arrive after the move is spent. There are two common ways to choose it.
The traditional method uses a fixed value: a set number of points, ticks, or dollars, such as ten ticks on a futures contract. Fixed size gives consistent, repeatable bricks, which helps when you compare charts or build a rule-based plan. The drawback is that one value rarely suits every instrument, so you retune it whenever volatility shifts.
The second method ties brick size to Average True Range, usually a 14-period ATR. The brick then scales with volatility: wider in fast markets, tighter in quiet ones. ATR sizing removes most of the manual tuning and travels well across different contracts. Its weakness is that the computed size can change when the chart reloads, which can redraw past bricks.
A practical starting point: load an ATR-based brick, note the value it produces, then test a fixed brick near that number. Watch how each reacts over a few sessions and keep the one that matches your holding time. Day traders lean toward smaller bricks; swing traders prefer larger ones that ignore intraday churn.
Pros and Cons Versus Candlestick Charts
Renko and candlesticks answer different questions, so comparing them is really about matching the chart to the job. Candlesticks preserve time, open, high, low, close, and volume. Renko throws most of that away to isolate direction. Each choice has clear strengths and real costs.
Where renko wins:
- Trends and ranges stand out, because noise below the brick size never prints.
- Support and resistance often look cleaner, since bricks cluster at round levels.
- Overnight gaps and single-tick spikes disrupt the picture far less.
- Fewer false signals in choppy conditions, which cuts whipsaw and overtrading.
Where candlesticks win:
- Time is visible, so you know whether a move took seconds or hours.
- Volume and intrabar range stay on the chart for confirmation.
- Classic candle patterns and precise entries depend on detail renko removes.
- Backtests behave more realistically, because renko assumes fills at exact brick prices that may not have traded.
Most experienced traders do not pick a side. They run a renko chart for the trend read and a time-based chart beside it for timing and context. If you are still assembling your toolkit, our roundup of the best NinjaTrader indicators for futures traders pairs well with either chart style.
Best Strategies for Trading Renko on NinjaTrader
NinjaTrader includes a native renko bar type, so you set a brick size and the platform builds the chart with no add-on required. That native support makes it a sensible home for renko, and a few strategies suit the chart's strengths.
Trend continuation is the natural fit. Wait for a run of same-color bricks, then enter on the first pullback brick that fails to reverse the trend. Because renko already filters noise, you need fewer confirmation rules, and a simple moving average over the bricks is often enough.
Brick-count reversals work when a trend overextends. After an unusually long run of one color, a single opposite brick followed by a second can mark exhaustion. This is higher risk, because renko confirms turns slowly, so keep size small and define your stop before you enter.
Breakout trading also translates cleanly. Mark a consolidation where bricks alternate color in a tight band, then act when a brick closes decisively outside it. The flat band on a renko chart is usually easier to spot than the same range buried in candles.
Whatever the setup, renko's slow reversals mean your sizing has to absorb a late exit. Position each trade so a delayed signal is an annoyance, not an account event, using a repeatable formula rather than a gut feel. Ninza's position sizing tools for NinjaTrader are built for exactly that job, turning your stop distance and risk limit into an order size automatically.
When Renko Helps and When It Misleads
Renko helps most in trending markets and hurts most in fast, two-sided ones. The same filtering that produces clean trends also delays reversal signals, because a turn needs about two bricks of movement to confirm. In a sharp V-shaped reversal, that lag can hand back a chunk of an otherwise good trade.
The bigger trap is trusting a brick that has not finished. The current brick keeps updating until price clears the full threshold, so it can appear, grow, and disappear. Acting on that developing brick is one of the most common renko mistakes. Treat only closed bricks as real.
A second trap is backtest fantasy. Historical renko is drawn with perfect hindsight at exact brick prices, and ATR-based sizes may recompute when you reload the chart. A strategy that looks flawless on past bricks can behave very differently live, where fills and timing are messier. Validate any renko system against tick or time-based data before you risk money.
Renko is a lens, not an oracle. It makes trend structure obvious and quiets the noise that drives overtrading, yet it stays silent about time, volume, and the exact moment a turn begins. Use it to read direction, confirm timing on a standard chart, and let your position sizing cover the lag it builds in.
The next step is practical: open a renko chart on a market you already trade, set an ATR-based brick, and watch it beside your usual candles for a week before changing anything about how you enter. You will learn more from that side-by-side comparison than from any single setting, and you will know quickly whether renko suits the way you trade.
For a broader reference on the method's history and construction, the Renko chart entry on Wikipedia is a neutral starting point.
Frequently asked questions
What is a renko chart in simple terms?
A renko chart draws a new brick only when price moves a set amount, such as 10 ticks. Bricks ignore time and volume, so the chart shows pure price direction and filters out minor noise.
How do I set the right brick size?
Start with an ATR-based size so the brick adapts to the instrument's volatility, then compare it against a fixed size on the same chart. Smaller bricks react faster but add noise; larger bricks smooth trends but add lag.
Can you trade renko charts for day trading?
Yes, many futures day traders use renko intraday. Use a smaller brick for faster signals, trade only completed bricks, and confirm with a time-based chart so you understand the real timing behind each brick.
Why do renko bricks sometimes change or disappear?
The current brick is still forming until price clears the full brick threshold, so it can repaint. ATR-based brick sizes can also recalculate on reload, which redraws history. Trust closed bricks only.
Is renko better than candlesticks?
Neither is better overall. Renko is cleaner for spotting trends and support or resistance, while candlesticks preserve time, volume, and intrabar detail. Many traders read both side by side.
Download ~ 40 FREE indicators & reach more useful resources !!!
LIVE Intraday Trading | Stop chasing Early Entries. Let Timing guide your entry →

ninZa.co Indicators
0 online
_1787026707358.svg)
NINZA is an official member of NinjaTrader Ecosystem together with 600+ industry-leading professionals that provide traders with quality trading products & services.




even more payment methods
Quick Links
Instructions
Support
Resources & Information
© Copyright 2026 All Rights Reserved



Because software products may be copied and stored easily, we will NOT issue refunds of any kind. ALL SALES ARE FINAL & NON-REFUNDABLE!
Futures, foreign currency, and options trading contains substantial risk and is not for every investor. An investor could potentially lose all or more than the initial investment. Risk capital is money that can be lost without jeopardizing one's financial security or lifestyle. Only risk capital should be used for trading and only those with sufficient risk capital should consider trading. Past performance is not necessarily indicative of future results.
Hypothetical performance results have many inherent limitations, some of which are described below. No representation is being made that any account will or is likely to achieve profits or losses similar to those shown; in fact, there are frequently sharp differences between hypothetical performance results and the actual results subsequently achieved by any particular trading program. One of the limitations of hypothetical performance results is that they are generally prepared with the benefit of hindsight. In addition, hypothetical trading does not involve financial risk, and no hypothetical trading record can completely account for the impact of financial risk of actual trading. For example, the ability to withstand losses or to adhere to a particular trading program in spite of trading losses are material points which can also adversely affect actual trading results. There are numerous other factors related to the markets in general or to the implementation of any specific trading program which cannot be fully accounted for in the preparation of hypothetical performance results and all which can adversely affect trading results.
NinjaTrader® is a registered trademark of NinjaTrader Group, LLC. No NinjaTrader company has any affiliation with the owner, developer, or provider of the products or services described herein, or any interest, ownership or otherwise, in any such product or service, or endorses, recommends or approves any such product or service.