
Zuture Flex
Access premium trading products with more payment flexibility
![[Auction Δxis] A comprehensive overview of Auction Δxis](https://forestcms.nyc3.digitaloceanspaces.com/media/small_Thumbnail New release Auction ∆XIS_1784002540029.jpg)
[Auction Δxis] A comprehensive overview of Auction Δxis
Support & Resistance is not a property of indicators. It is a property of the market itself.
_1784001871922.jpg)
Summer Privilege event
More flexibility for your next trading upgrade
Receive up to $500 in Voucher-F
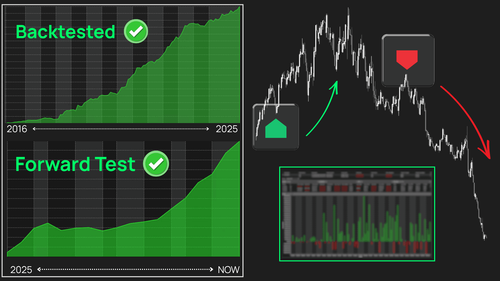
Review the optimized backtest results
- $48,000+ backtested profit for the funded account template.
- $3,200+ backtested profit on MNQ over the last four months.
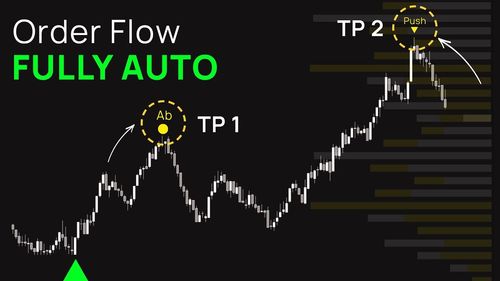
Fully Automated Order Flow
Enter with confirmed Order Flow strength. Exit when the edge starts to fade.
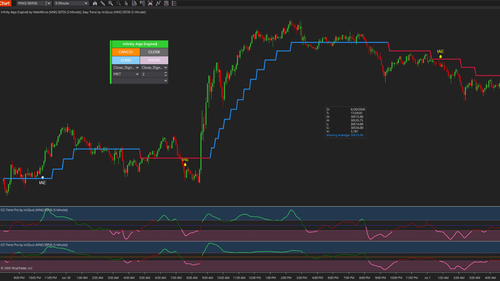
2 indicators. 1 structured CCI workflow
Double CCI combines CCI Trend Pro and Easy Trend into one structured CCI workflow
![[July Exclusive] Liberty Edge Bundle](https://forestcms.nyc3.digitaloceanspaces.com/media/small_liberty-edge-bundle-hdhdh_1783139262484.png)
[July Exclusive] Liberty Edge Bundle
From market analysis to trade execution — in one structured workflow.
How to Determine Overbought and Oversold Levels in Trading
Overbought and oversold are key terms traders use to describe when an asset’s price may have moved too far in one direction.
- Overbought suggests excessive buying and a potential pullback.
- Oversold signals excessive selling and a possible rebound.
Traders often use overbought/oversold indicators like the Relative Strength Index (RSI), Stochastic Oscillator, and Money Flow Index (MFI) to determine these conditions accurately. Understanding how to read these signals can help you spot potential market reversals and make better-informed trading decisions.
In this guide, you’ll learn step-by-step how to determine overbought and oversold zones, how each indicator works, and practical examples to apply these signals on real charts.
1. What does Overbought and Oversold mean?
Overbought and oversold are terms used to describe conditions where the price of an asset has moved too far in one direction and may be due for a reversal or pause.
- Overbought occurs when an asset’s price has risen rapidly and reached a level considered higher than its normal or sustainable range. This often indicates that buying momentum may be weakening, and the price could soon experience a pullback or correction.
- Oversold is the opposite condition, where the price has dropped sharply and fallen below what is considered its fair or typical value. This suggests selling pressure might be overdone, increasing the chance for the price to bounce back or reverse upward.
The key difference between Overbought and Oversold lies in the direction of market momentum and the potential risk it signals.
An Overbought condition occurs when the price has risen rapidly and buyers are dominating the market, suggesting that upward momentum may be running out and a pullback or sideways movement could follow.
In contrast, an Oversold condition happens when the price has fallen sharply and sellers are in control, indicating that downward momentum may be slowing and a rebound or consolidation could be near.
In short, Overbought highlights the risk of prices being stretched to the upside, while Oversold points to the risk of prices being stretched to the downside. Both conditions are not guarantees of immediate reversals but serve as warnings that the current trend may be losing strength.
2. How to determine overbought and oversold
There are several common methods traders use to determine overbought and oversold, including oscillators, price action and candlestick patterns, volume analysis, and moving averages or bands. Among these, oscillators are the most popular and widely accepted approach.
In this blog, we’ll focus on three of the most common overbought and oversold indicators: Relative Strength Index (RSI), Stochastic Oscillator, and Money Flow Index (MFI).
We’ll begin by showing how each one signals overbought and oversold situations, then explain the key components of oscillators so you can interpret them confidently on your charts.
2.1. Identify Overbought conditions using RSI, Stochastic, MFI
Traders often use specific indicator levels to spot when the market may be Overbought. These levels serve as practical reference points, though they can be adjusted based on individual trading strategies.
Relative Strength Index (RSI): Among all overbought and oversold oscillators, RSI remains as one of the most reliable tools for spotting momentum extremes.
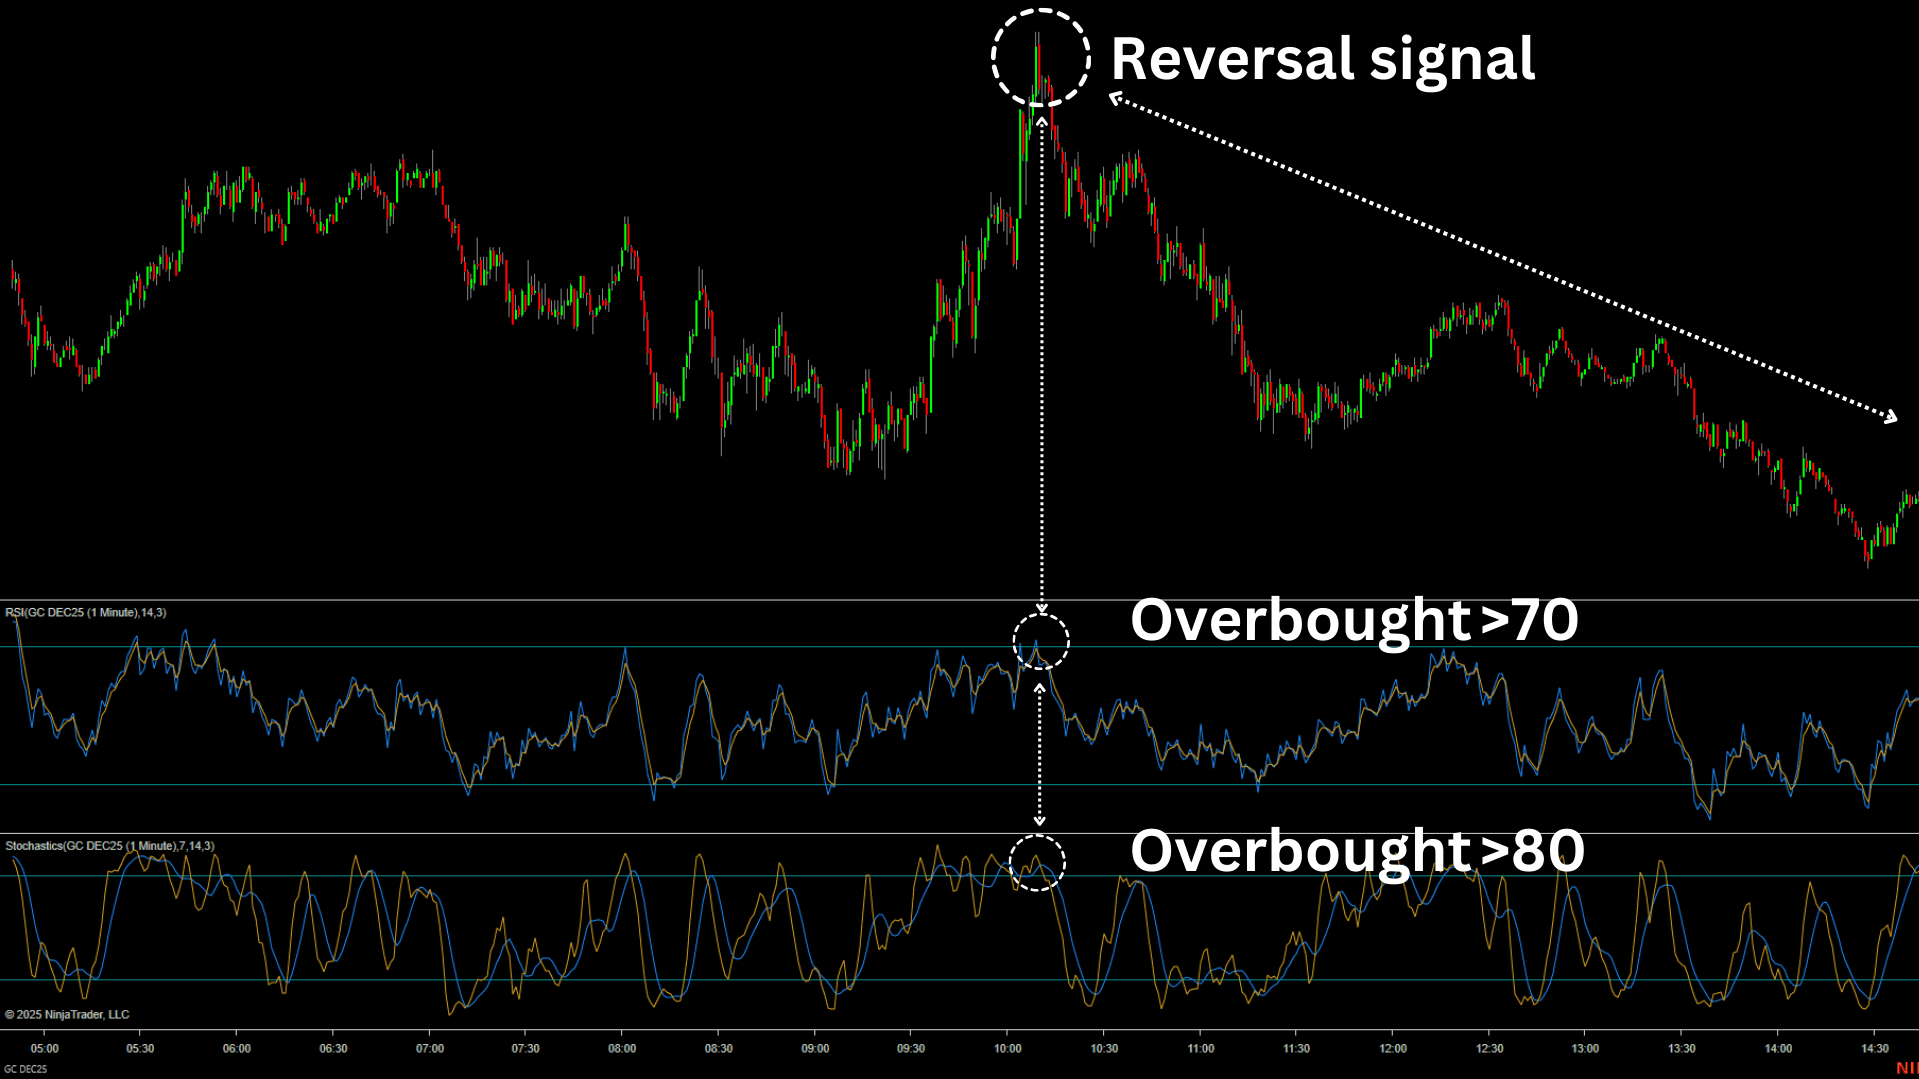
Typically, an RSI reading above 70 is considered Overbought, meaning the price has risen significantly in a short period and buyers are becoming overly aggressive.
In this condition, the market may be due for a correction or a period of sideways movement.
Note: Overbought does not mean the price will reverse immediately. It simply signals that the risk of continued buying is increasing.
- When RSI moves above 70, it suggests that the market is entering an Overbought condition.
- When RSI turns back below 70, it indicates waning buying momentum, which could hint at a potential pullback.
Some more cautious traders prefer using 80 instead of 70, especially when trading in a strong trending market.
Stochastic Oscillator:
Typically, when the Stochastic is above 80, the market is considered Overbought. This means that the price has risen quickly and strongly, and buyers are becoming quite “aggressive.”
The market may be due for a pullback or a period of sideways movement.
Note: Overbought does not mean the price will reverse immediately. It simply signals that the risk of additional buying is increasing.
- When the Stochastic moves above 80, the market is in an Overbought condition.
- When the Stochastic turns back below 80, it indicates that buying momentum is weakening, which may signal an upcoming price decline.
Some traders also use the signal of %K crossing below %D to confirm Overbought, increasing the accuracy of the signal.
Money Flow Index (MFI):
A rise of MFI above 80 typically signals that the market is Overbought.
This means that the price has increased sharply, and the inflow of money is very strong. The market may soon face a pullback or enter a sideways phase.
Note: Overbought does not mean the price will reverse immediately. It simply warns that the risk of further price gains is decreasing.
- When the MFI moves above 80, it signals that the market is Overbought.
- When the MFI turns back below 80, it indicates that buying pressure is weakening and a potential price decline could follow.
Some traders also watch for divergence between MFI and price to improve reliability: for example, if the price makes a higher high but MFI makes a lower high, it is a stronger warning of a possible reversal.
2.2. Identify Oversold conditions using RSI, Stochastic, MFI
Oversold conditions are essentially the opposite of overbought signals, where selling pressure dominates. The thresholds below are widely applied, but they can be adjusted based on each trader’s approach.
Relative Strength Index (RSI):
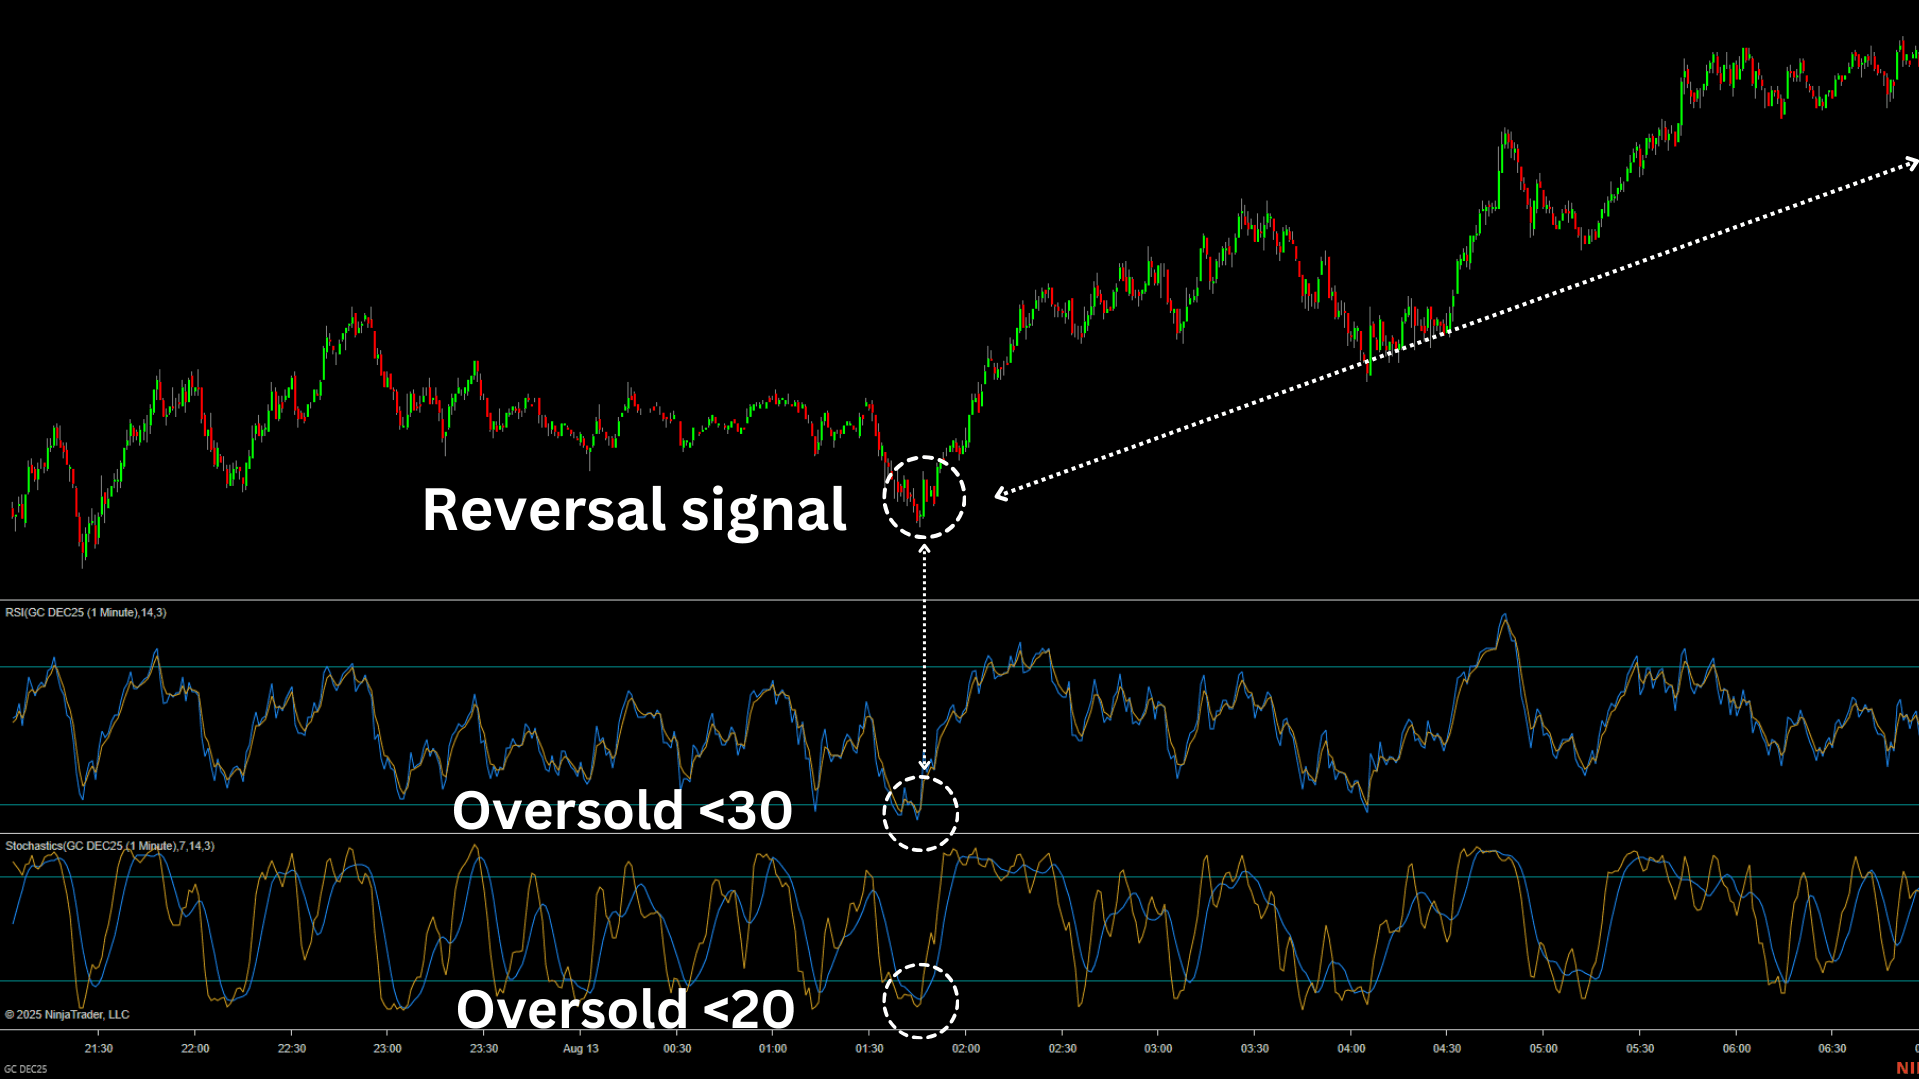
An RSI reading below 30 is generally considered Oversold. Some traders use the 20 level to confirm Oversold conditions in strongly trending markets.
This means that the price has dropped significantly in a short period, and selling pressure is becoming “excessive.” The market may be poised to pause its decline or start a rebound.
Note: Oversold does not mean the price will rise immediately. It simply signals that the risk of continued selling is increasing.
- When RSI falls below 30, it indicates the market may be Oversold.
- RSI crossing above 30 can be a sign that selling pressure is declining and the market may begin to recover.
To enhance reliability, traders often watch for RSI-price divergence, such as when the price hits a lower low but RSI records a higher low, signaling a possible rebound.
Stochastic Oscillator:
When the Stochastic drops below 20, the market is generally seen as Oversold. In strongly trending markets, some traders use 15 as a more conservative threshold to confirm Oversold conditions.
In practical terms, this means the price has fallen sharply and selling pressure is intense. The market may be ready to pause its decline or begin a rebound.
Note: Being Oversold does not mean the price will rise immediately. It simply highlights that the risk of continued selling is high.
- When the Stochastic falls below 20, it indicates that the market may be Oversold.
- When the Stochastic moves back above 20, selling pressure is easing, which could signal an upcoming price recovery.
Some traders also look for %K crossing above %D or divergence between Stochastic and price to improve reliability.
For example, if the price forms a lower low while Stochastic forms a higher low, it can warn of a potential upward reversal.
Money Flow Index (MFI):
A Stochastic reading below 20 is typically seen as Oversold. Some traders use 15 as a threshold in strong trending markets to confirm the condition.
It indicates that the price has dropped considerably and selling pressure is high, so the market might pause its decline or begin to recover.
Oversold does not mean the price will bounce immediately; it simply signals that continued selling is likely reaching its limit.
- When the Stochastic falls below 20, it indicates that the market may be Oversold.
- When the Stochastic rises back above 20, it reflects a slowdown in selling activity, often hinting at a potential upward move.
To increase the reliability of the signal, some traders look for %K crossing above %D or divergence between price and Stochastic.
For example, if the price forms a lower low while the Stochastic forms a higher low, it can signal a potential upward reversal.
2.3. Key components of oscillators for determining Overbought/Oversold
Now that you know how overbought and oversold signals look in practice, it’s important to understand the building blocks of oscillators so you can read them with more precision:
- Oscillator line(s): This is the main line or lines that fluctuate between set values, usually from 0 to 100. For example, RSI has a single line, while Stochastic has two lines called %K and %D. These lines reflect the momentum or strength of price movements.
- Overbought and Oversold levels: These are horizontal reference lines usually drawn at fixed levels, such as 70 and 30 for RSI or 80 and 20 for Stochastic and MFI. When the oscillator line moves above or below these levels, it signals potential overbought or oversold conditions.
- Crossovers: In oscillators like the Stochastic, the interaction between two lines (%K crossing %D) can provide additional trading signals, confirming entries or exits.
- Value scale: Most oscillators display a numeric scale (0 to 100), helping traders quickly see the current reading and compare it with key levels.
3. Best indicators to help you determine Overbought and Oversold
When traders want to find the best indicators to determine overbought and oversold conditions, the first tools they usually consider are RSI, Stochastic, and MFI. These classic indicators are reliable, but they can sometimes produce mixed signals when used individually.
At ninZa.co, we’ve enhanced these classics with our Superior Series: Superior RSI, Superior Stochastic, and Superior MFI. These tools are designed to provide clearer, more accurate signals, making it easier to spot potential reversals in real market conditions.
To go beyond the basics, we also developed advanced indicators that combine multiple oscillators, giving traders higher-confidence signals:
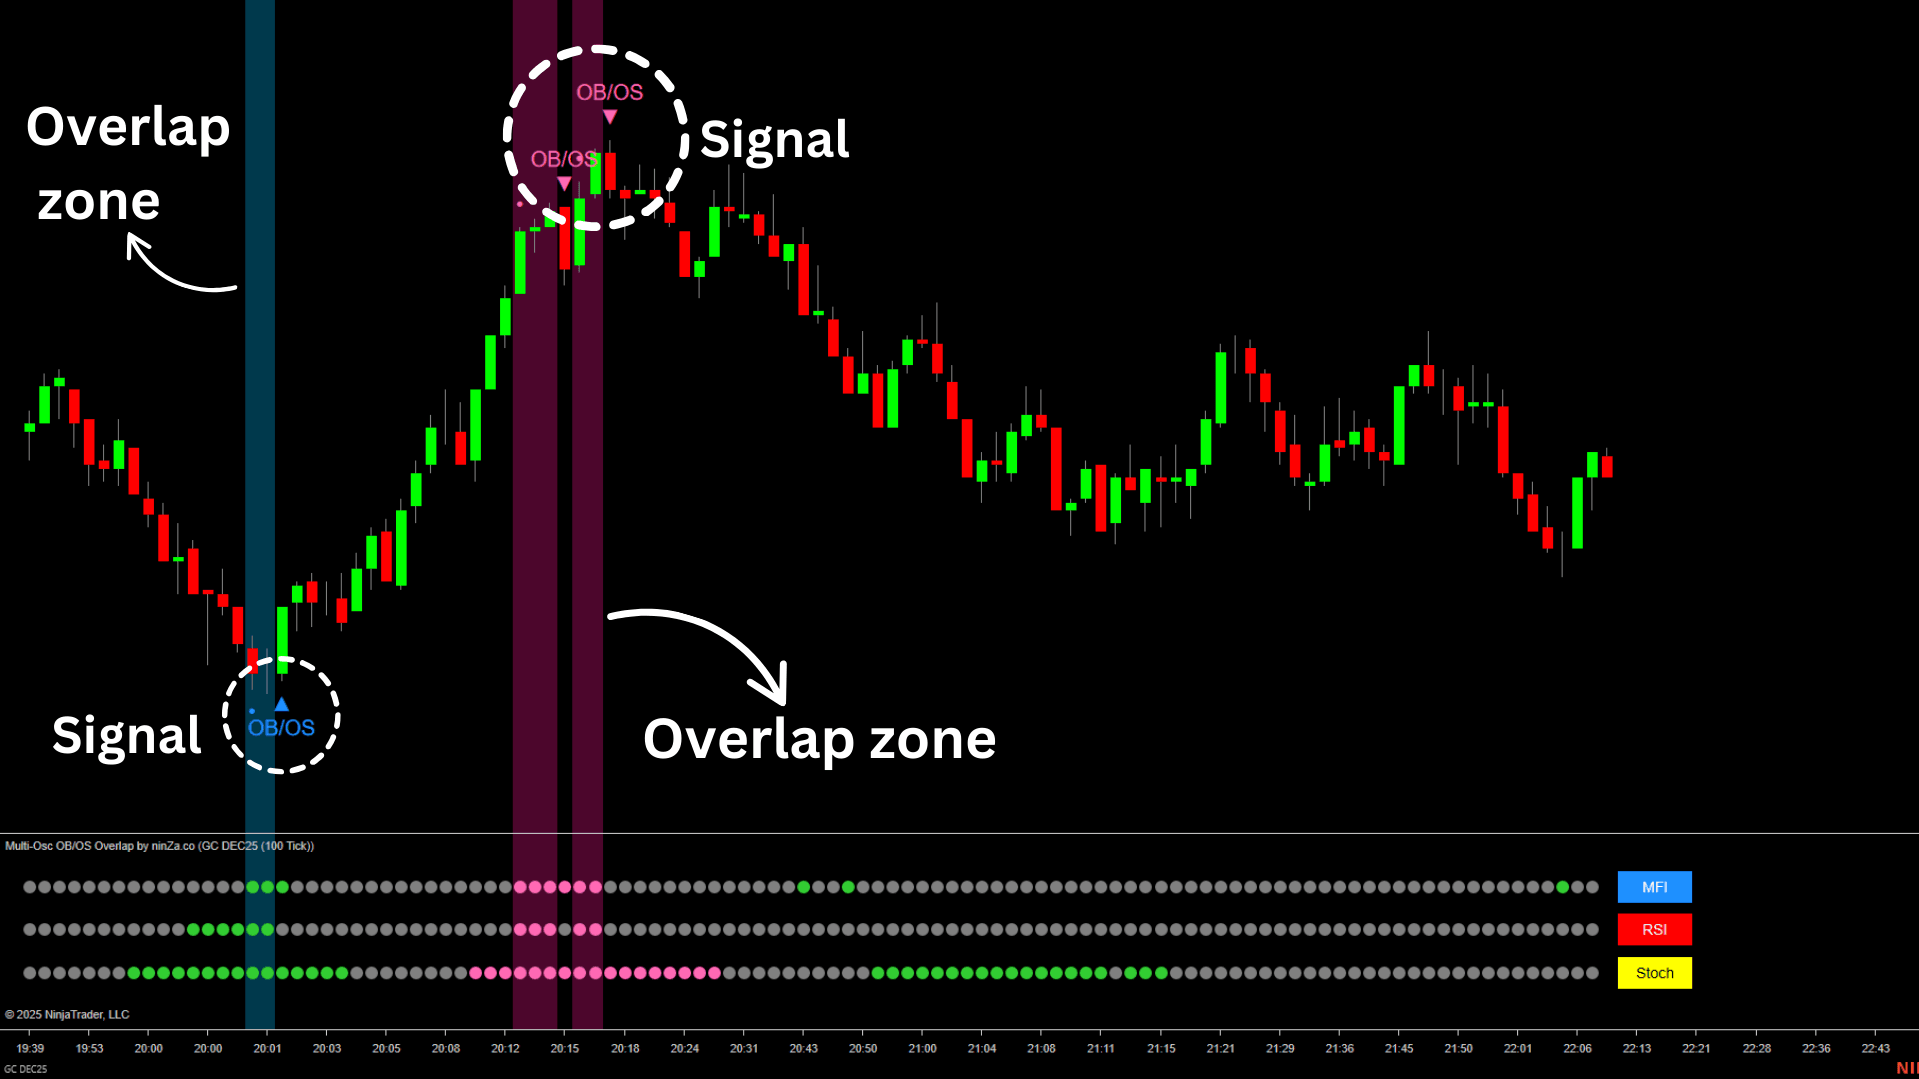
3.1. Multi-Osc OB/OS Overlap
This overbought and oversold oscillator merges RSI, Stochastic, and MFI into a single panel, highlighting where their overbought and oversold signals align.
- When multiple oscillators agree, you get higher-confidence entry and exit signals.
- This indicator eliminates the need to manually compare three separate charts, saving time and reducing confusion.
This makes Multi-Osc OB/OS Overlap one of the best indicators for identifying overbought and oversold conditions with precision.
3.2. MagnetOsc Turbo
MagnetOsc Turbo is another top choice for traders seeking reliable overbought and oversold signals.
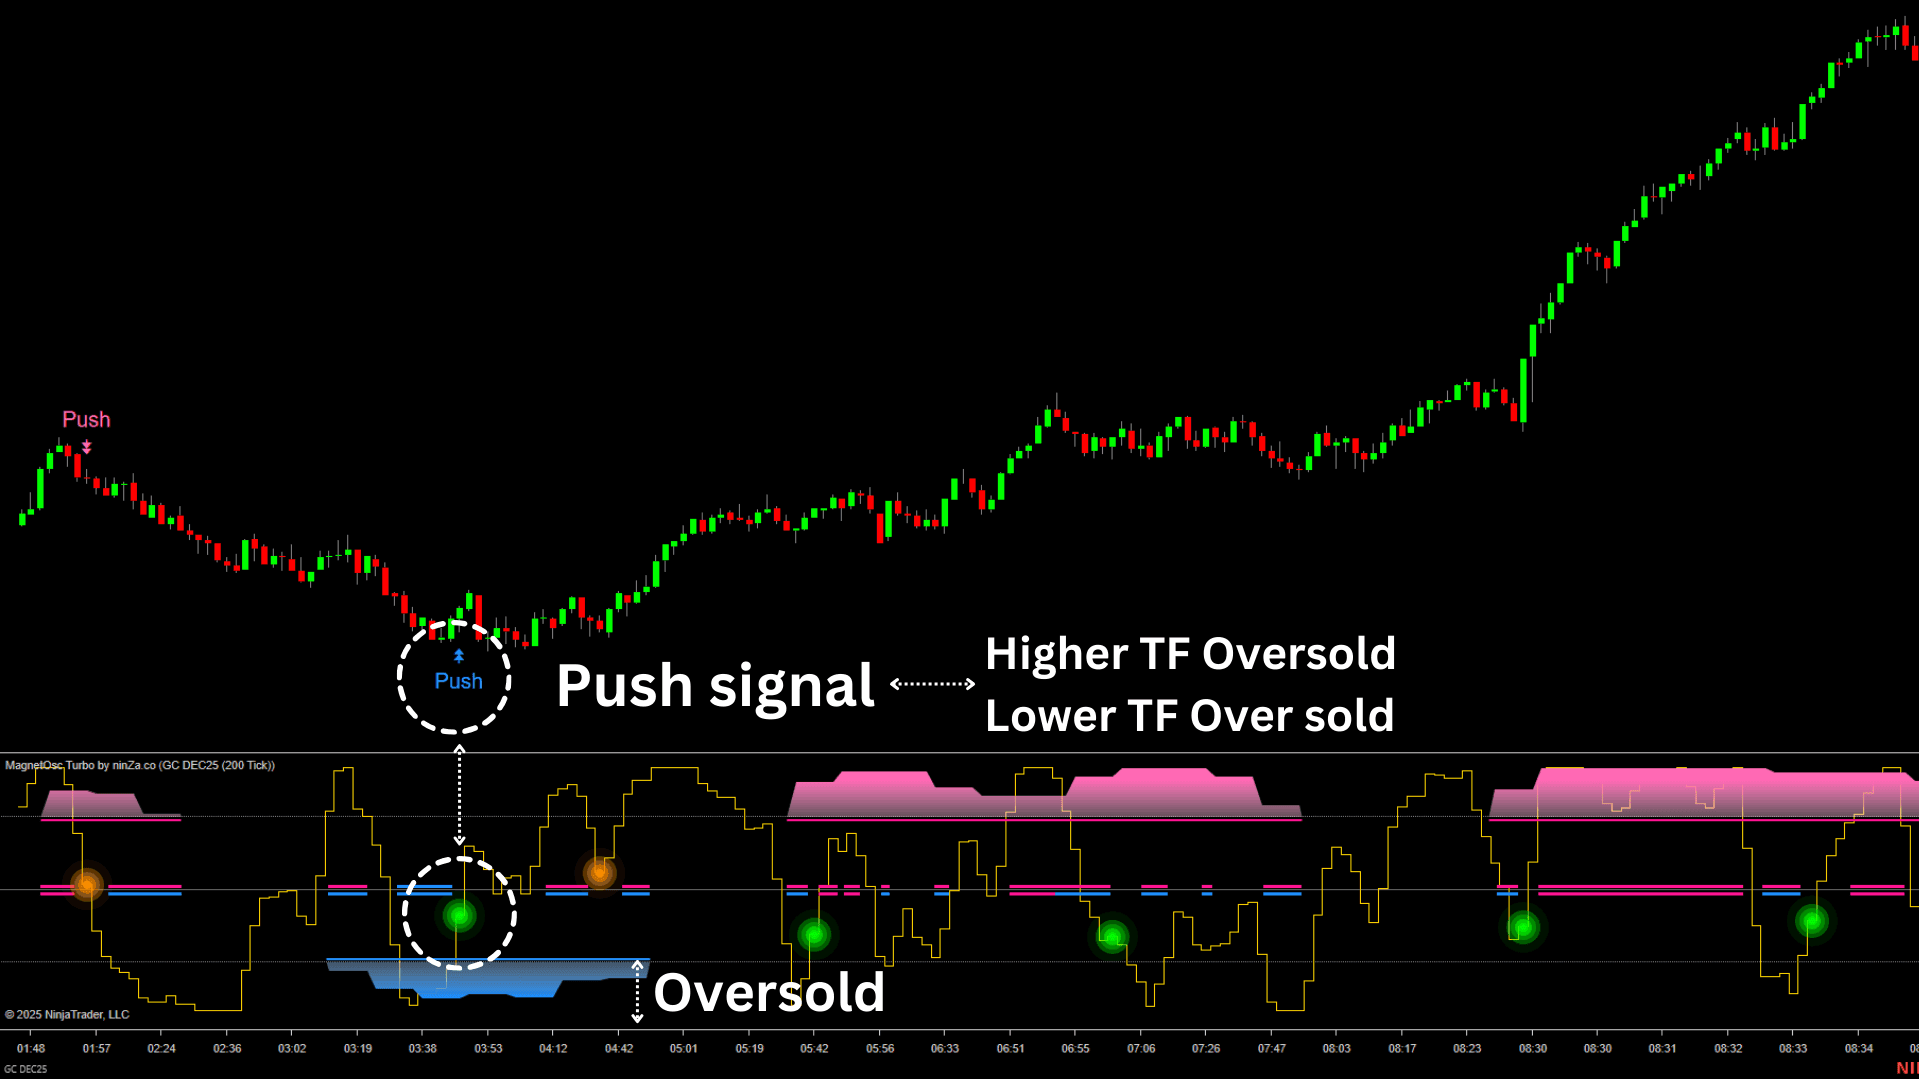
- It compares momentum across two timeframes, helping you spot when both short-term and long-term conditions are stretched.
- If both timeframes show overbought or oversold, it signals a potential strong reversal.
- Diverging signals between timeframes can highlight short-term counter moves against the broader trend.
By using MagnetOsc Turbo, traders can make more informed decisions, reducing false signals and improving trade timing.
Both Multi-Osc OB/OS Overlap and MagnetOsc Turbo are currently among the best indicators for spotting overbought and oversold zones, combining multiple data points into actionable insights for smarter trading.
Download ~ 40 FREE indicators & reach more useful resources !!!
ninZa.co Indicators
0 online
![]()
ninZa.co is an official member of NinjaTrader Ecosystem together with 600+ industry-leading professionals that provide traders with quality trading products & services.


even more payment methods
Quick Links
Instructions
Support
Resources & Information
© Copyright 2026 All Rights Reserved

![]()

Because software products may be copied and stored easily, we will NOT issue refunds of any kind. ALL SALES ARE FINAL & NON-REFUNDABLE!
Futures, foreign currency, and options trading contains substantial risk and is not for every investor. An investor could potentially lose all or more than the initial investment. Risk capital is money that can be lost without jeopardizing one's financial security or lifestyle. Only risk capital should be used for trading and only those with sufficient risk capital should consider trading. Past performance is not necessarily indicative of future results.
Hypothetical performance results have many inherent limitations, some of which are described below. No representation is being made that any account will or is likely to achieve profits or losses similar to those shown; in fact, there are frequently sharp differences between hypothetical performance results and the actual results subsequently achieved by any particular trading program. One of the limitations of hypothetical performance results is that they are generally prepared with the benefit of hindsight. In addition, hypothetical trading does not involve financial risk, and no hypothetical trading record can completely account for the impact of financial risk of actual trading. For example, the ability to withstand losses or to adhere to a particular trading program in spite of trading losses are material points which can also adversely affect actual trading results. There are numerous other factors related to the markets in general or to the implementation of any specific trading program which cannot be fully accounted for in the preparation of hypothetical performance results and all which can adversely affect trading results.
NinjaTrader® is a registered trademark of NinjaTrader Group, LLC. No NinjaTrader company has any affiliation with the owner, developer, or provider of the products or services described herein, or any interest, ownership or otherwise, in any such product or service, or endorses, recommends or approves any such product or service.