

NINZA Columbus Day Sale 2026 – Bundle Builder
The larger the bundle, the better the value
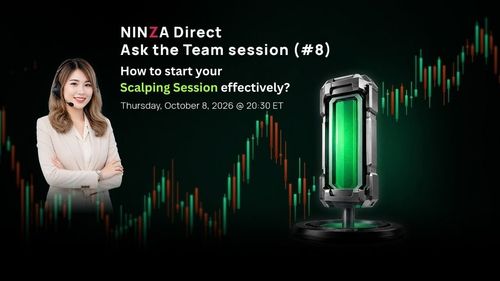
NINZA Direct: Ask the Team session (#8)
How to start your Scalping Session effectively?
_1791367956213.jpg)
FLAMINGO
One trading framework. Two ways to trade.
![[New flagship Renko system] Poseidon Trident —E](https://forestcms.nyc3.digitaloceanspaces.com/media/small_Poseidon Trident —E banner_1789461376412.jpg)
[New flagship Renko system] Poseidon Trident —E
Catch the Sniper Entry. Ride the Strongest Waves.

We hit the limits. So we built ZillaTrader.
A new research & trading platform, built on 12+ years of experience.
Coming November 2026.
Trend Flow Suite
A clearer Renko trading process — from market structure to execution
Build a more consistent trading workflow by aligning reliable price structure, trend direction, momentum context, and rule-based execution.
Designed for the KingRenko$ 12/4 chart, this suite connects 4 complementary components within 1 structured framework. Instead of responding to isolated signals, traders can follow a defined process: understand the market structure, establish directional bias, evaluate the pullback, and execute according to predetermined rules.
Clean charts need a clear methodology
A clean chart is not a reliable process
Renko charts can make price action easier to read by reducing time-based noise. But a visually clean chart does not automatically create a reliable trading process. Adding more confirmation does not necessarily solve the problem — what matters is how market structure, trend, momentum, and execution work together within one repeatable methodology.
Bars do not reflect real market data.
Trend signals are interpreted without context.
Oscillators are treated as standalone entry triggers.
Execution rules change from one session to the next.
Structure comes before signals
Every decision should begin with dependable market structure — not an isolated indicator signal
Once price is represented consistently, each analytical layer can serve a defined purpose. Trend establishes the direction worth considering. Momentum helps evaluate the condition of a pullback. Execution rules determine whether and how the trade should be taken.
This principle shapes the entire suite: 1 connected workflow, with a clear responsibility for every component.
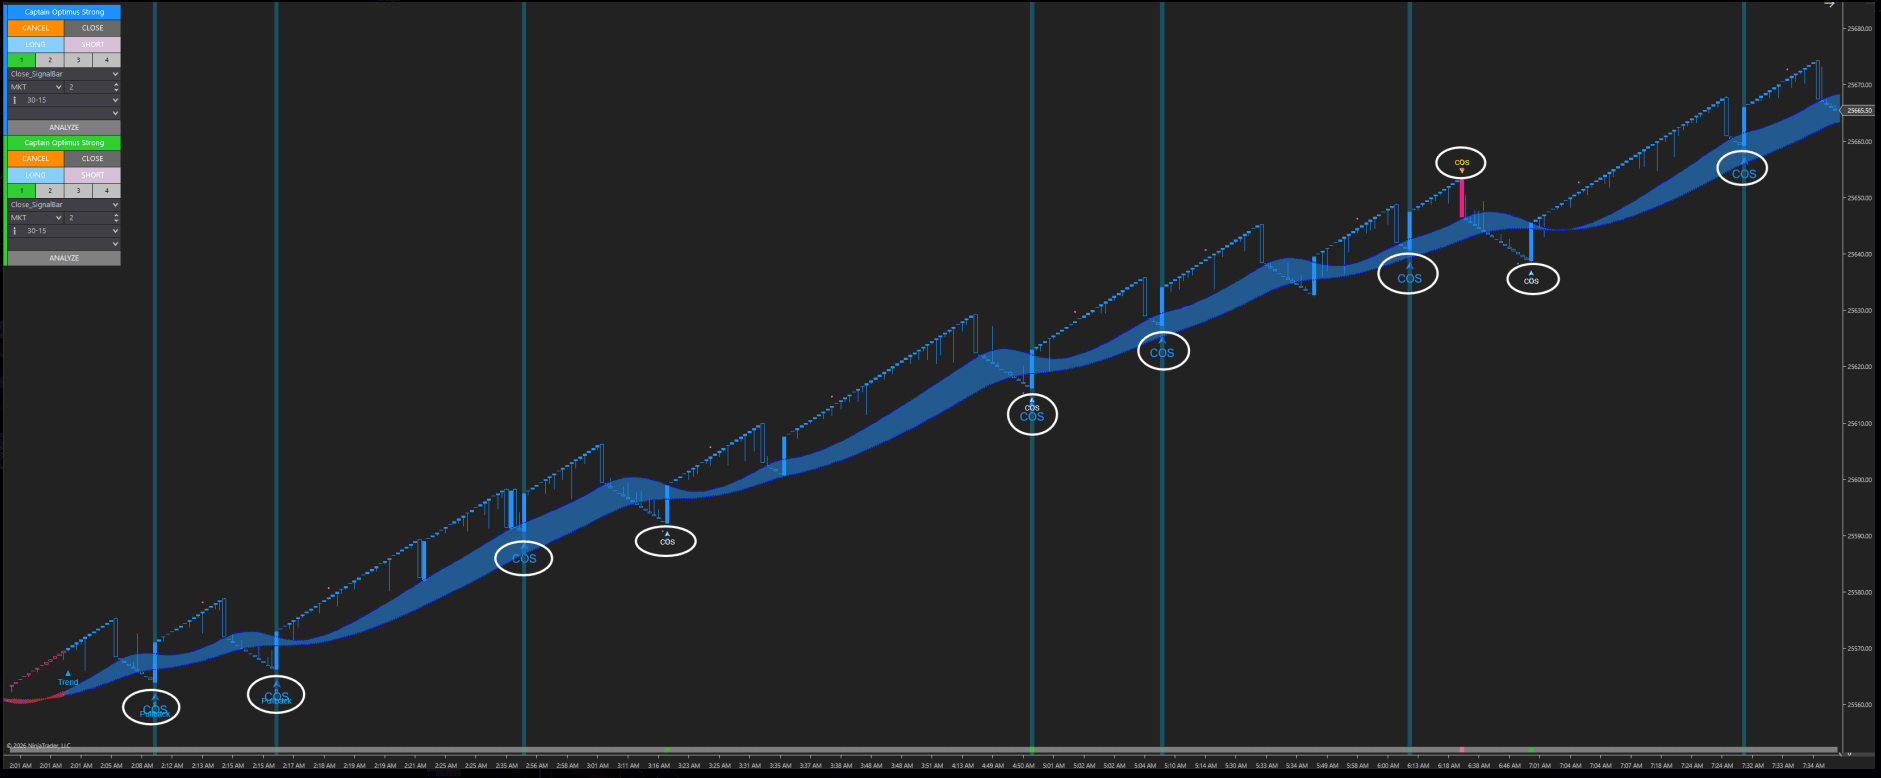
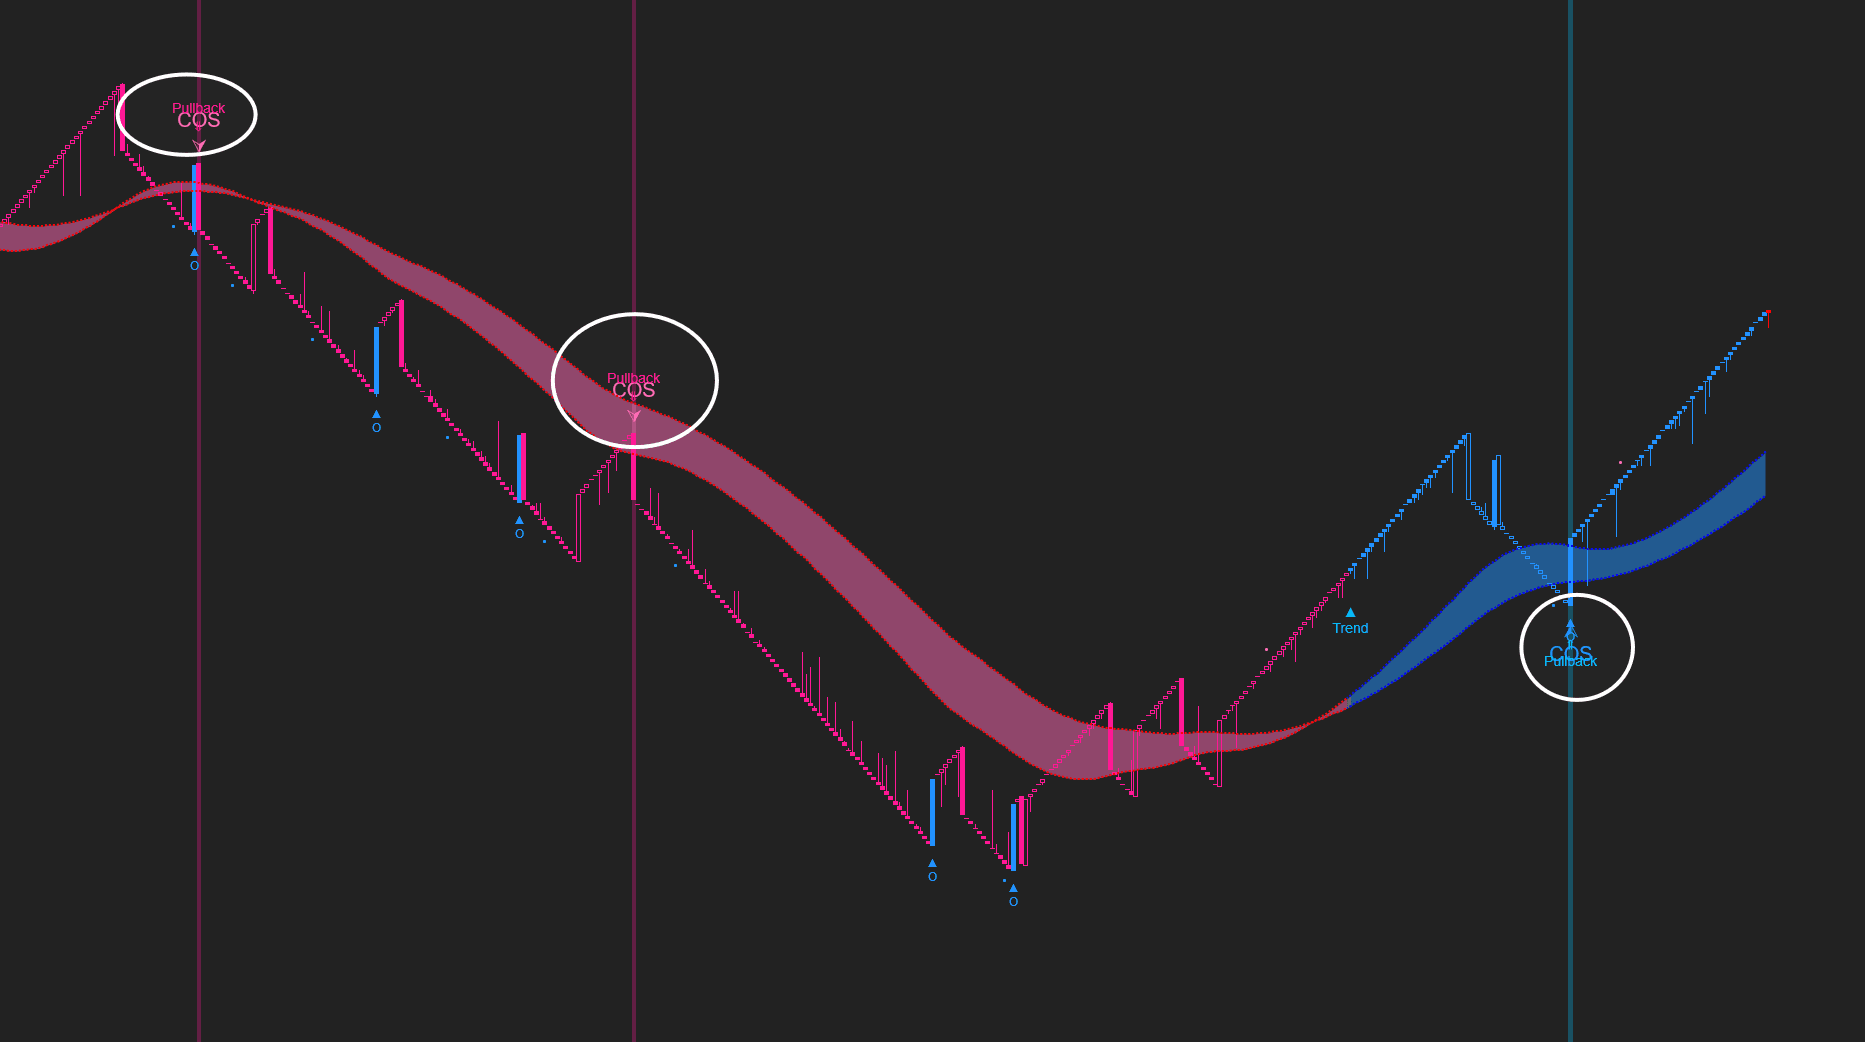
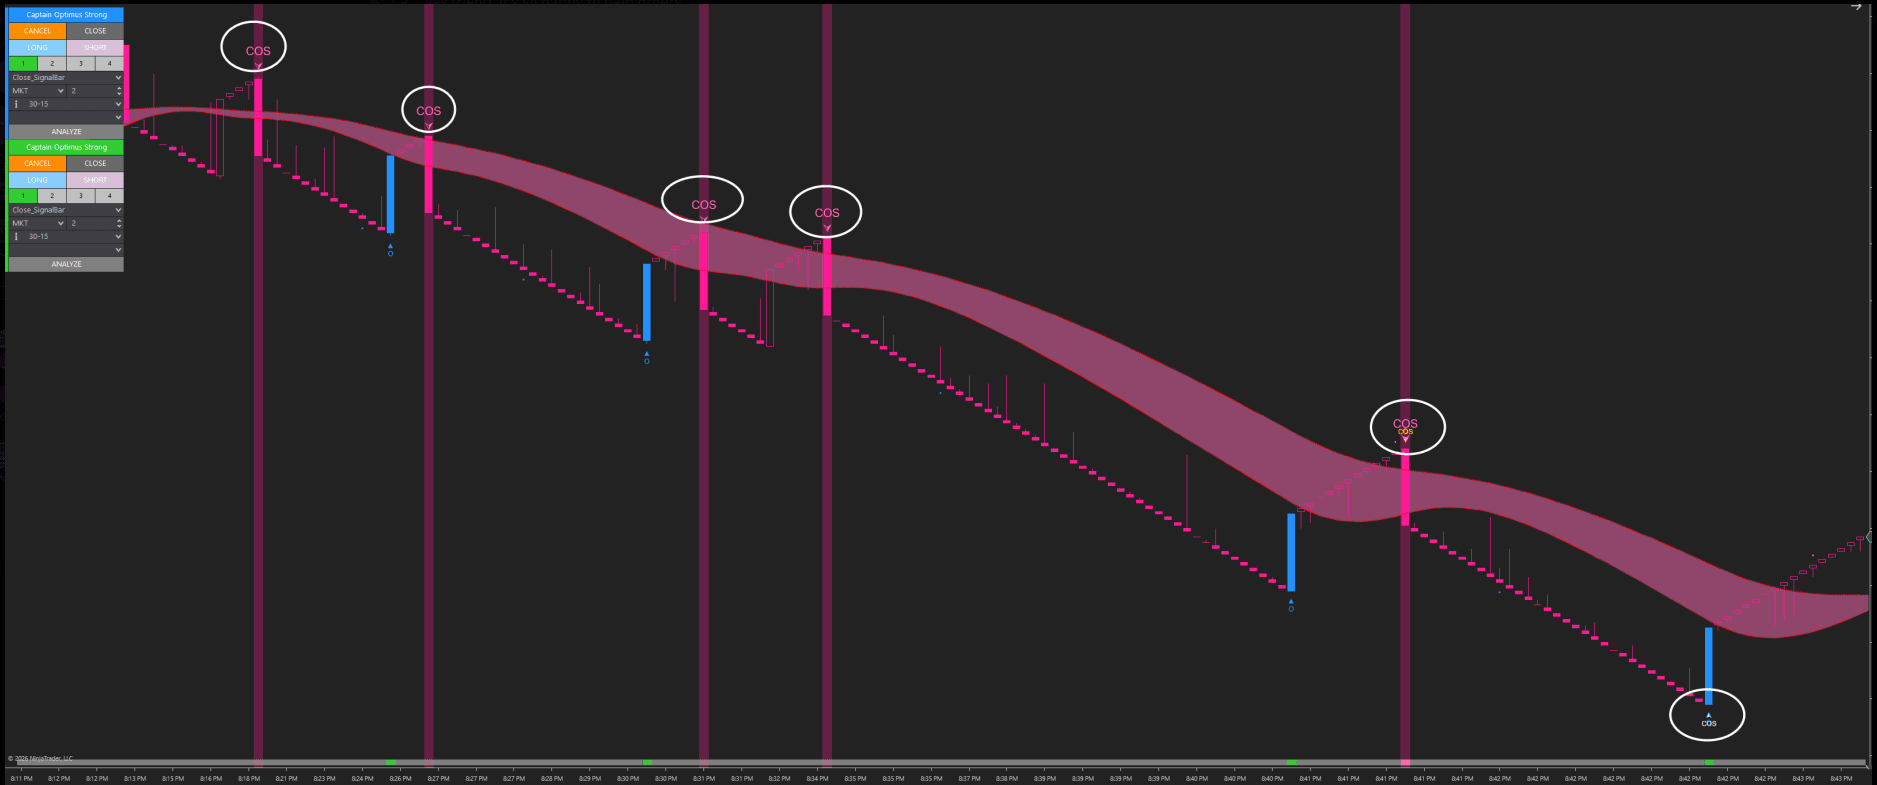
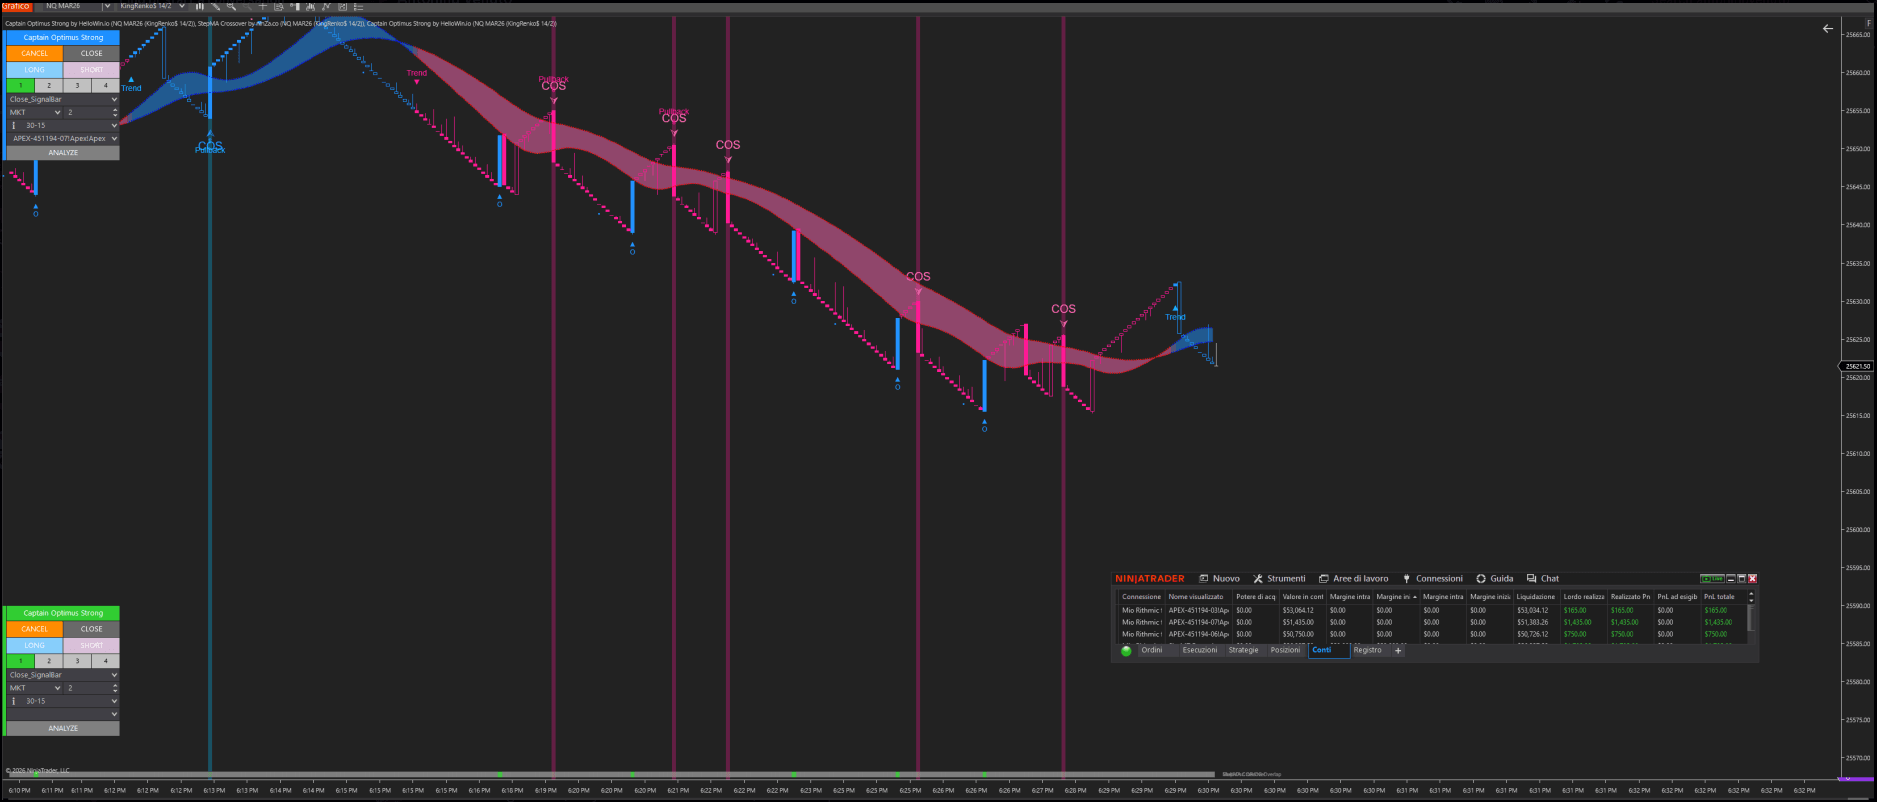
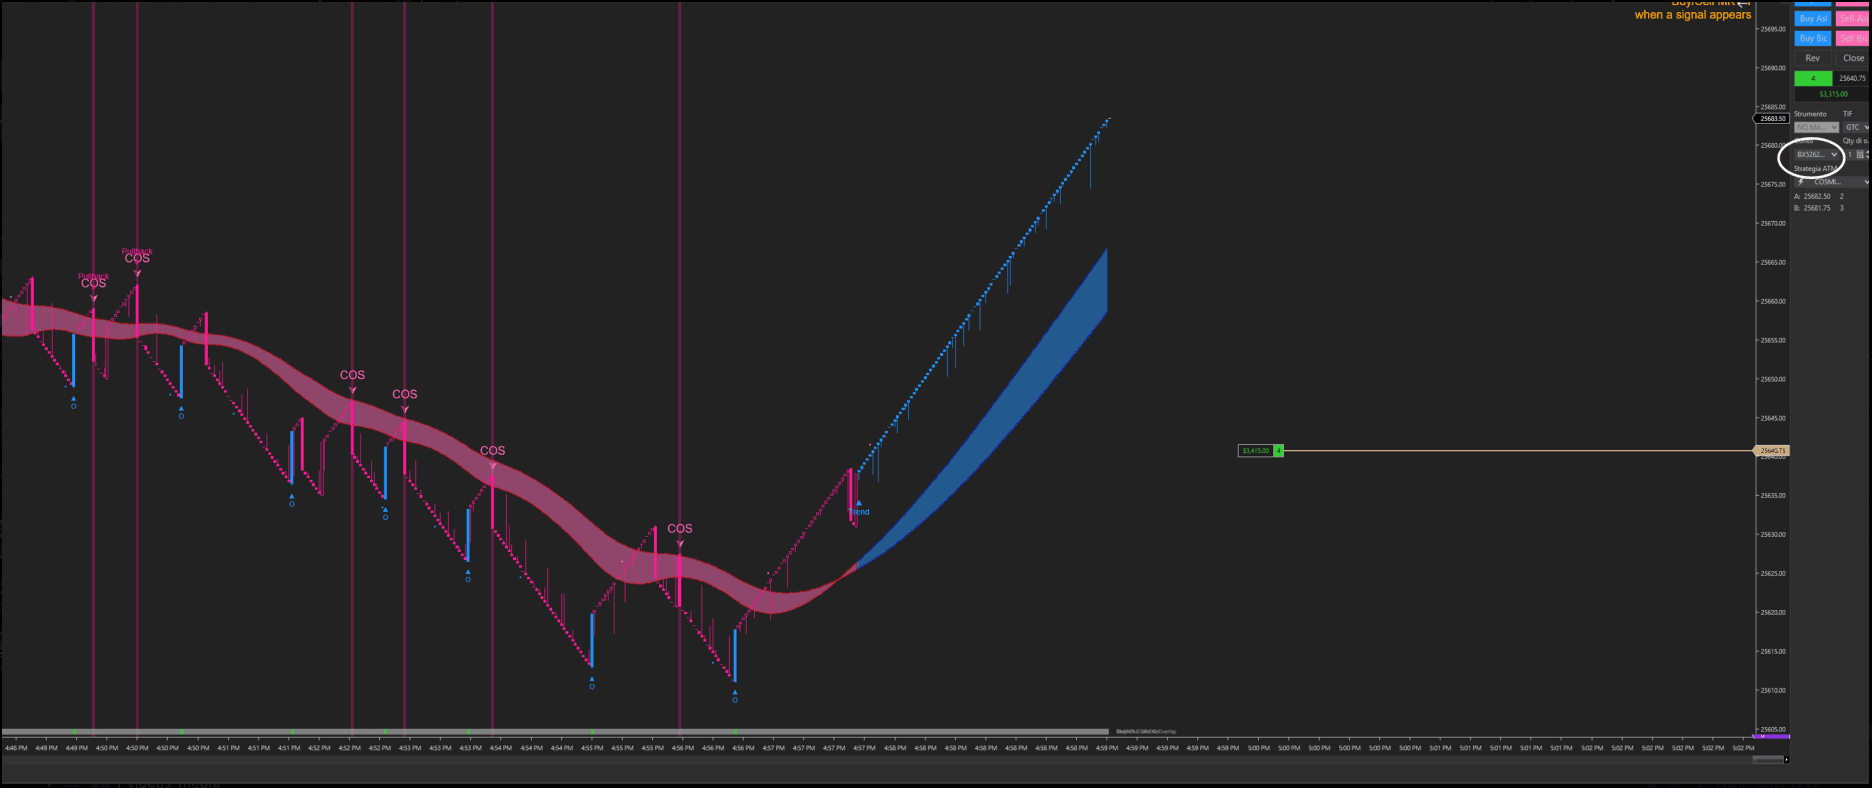
How the framework works
4 components, each with one defined responsibility
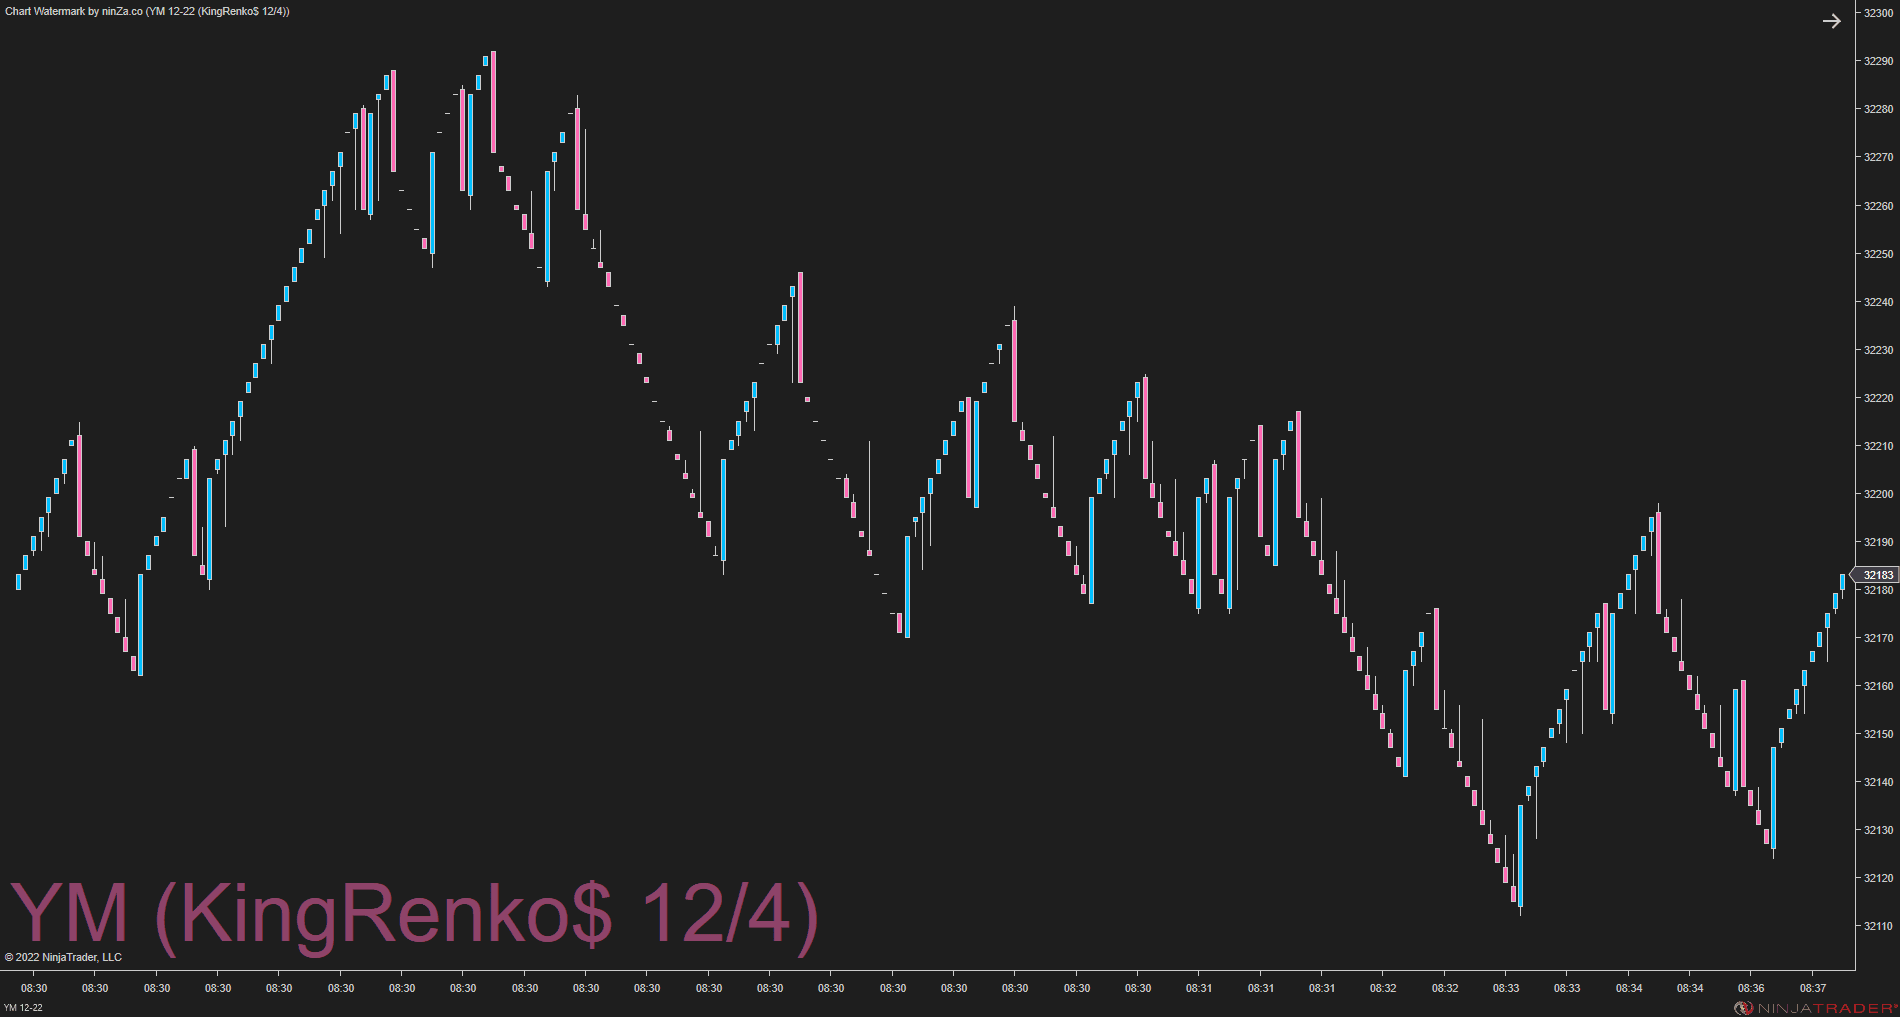
Establish market structure with KingRenko$
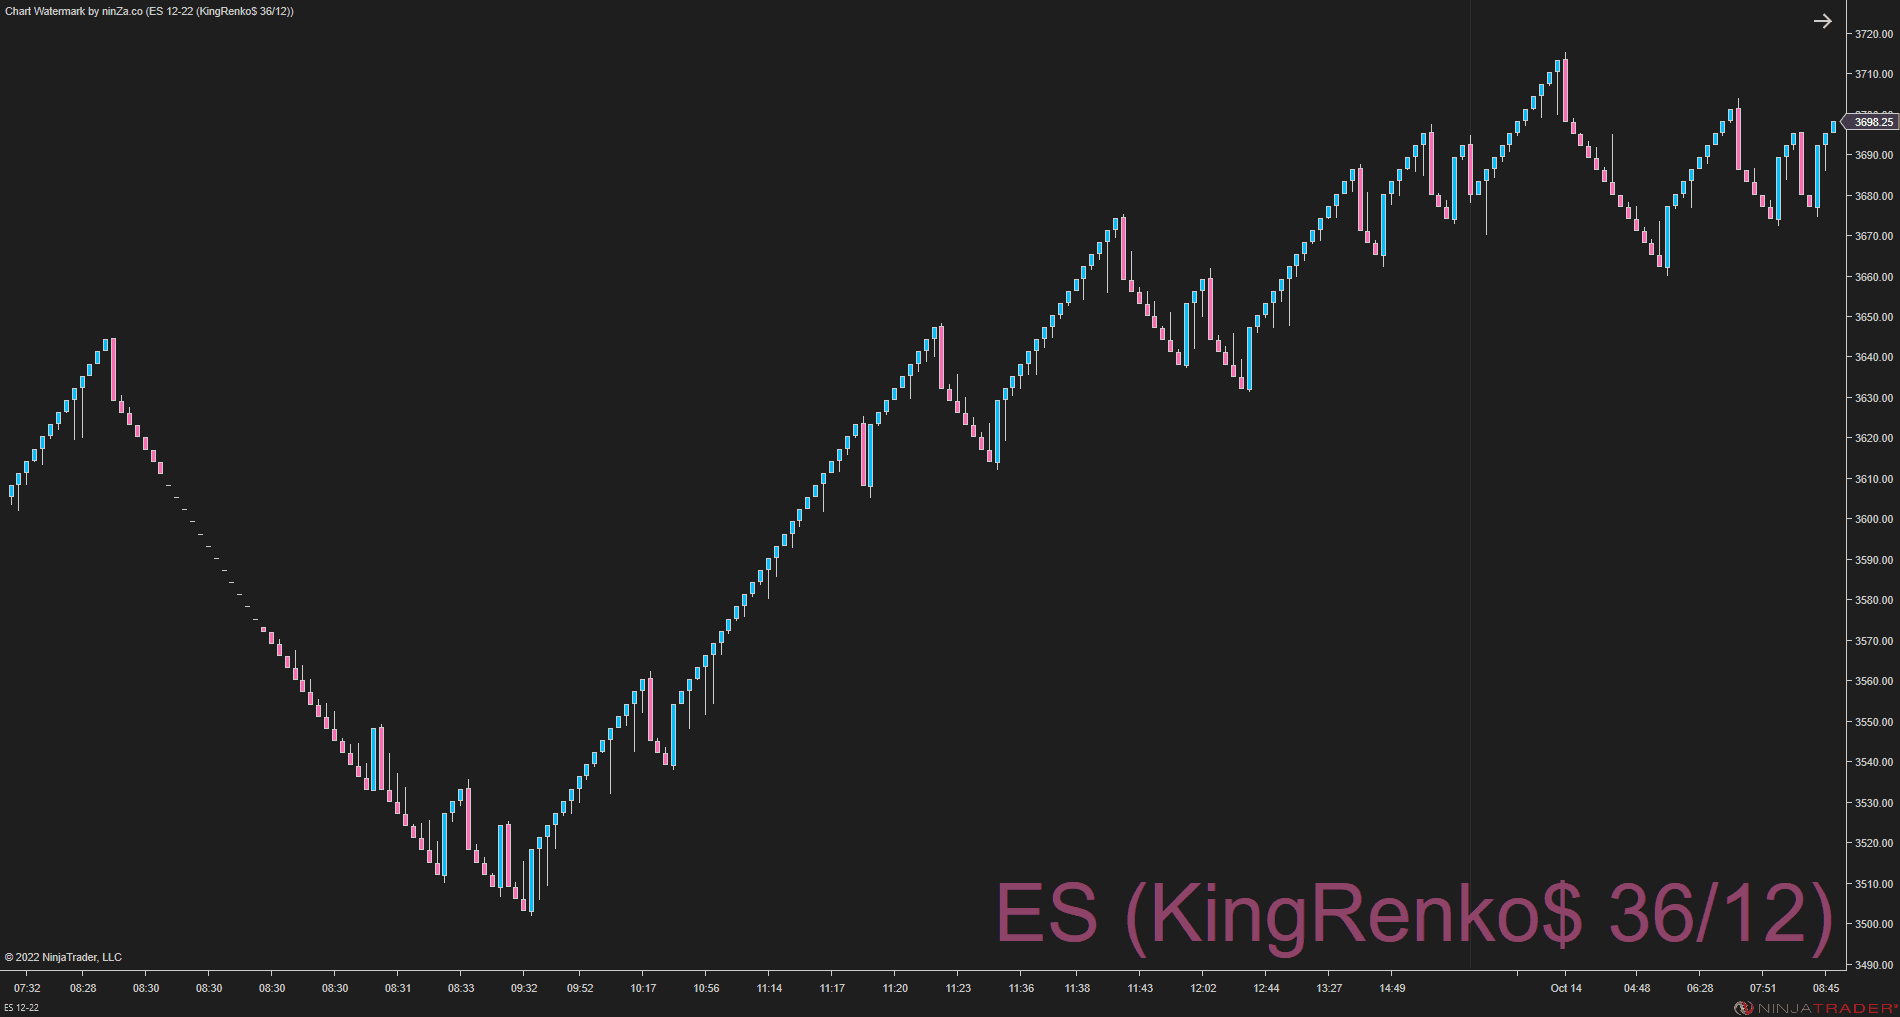
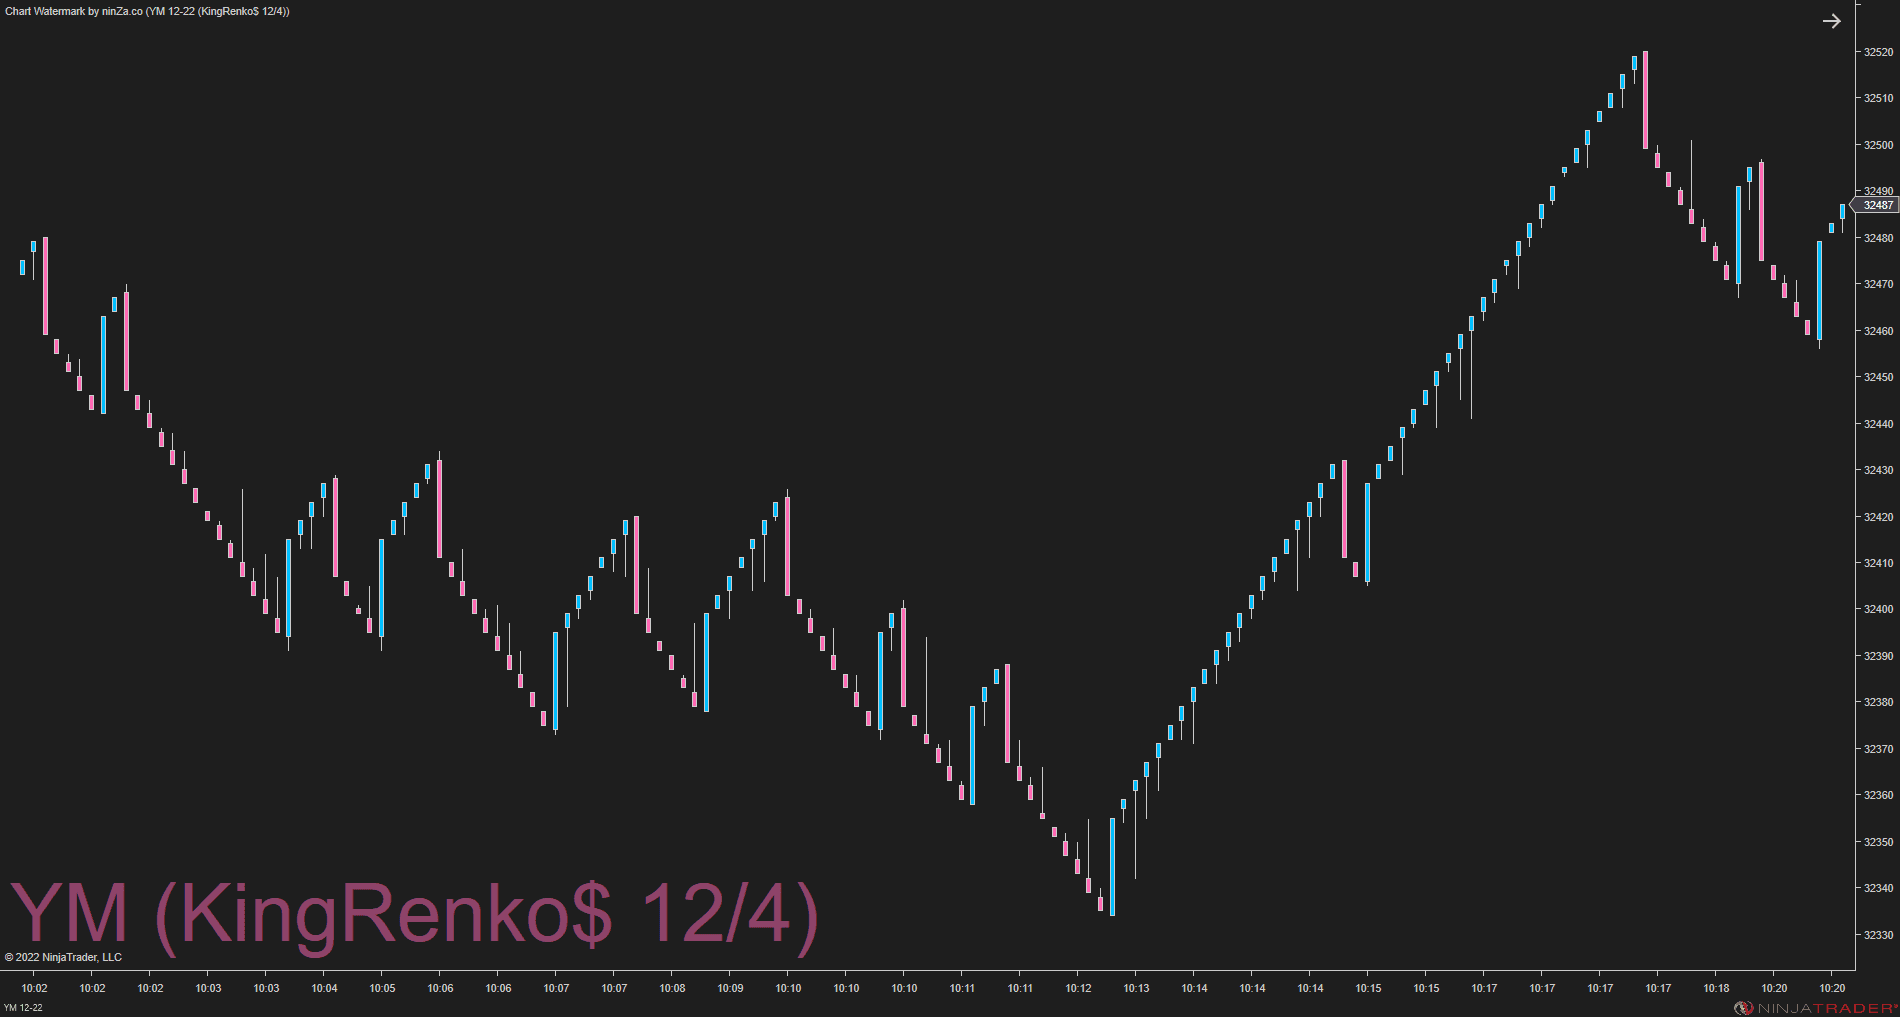
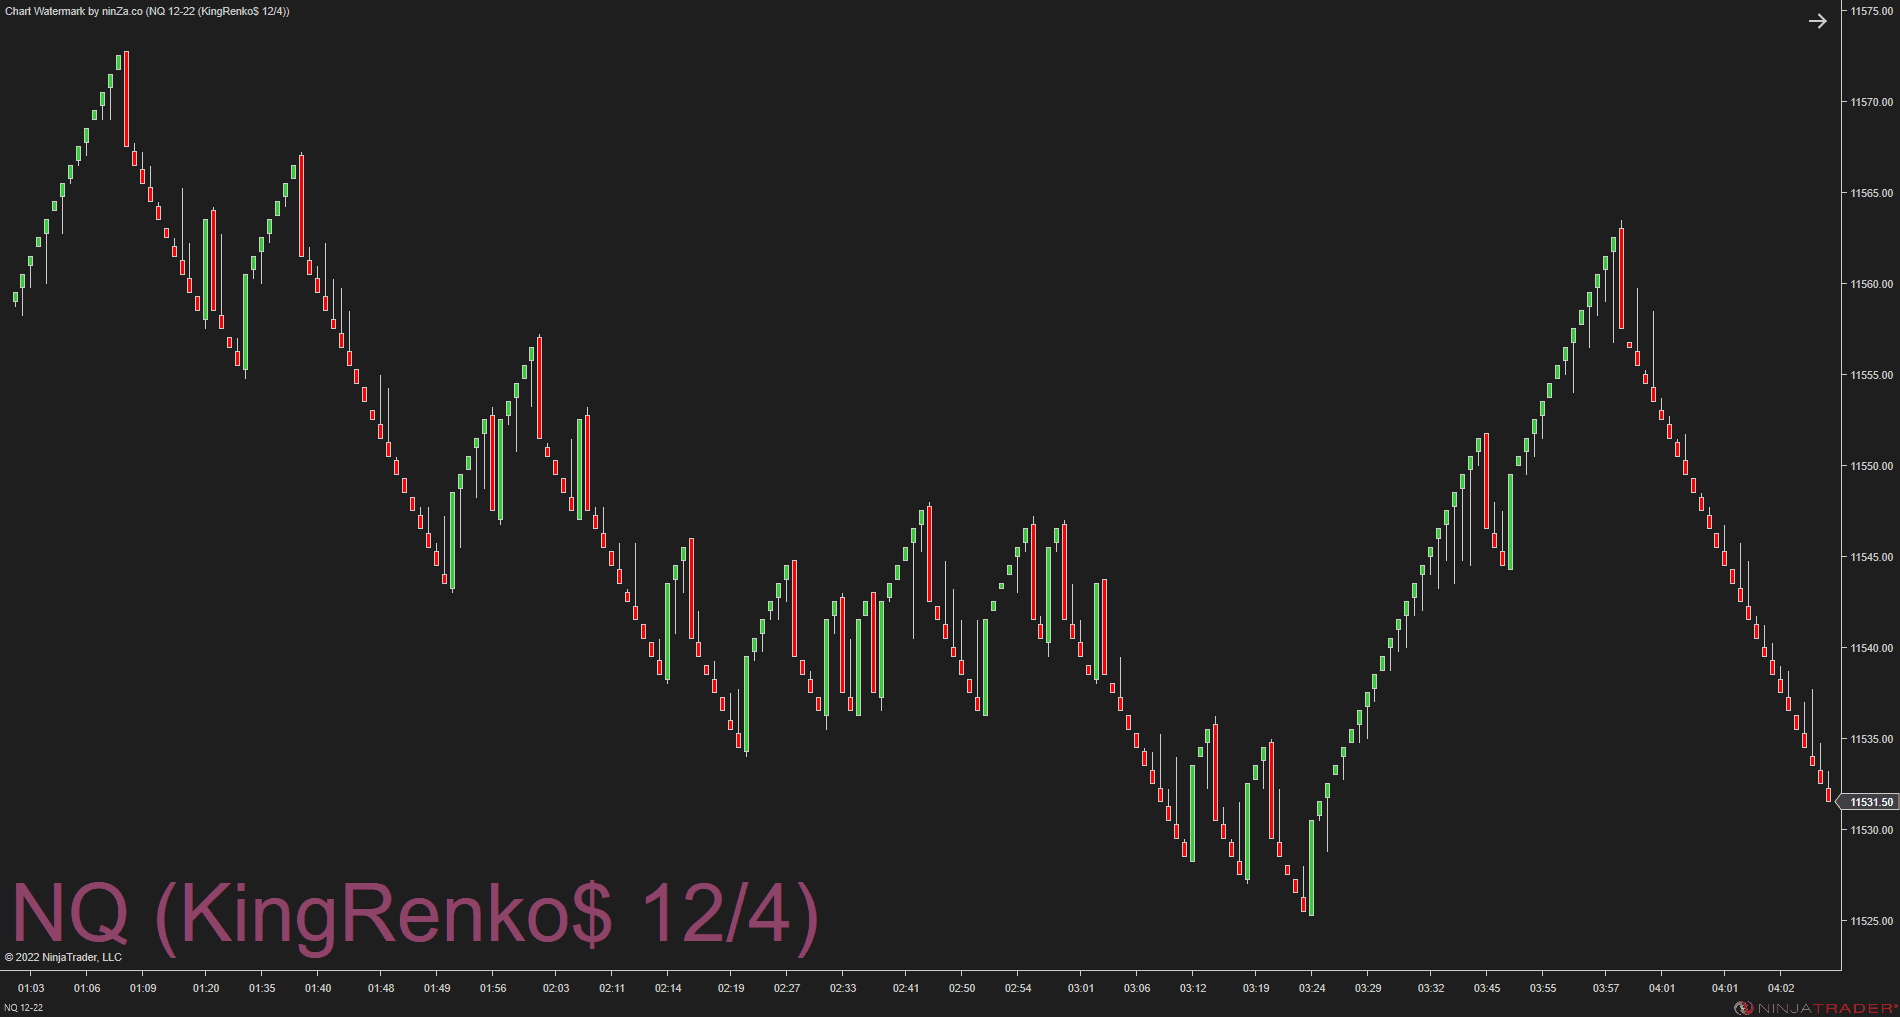
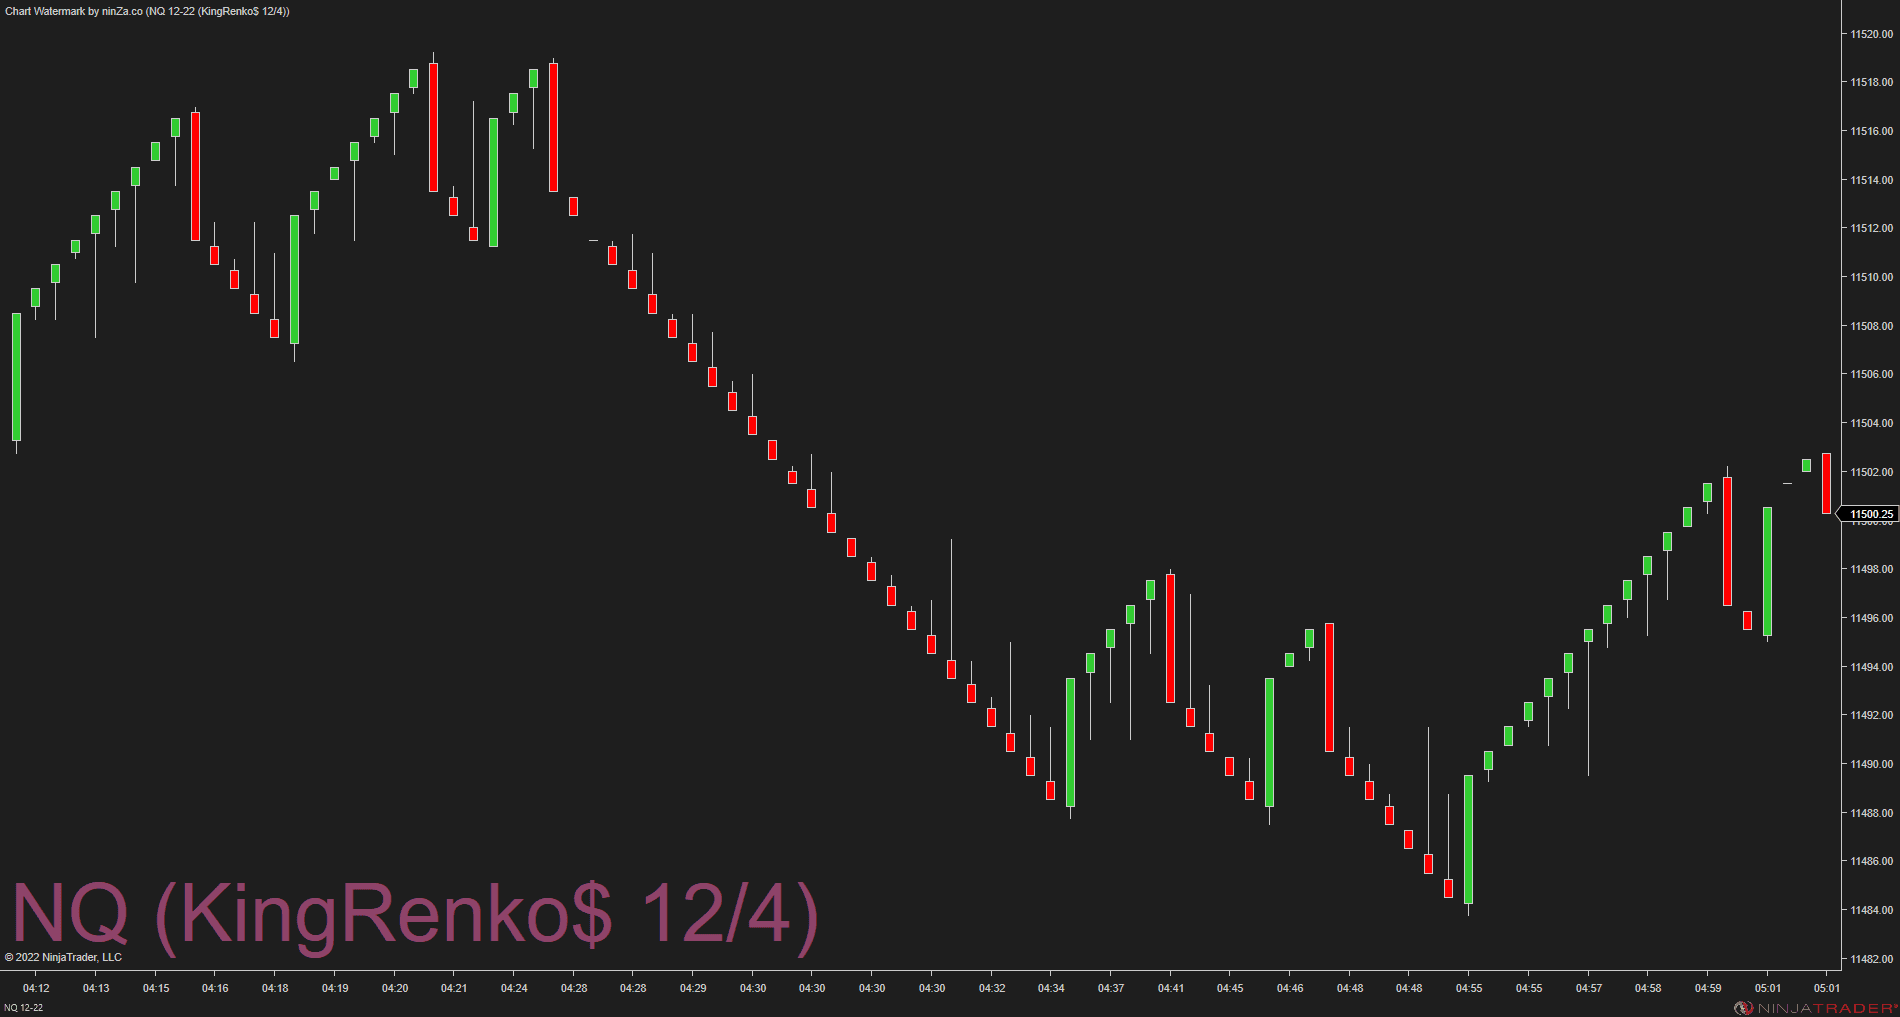
KingRenko$ builds Renko bars from real OHLC market data, providing a cleaner and more realistic foundation for analysis. This gives the remaining components a more consistent price structure on which to evaluate trend, momentum, and execution conditions.
Define direction with StepMA Crossover
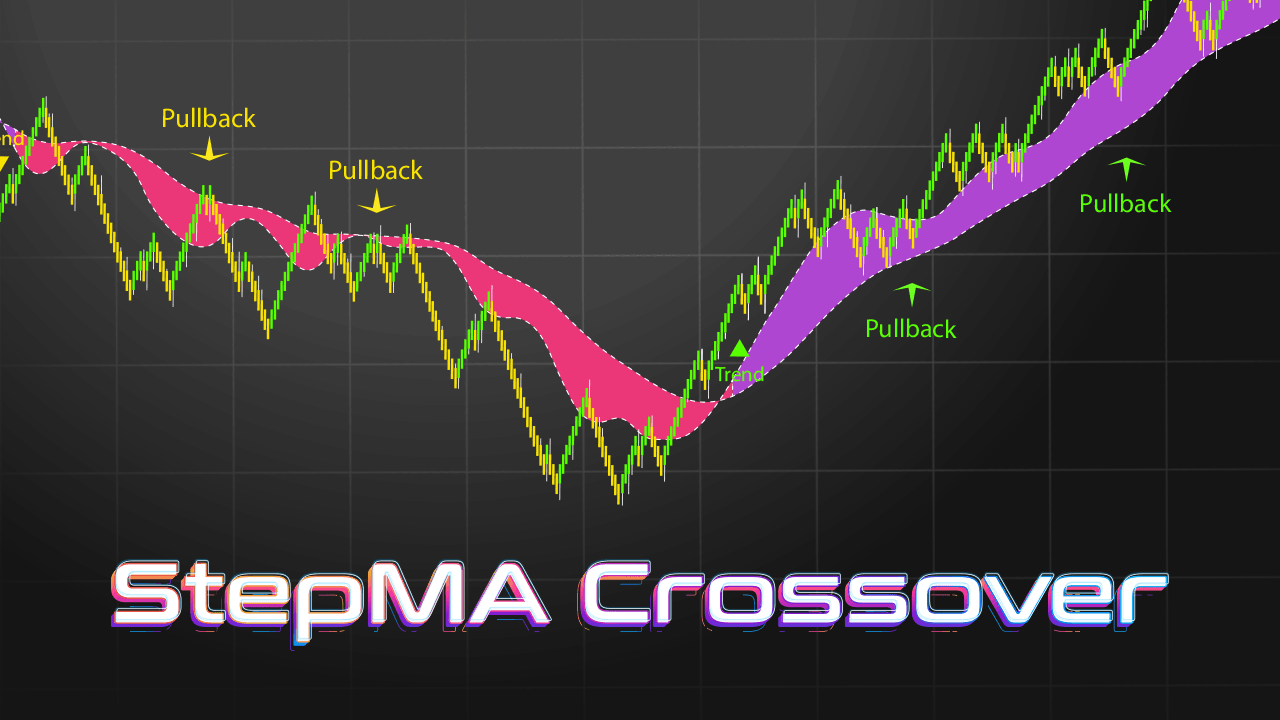
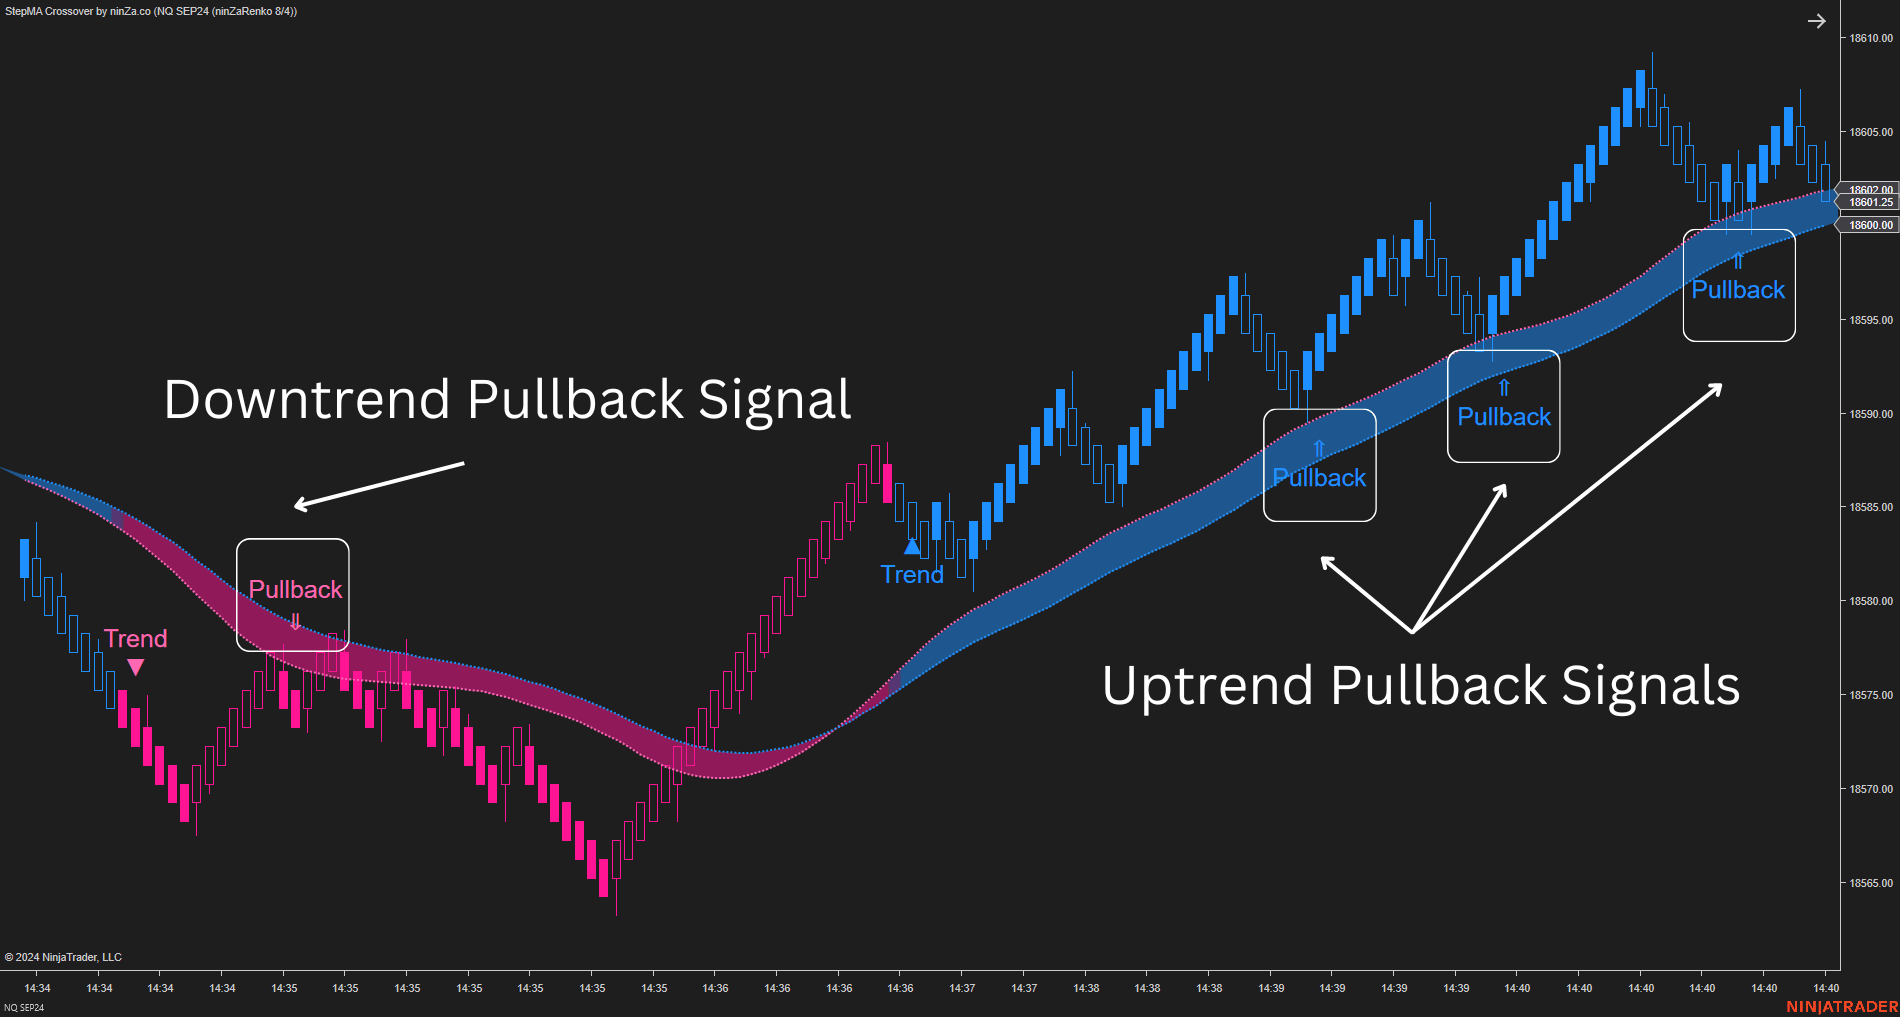
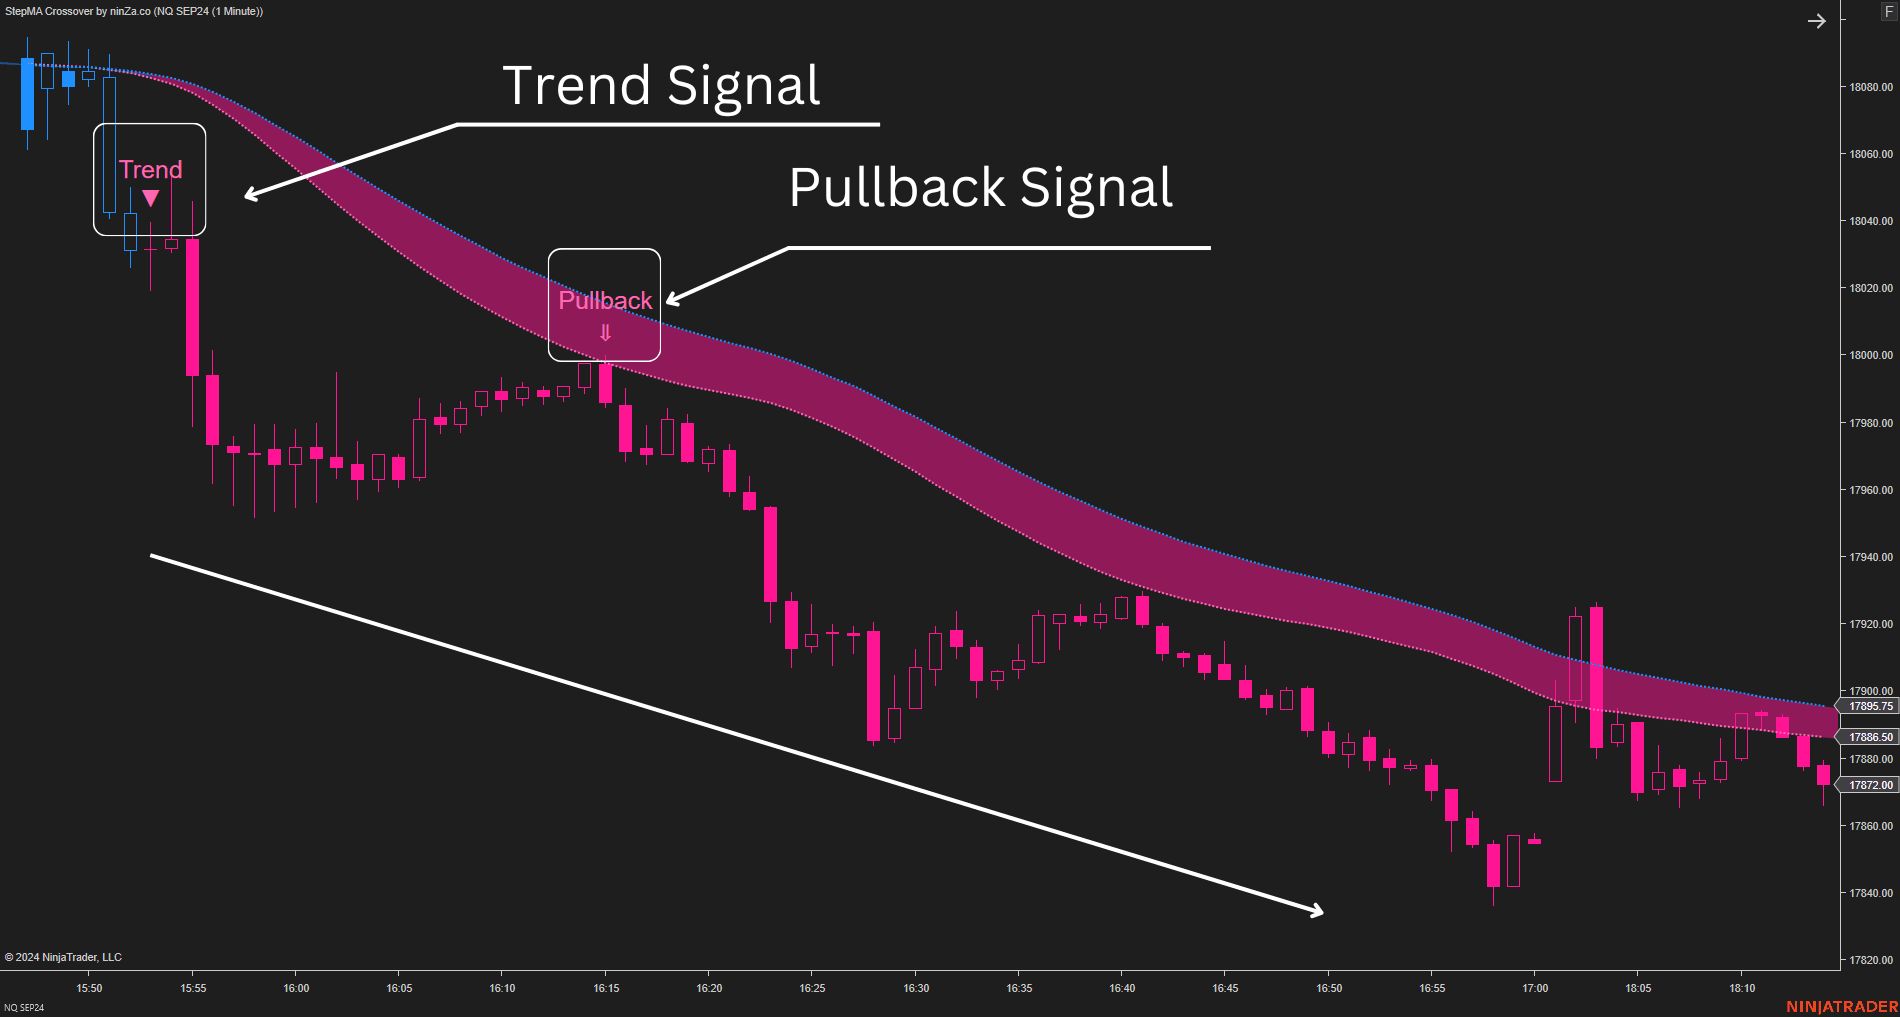
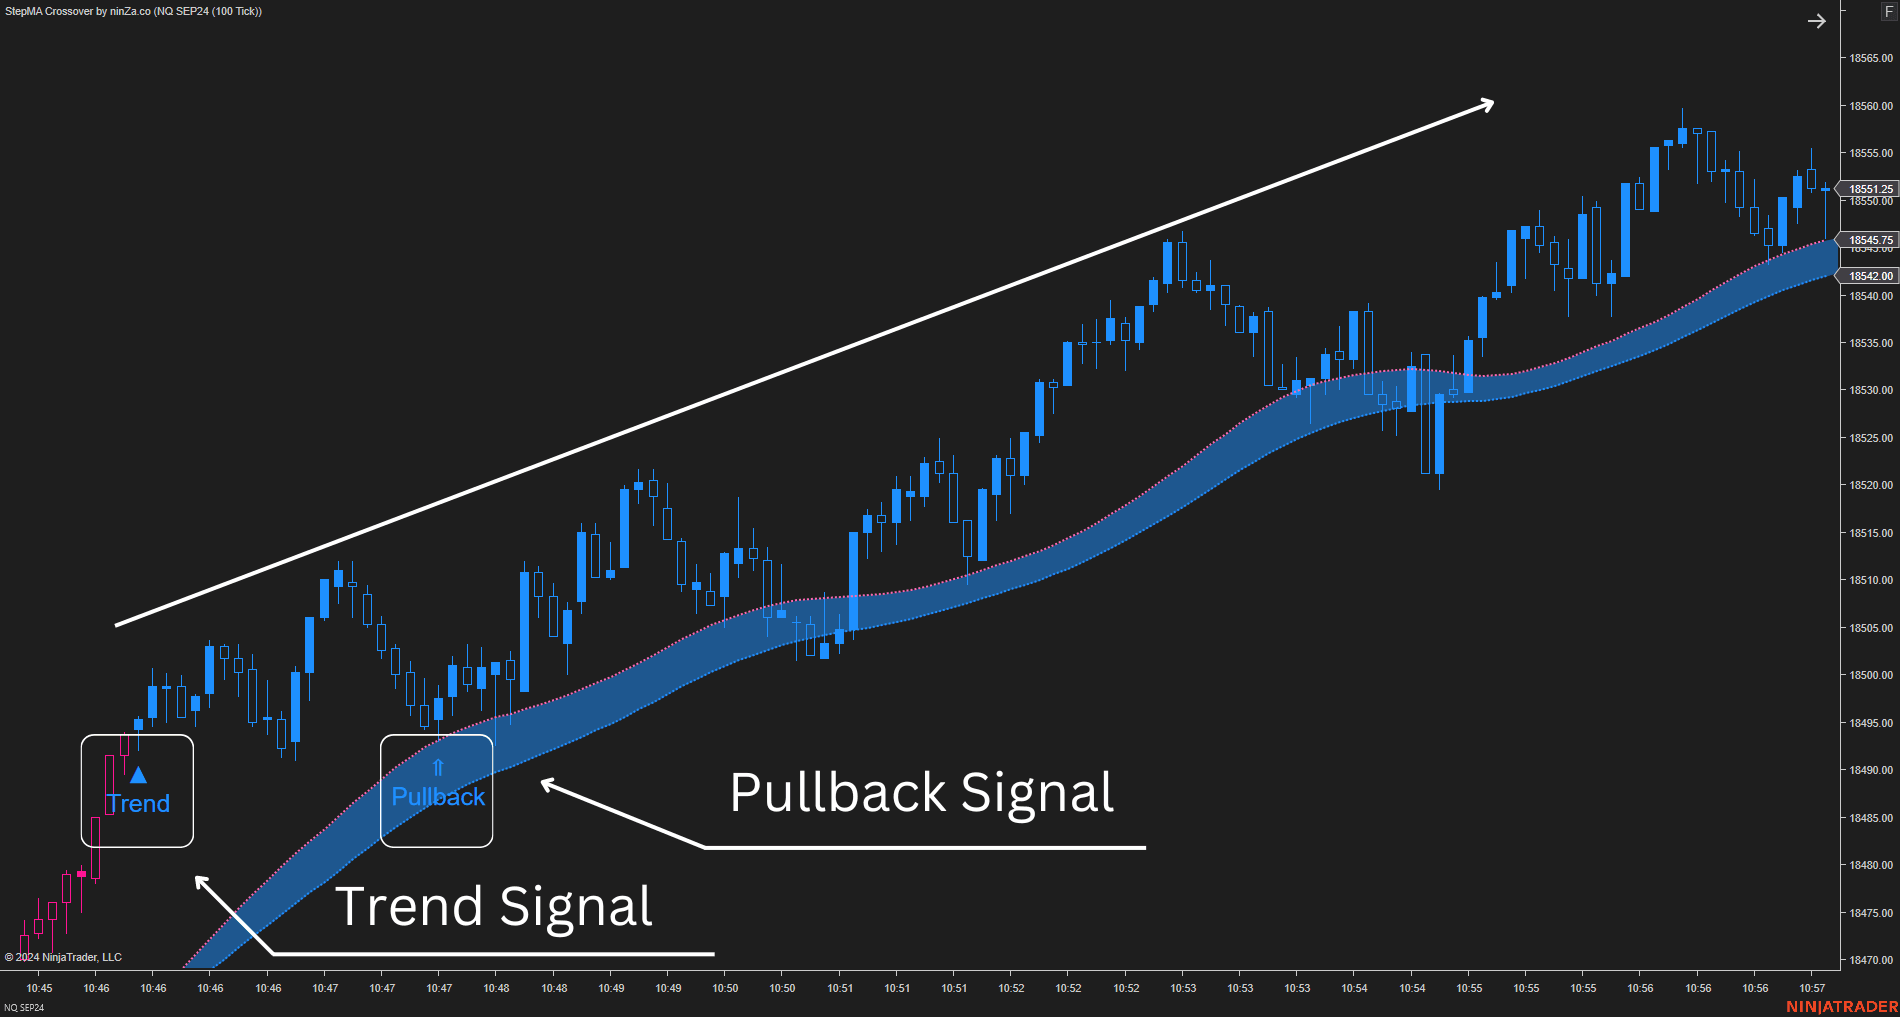
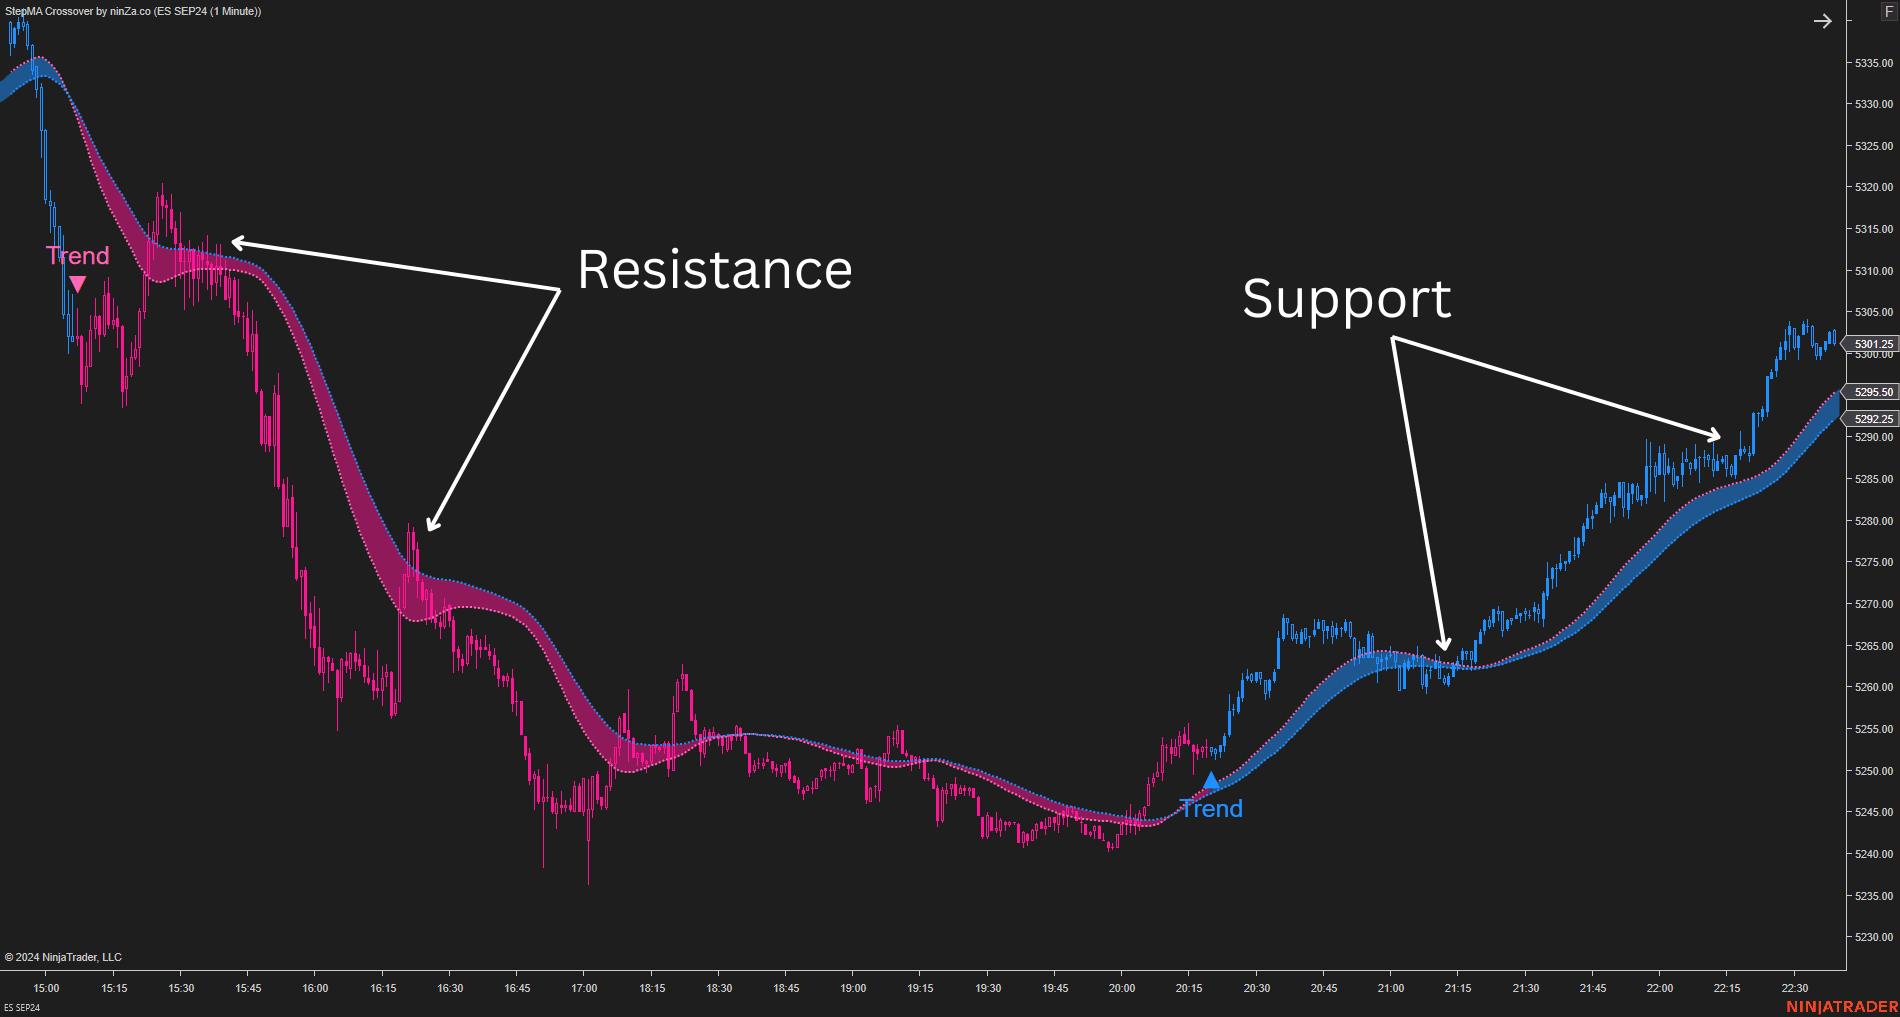
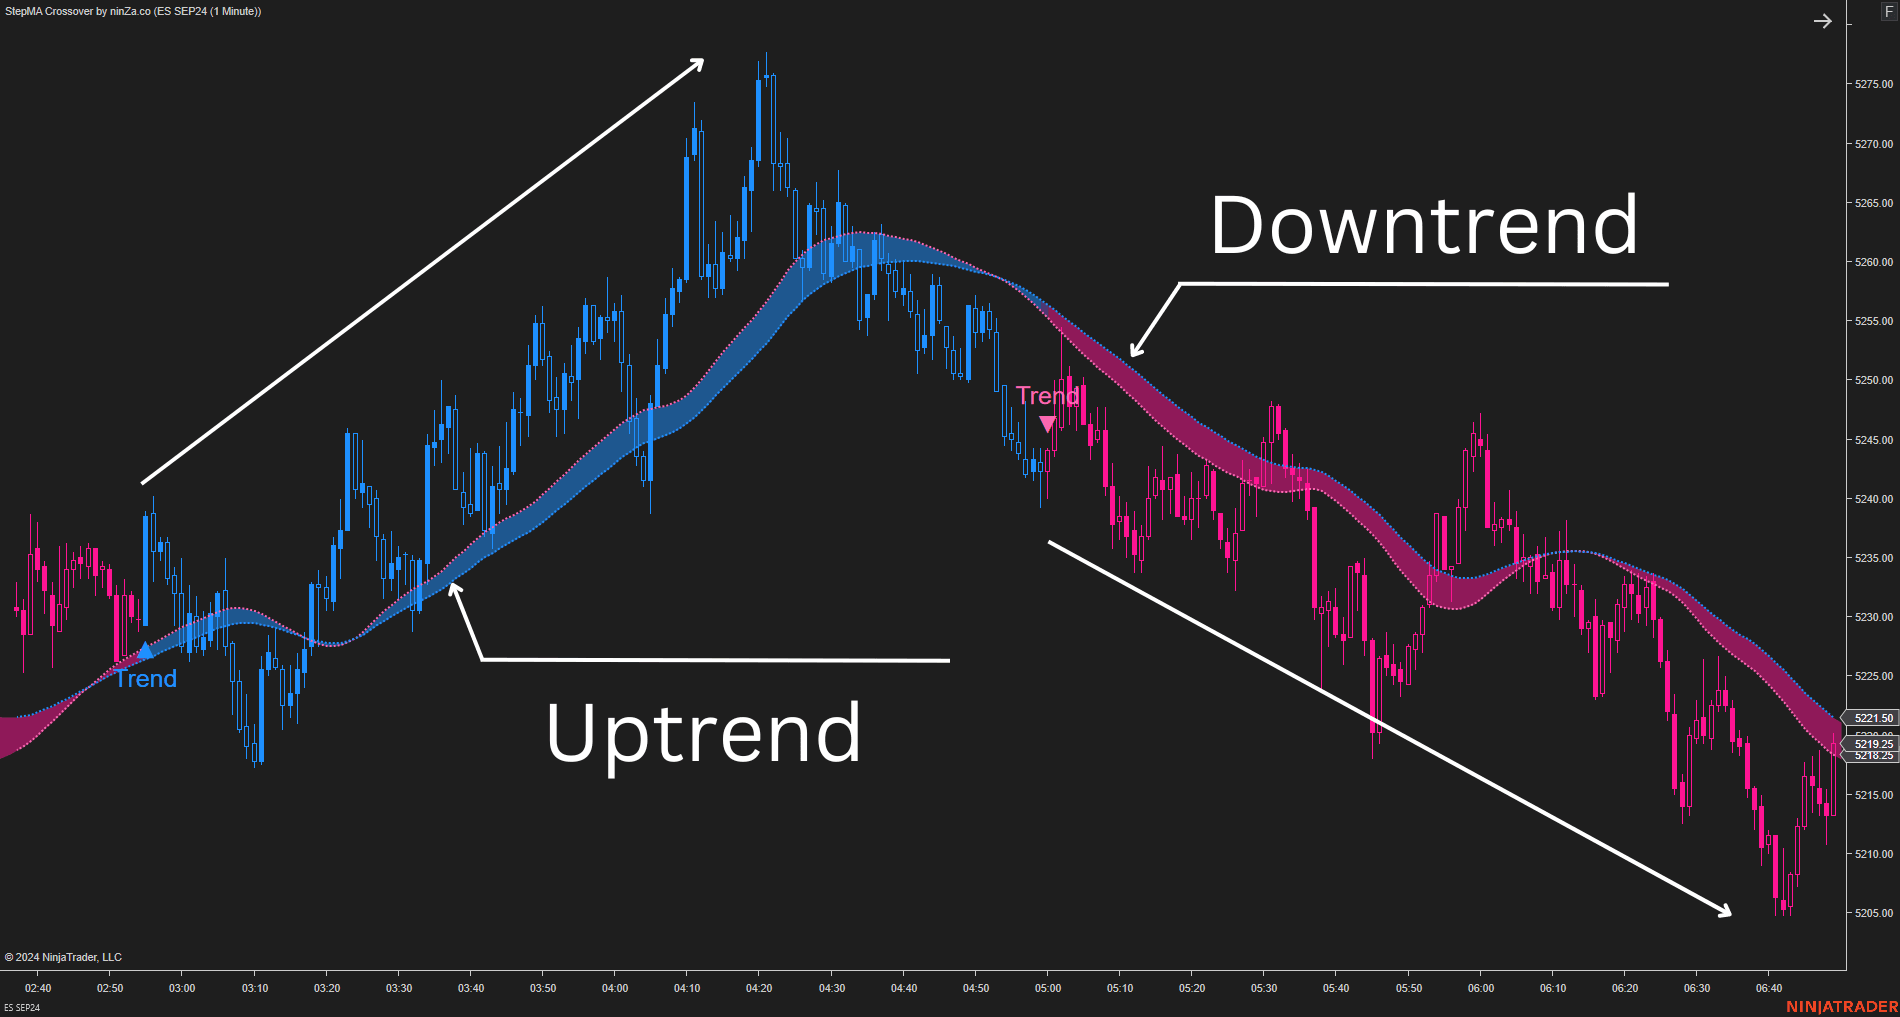
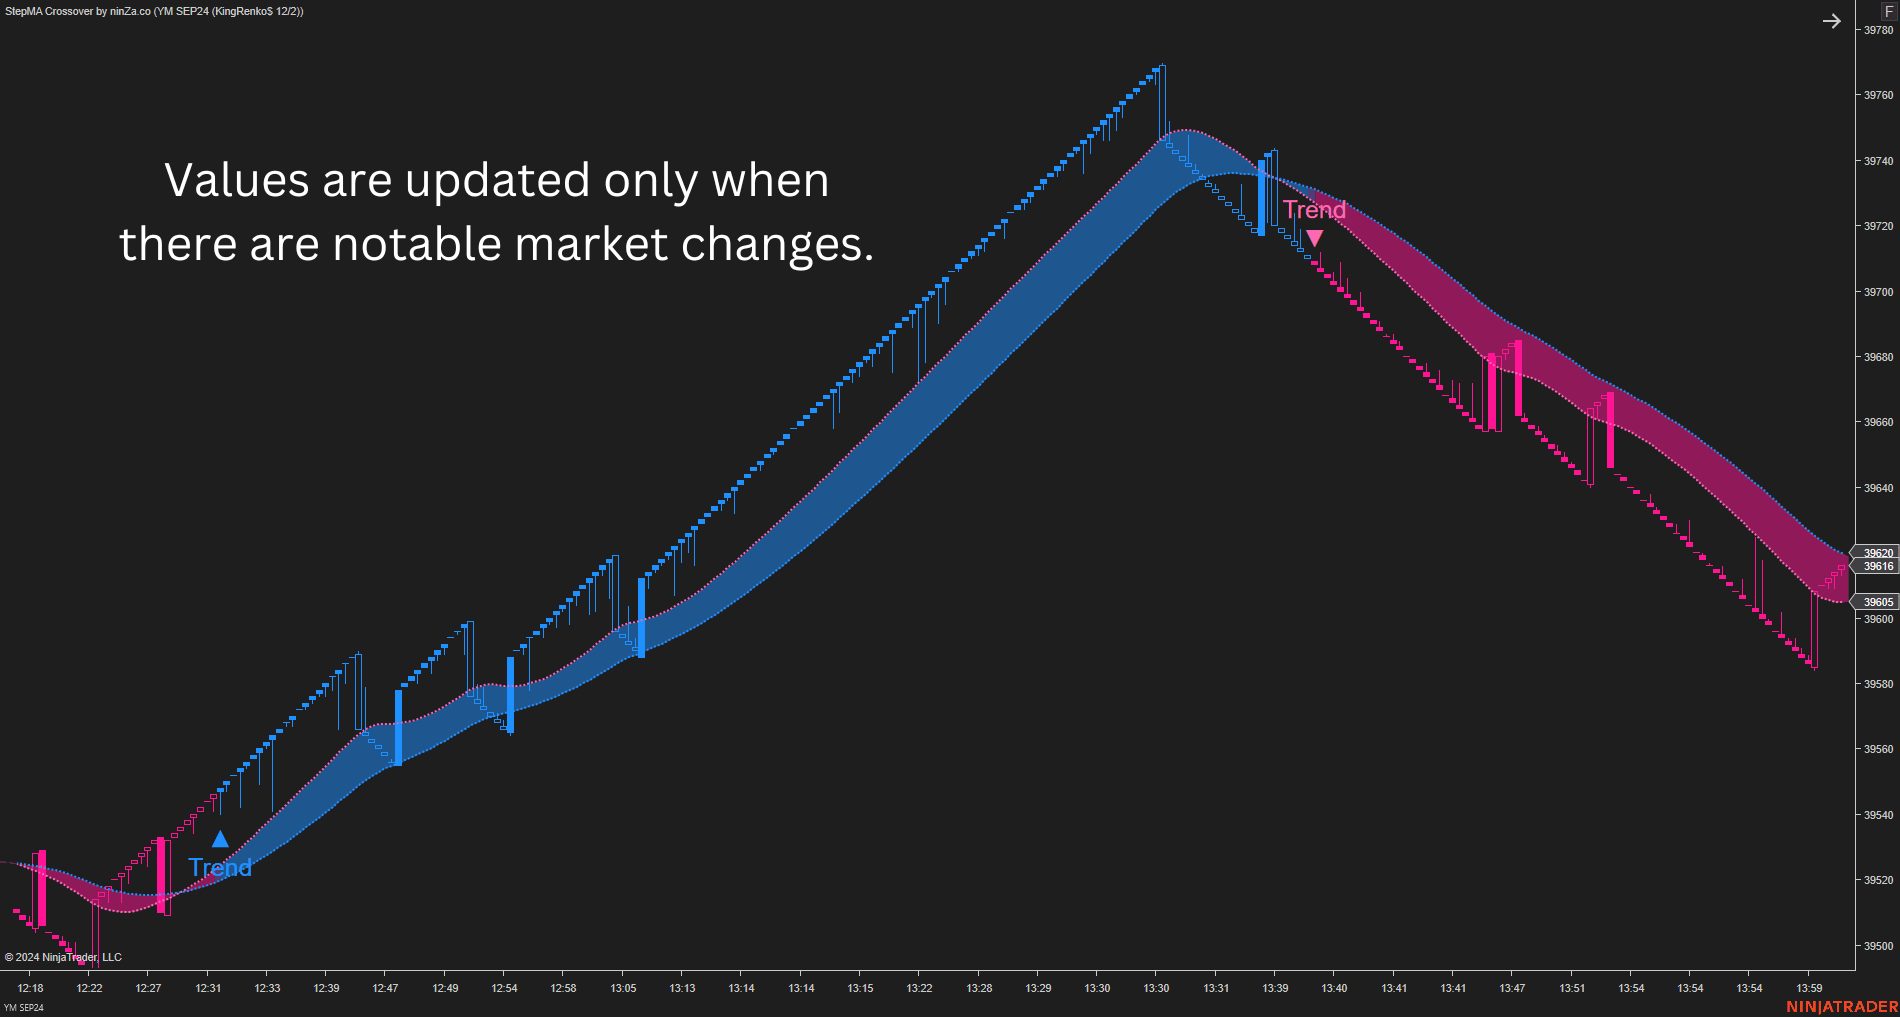
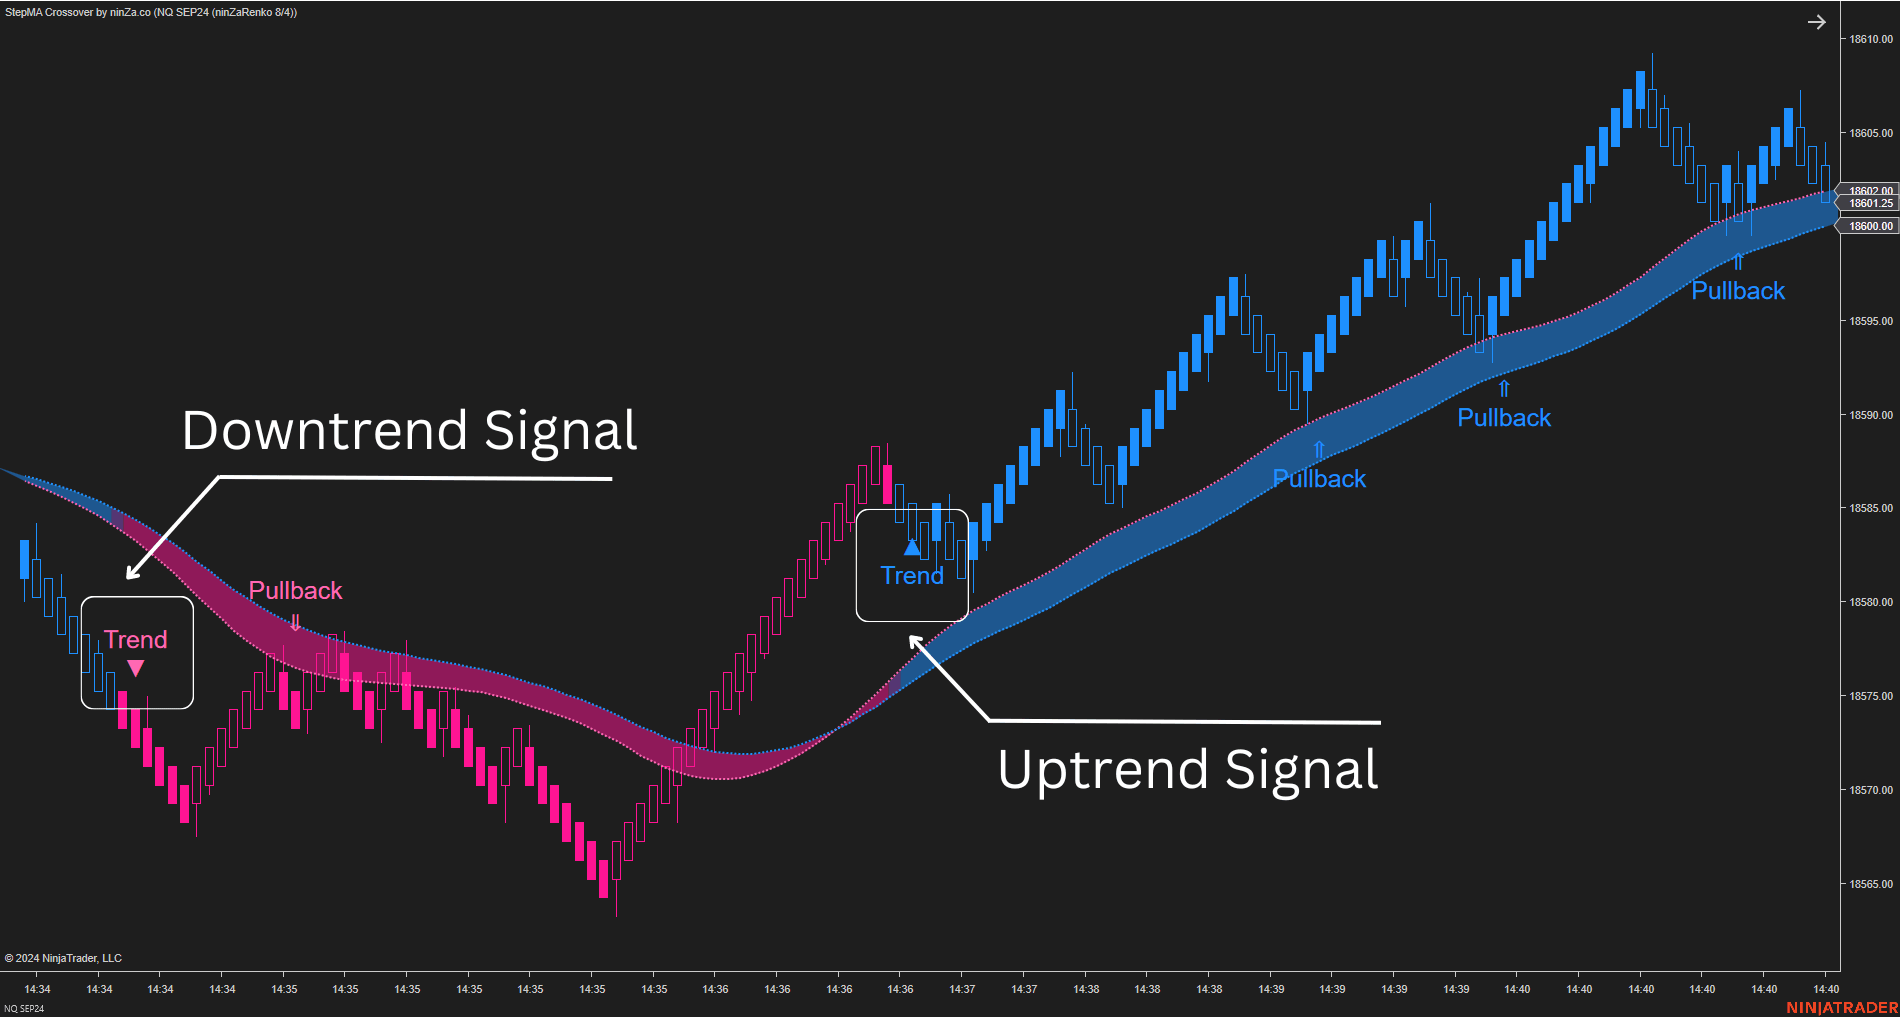
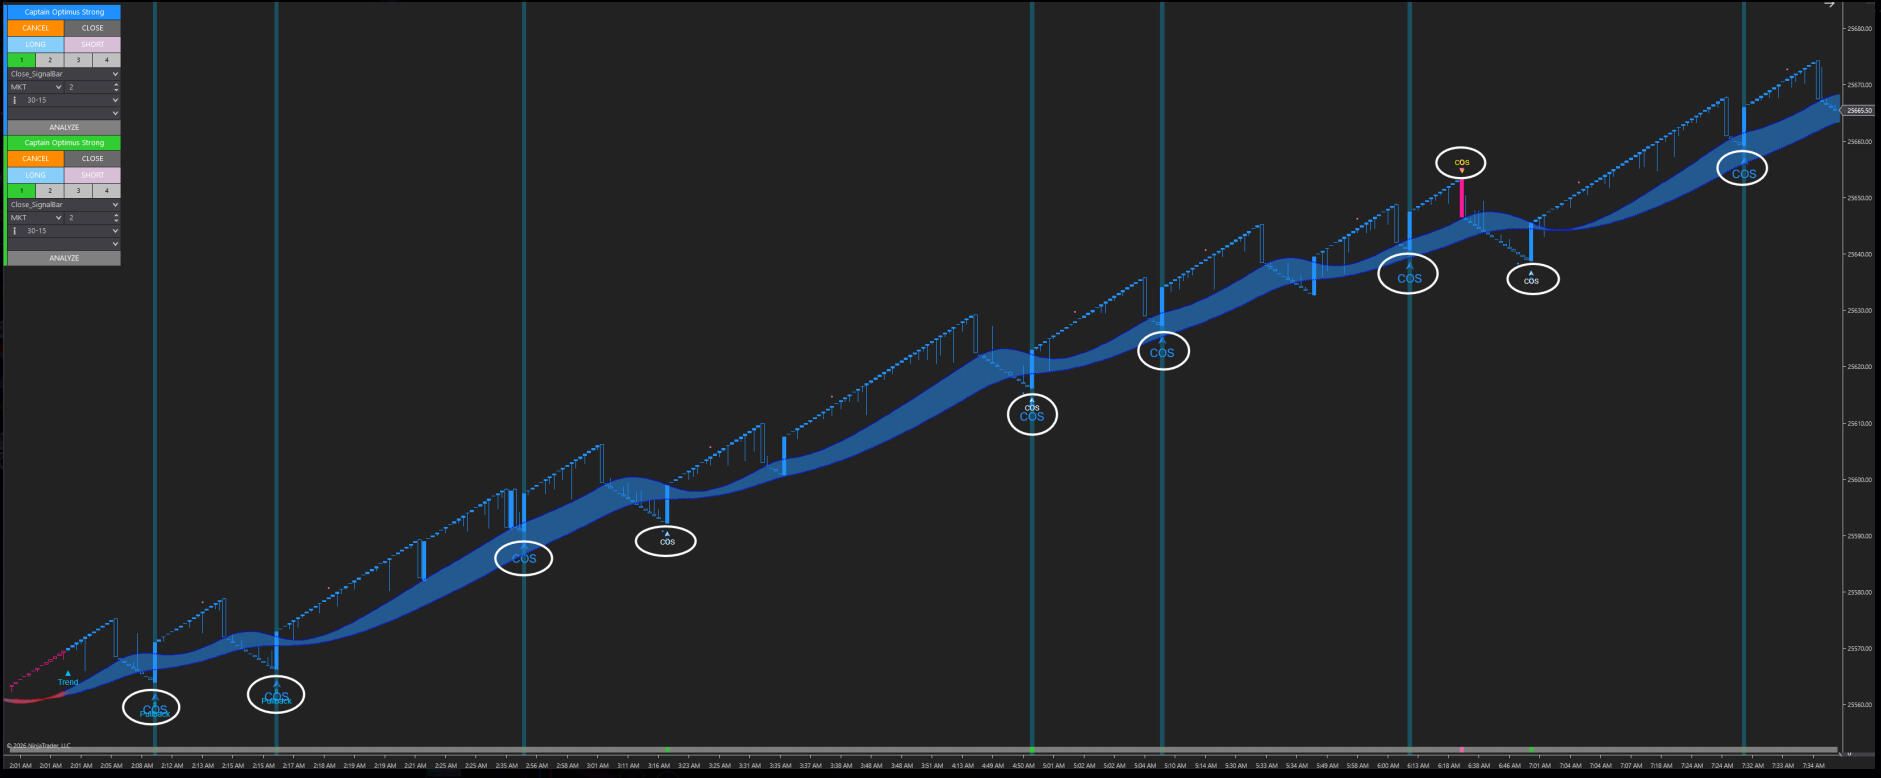
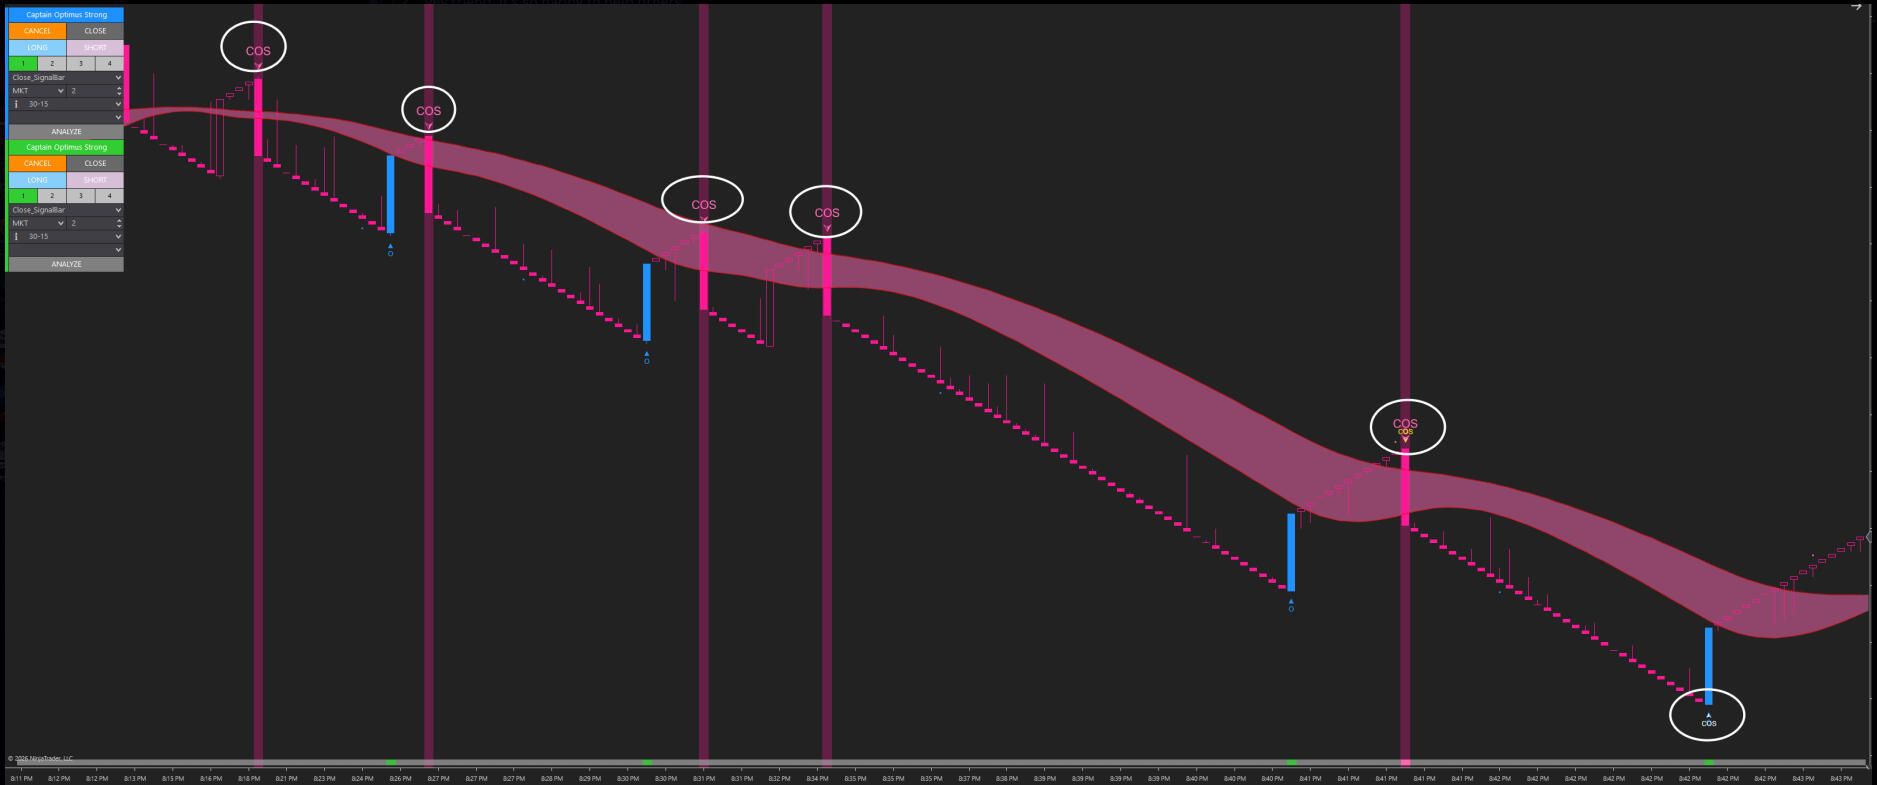
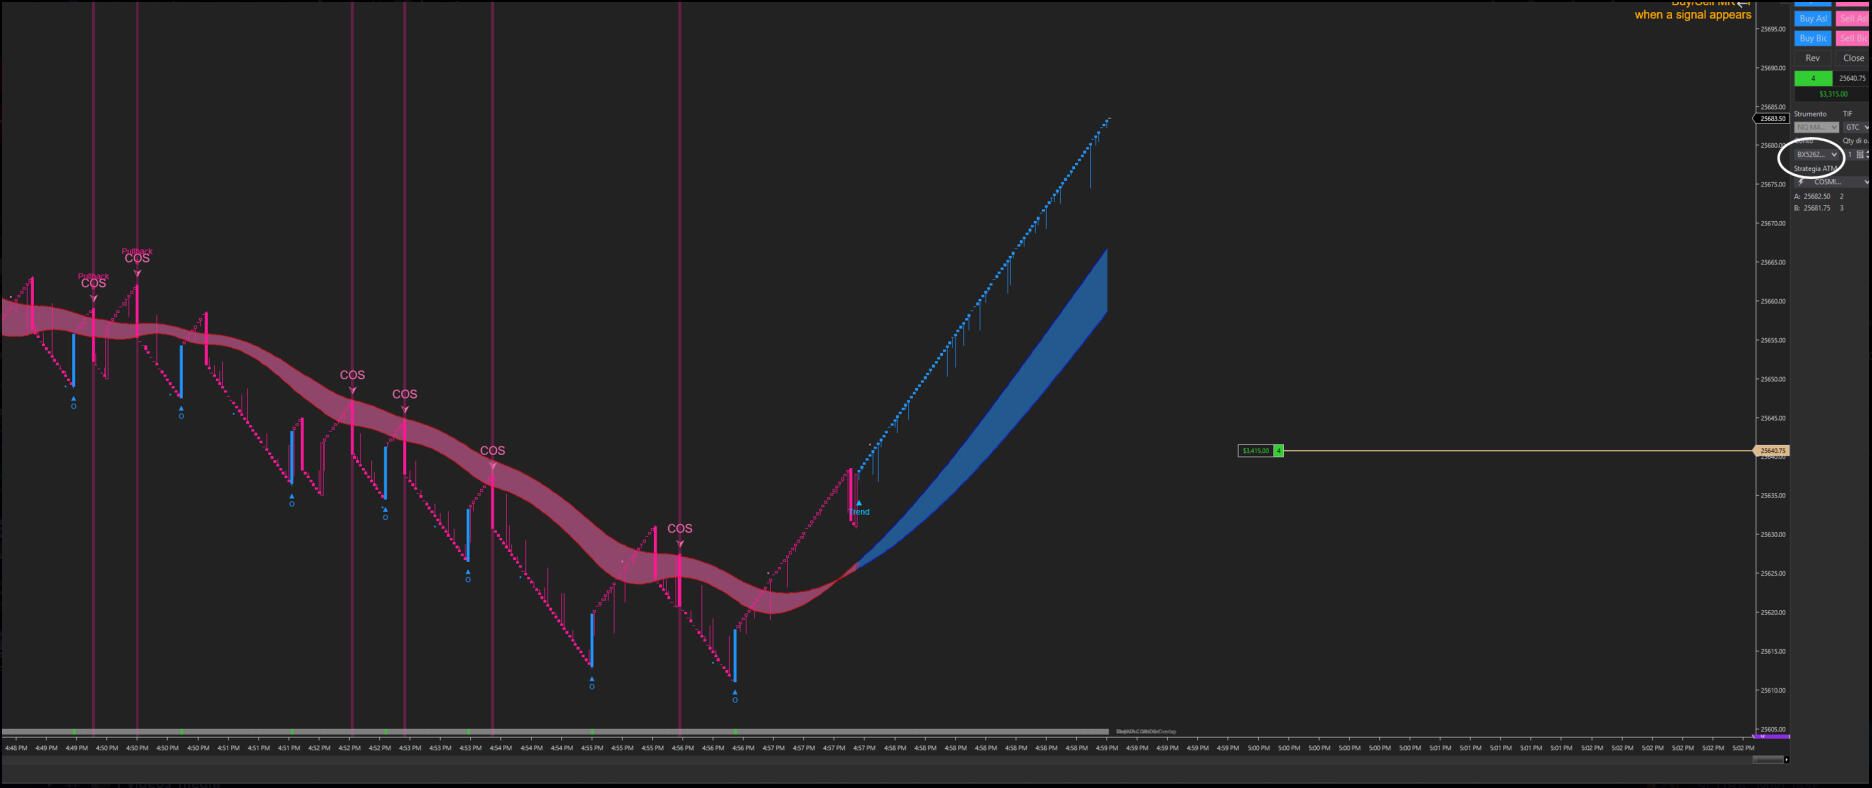
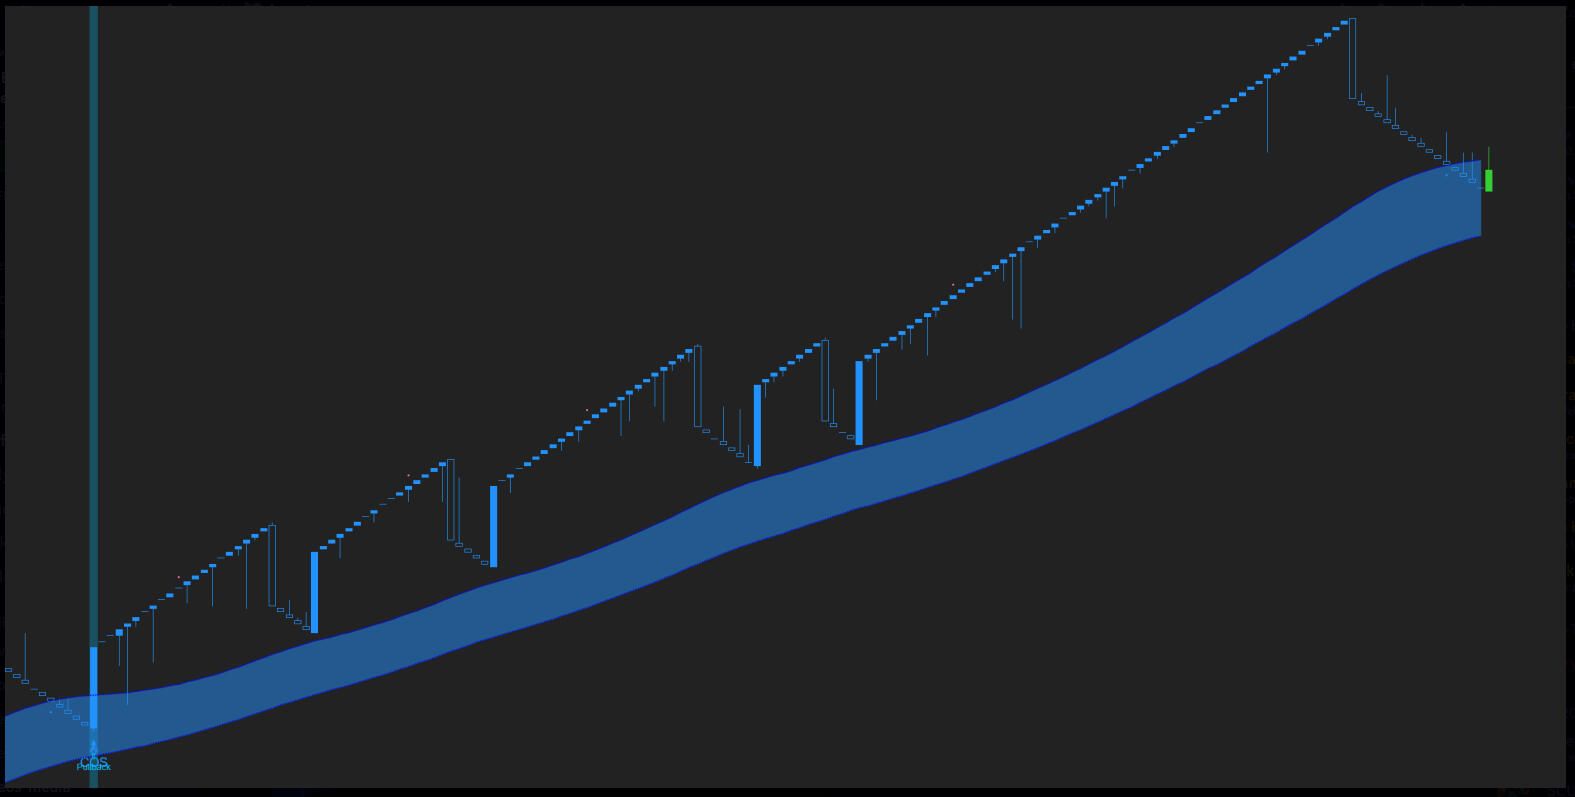
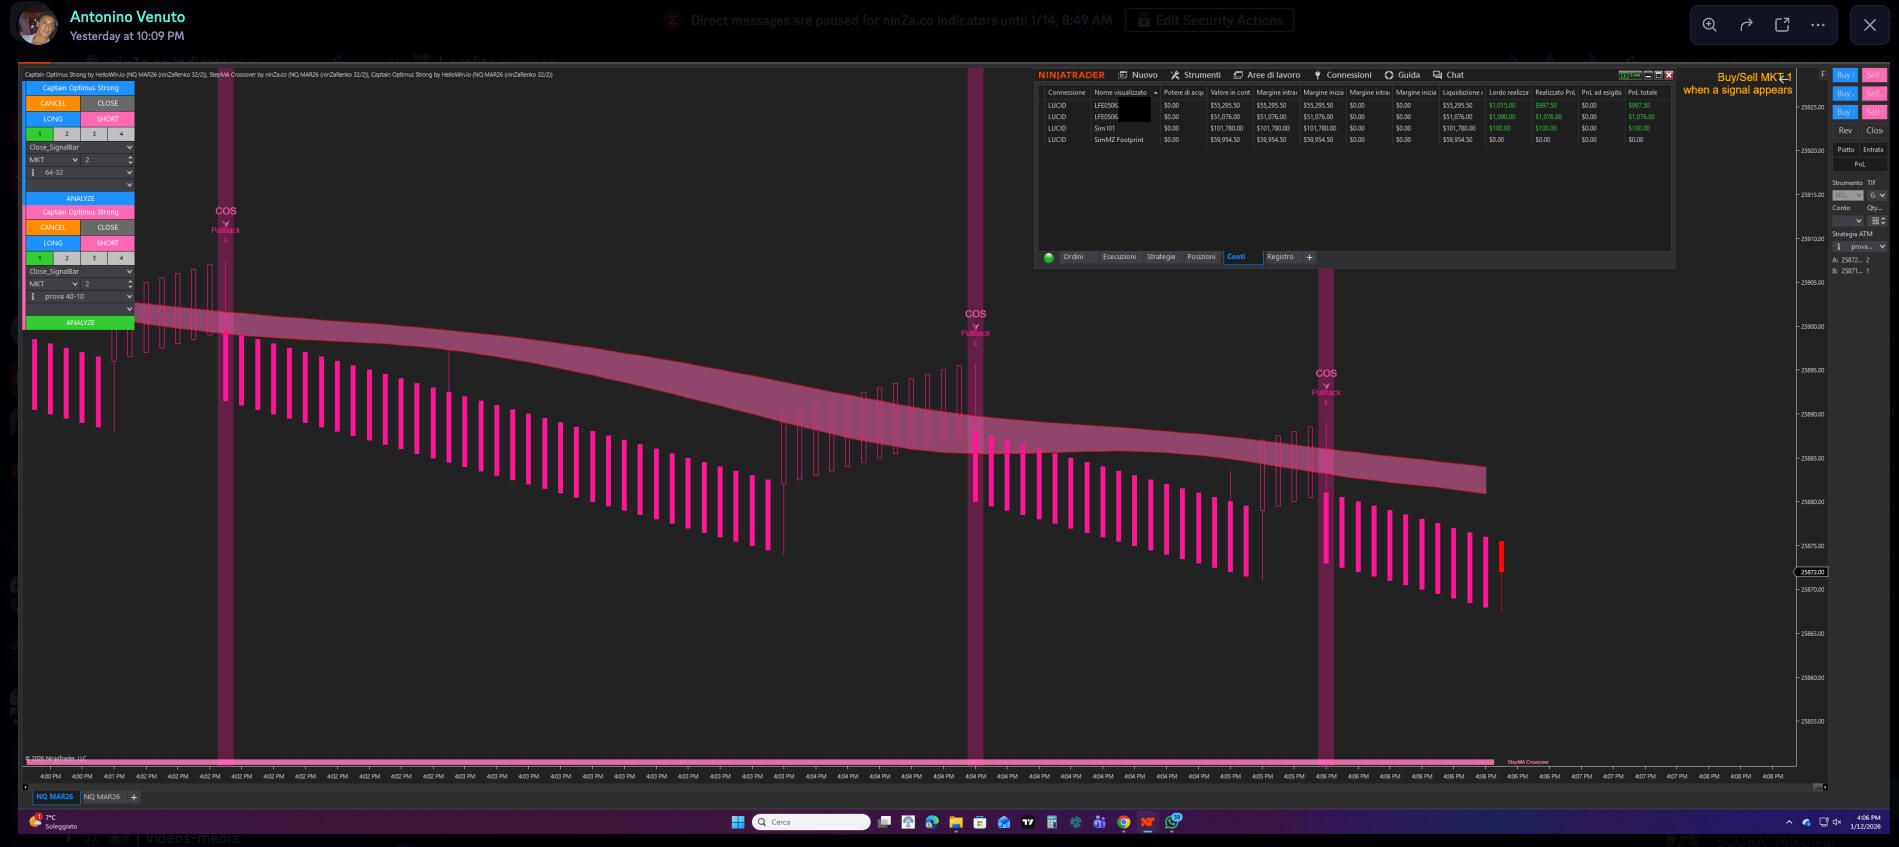
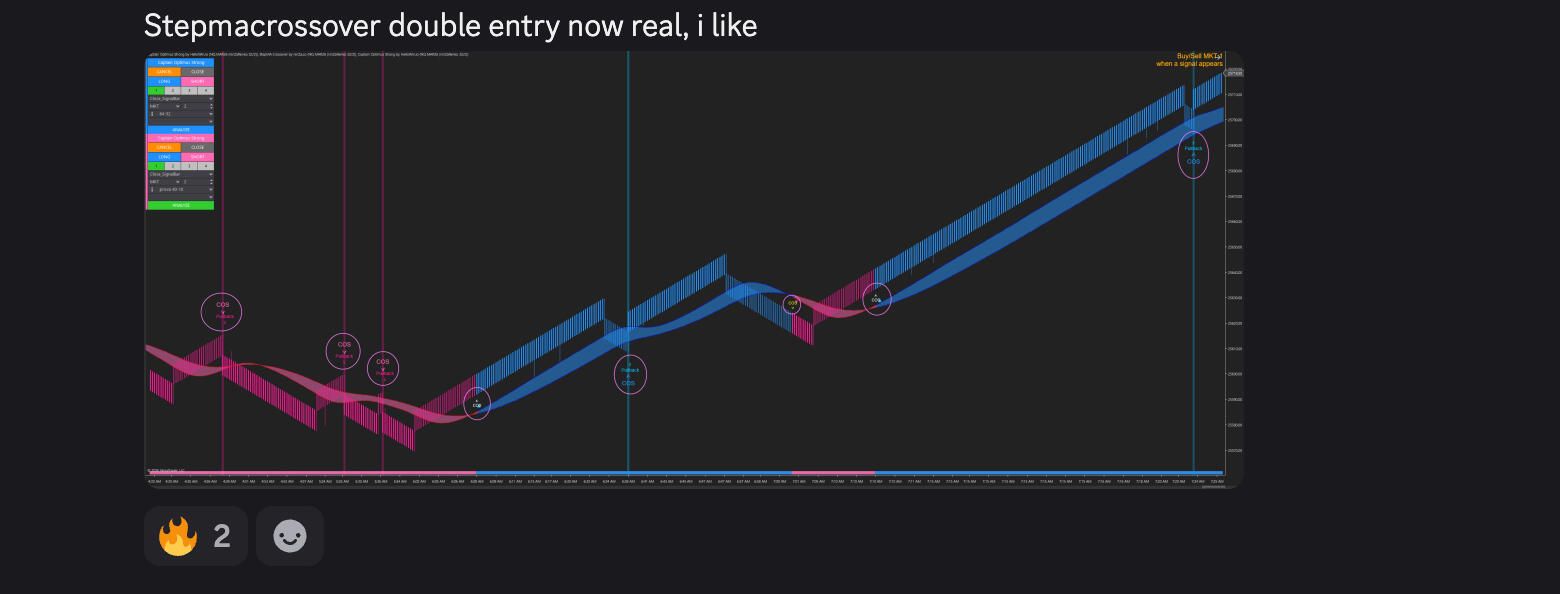
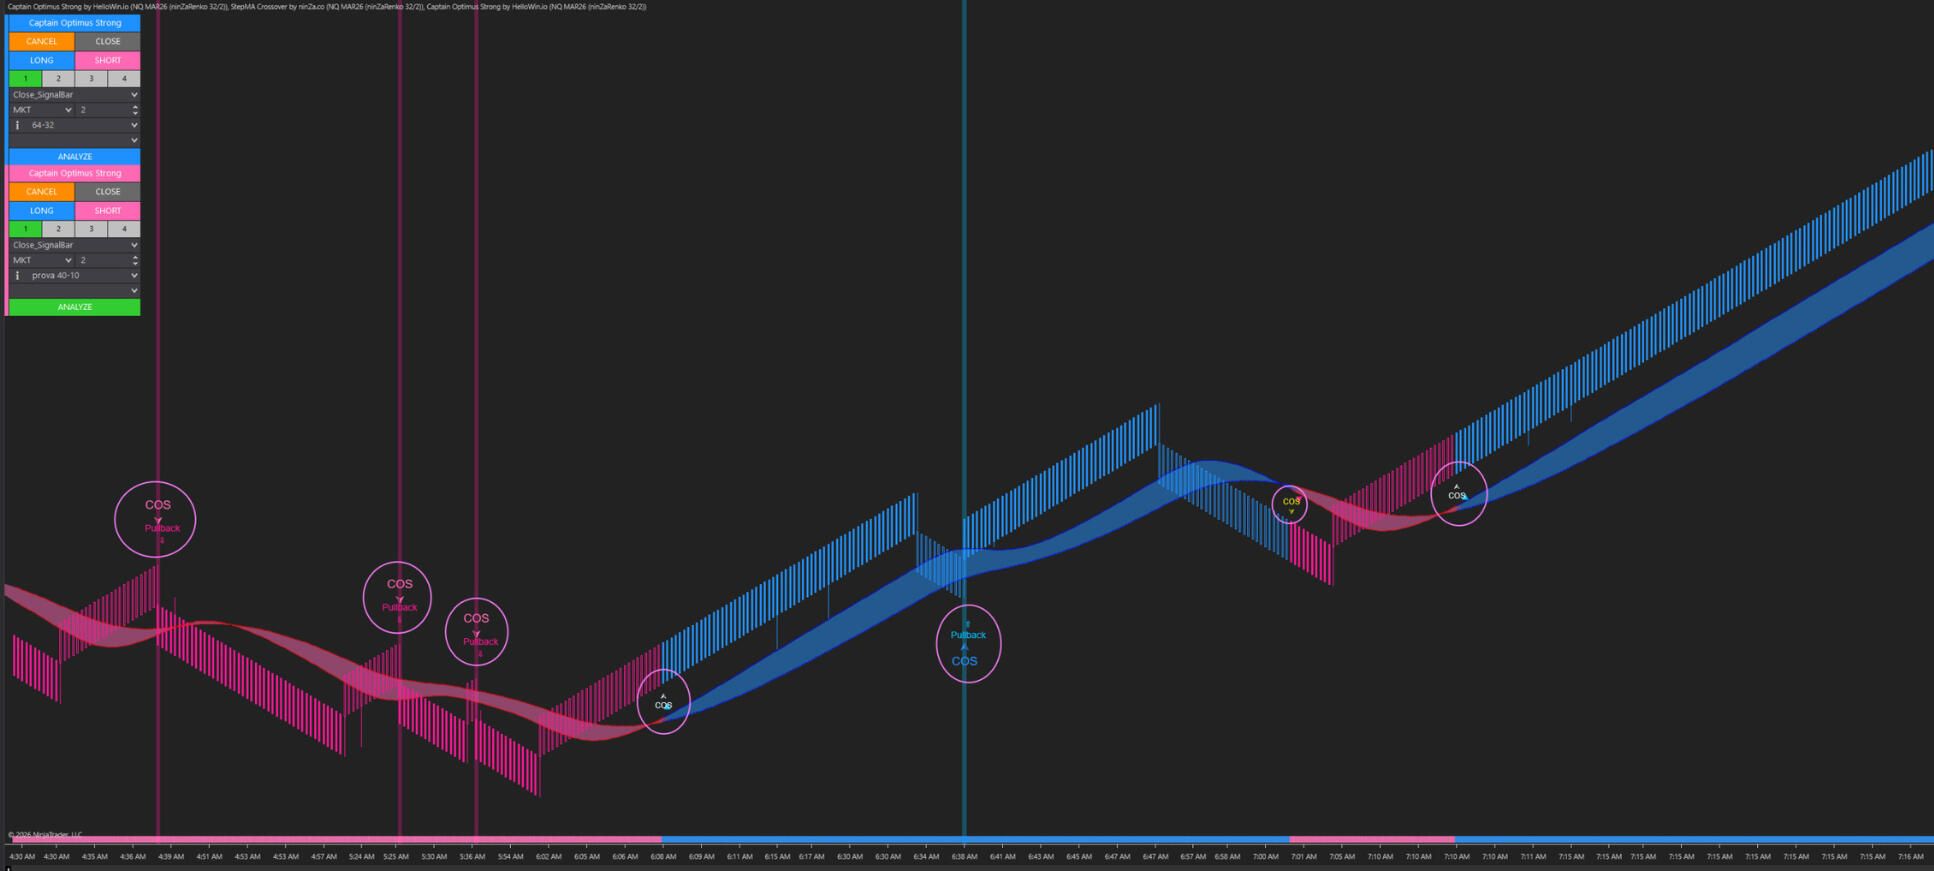
StepMA Crossover identifies directional bias using stable fast and slow StepMA logic. Its ribbon zones help organize the chart into trend direction and potential pullback areas, allowing focus on setups that remain aligned with the broader market context.
Evaluate momentum with Multi-Osc OB/OS Overlap
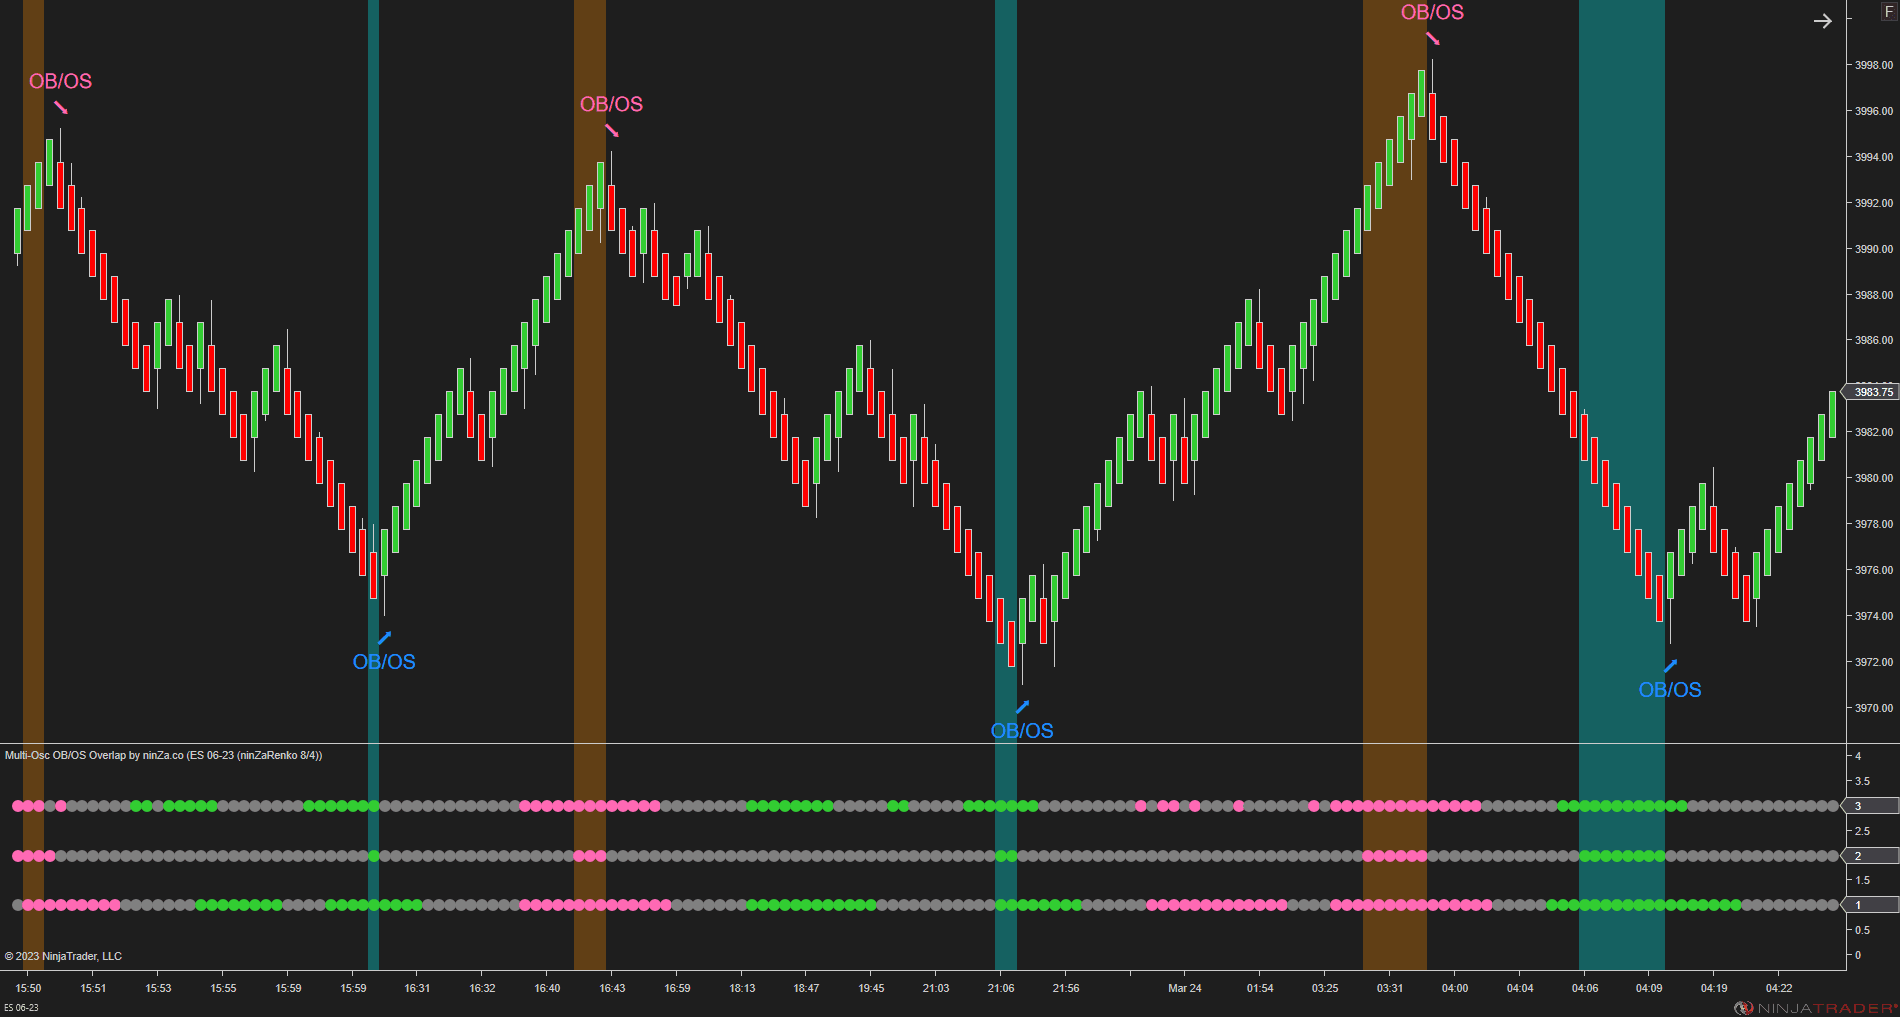
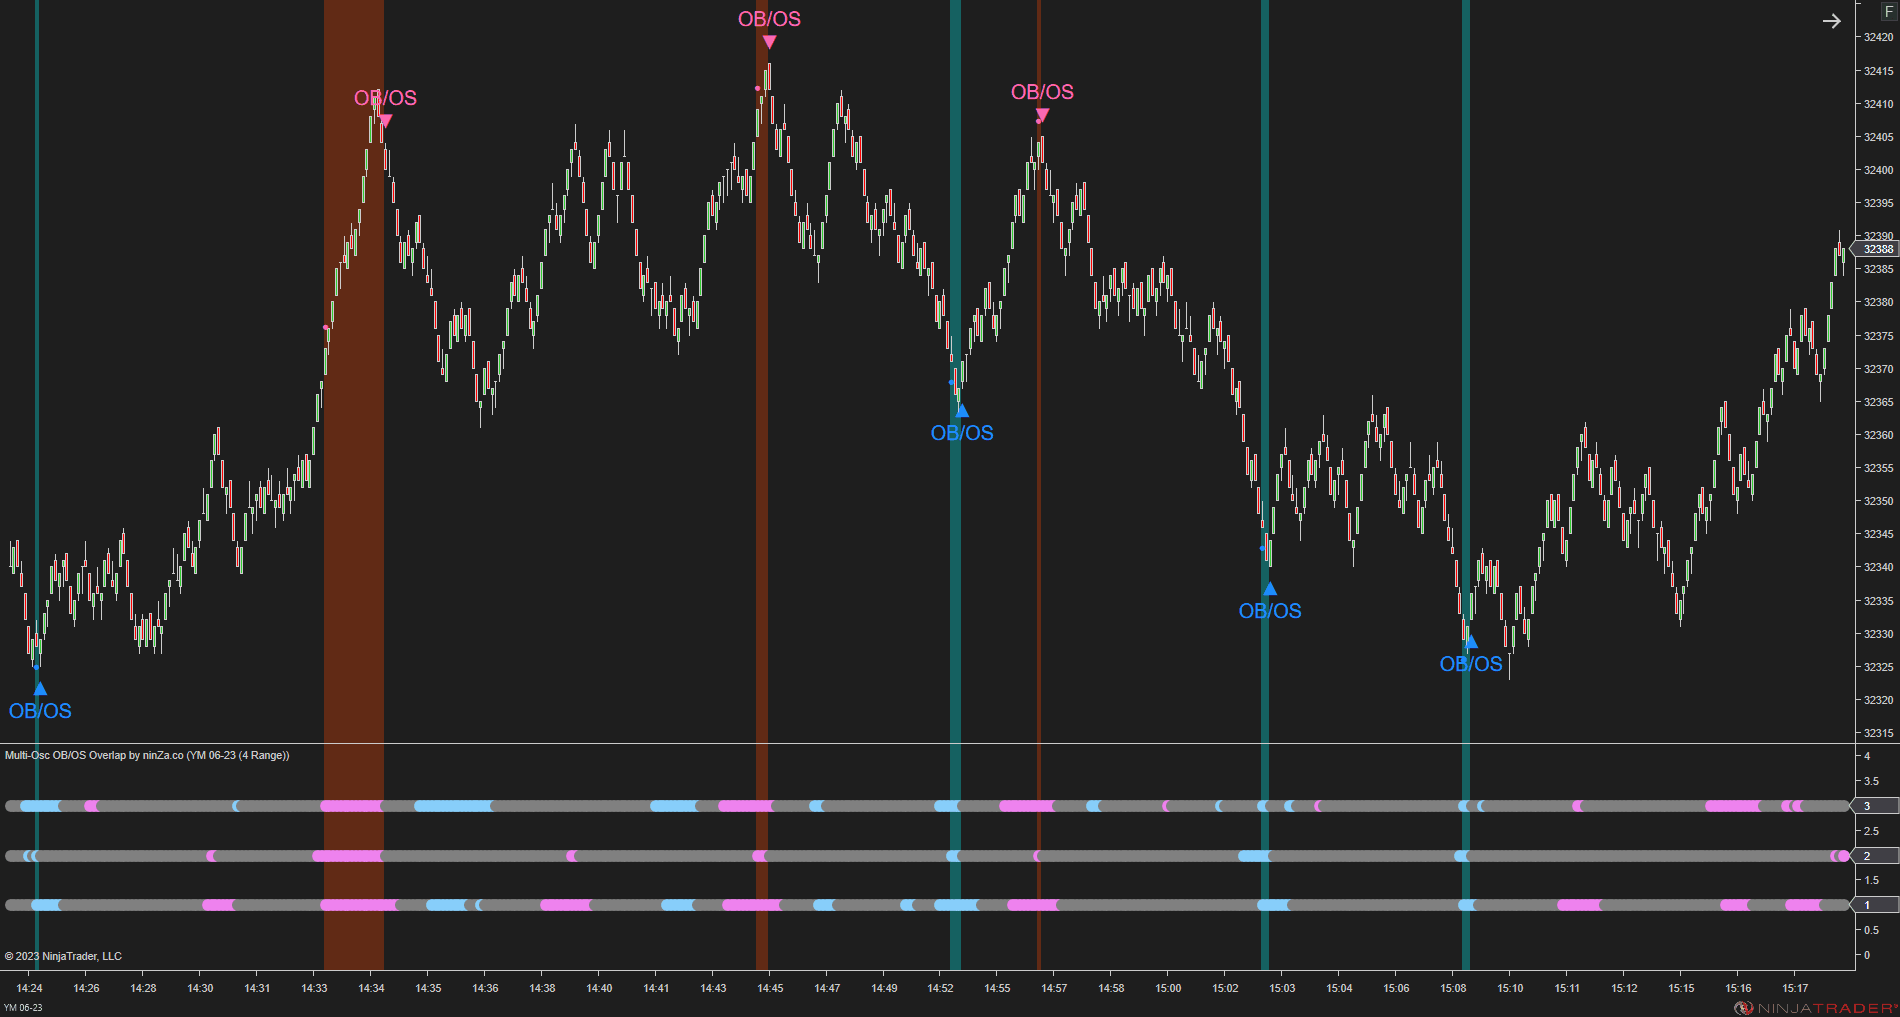
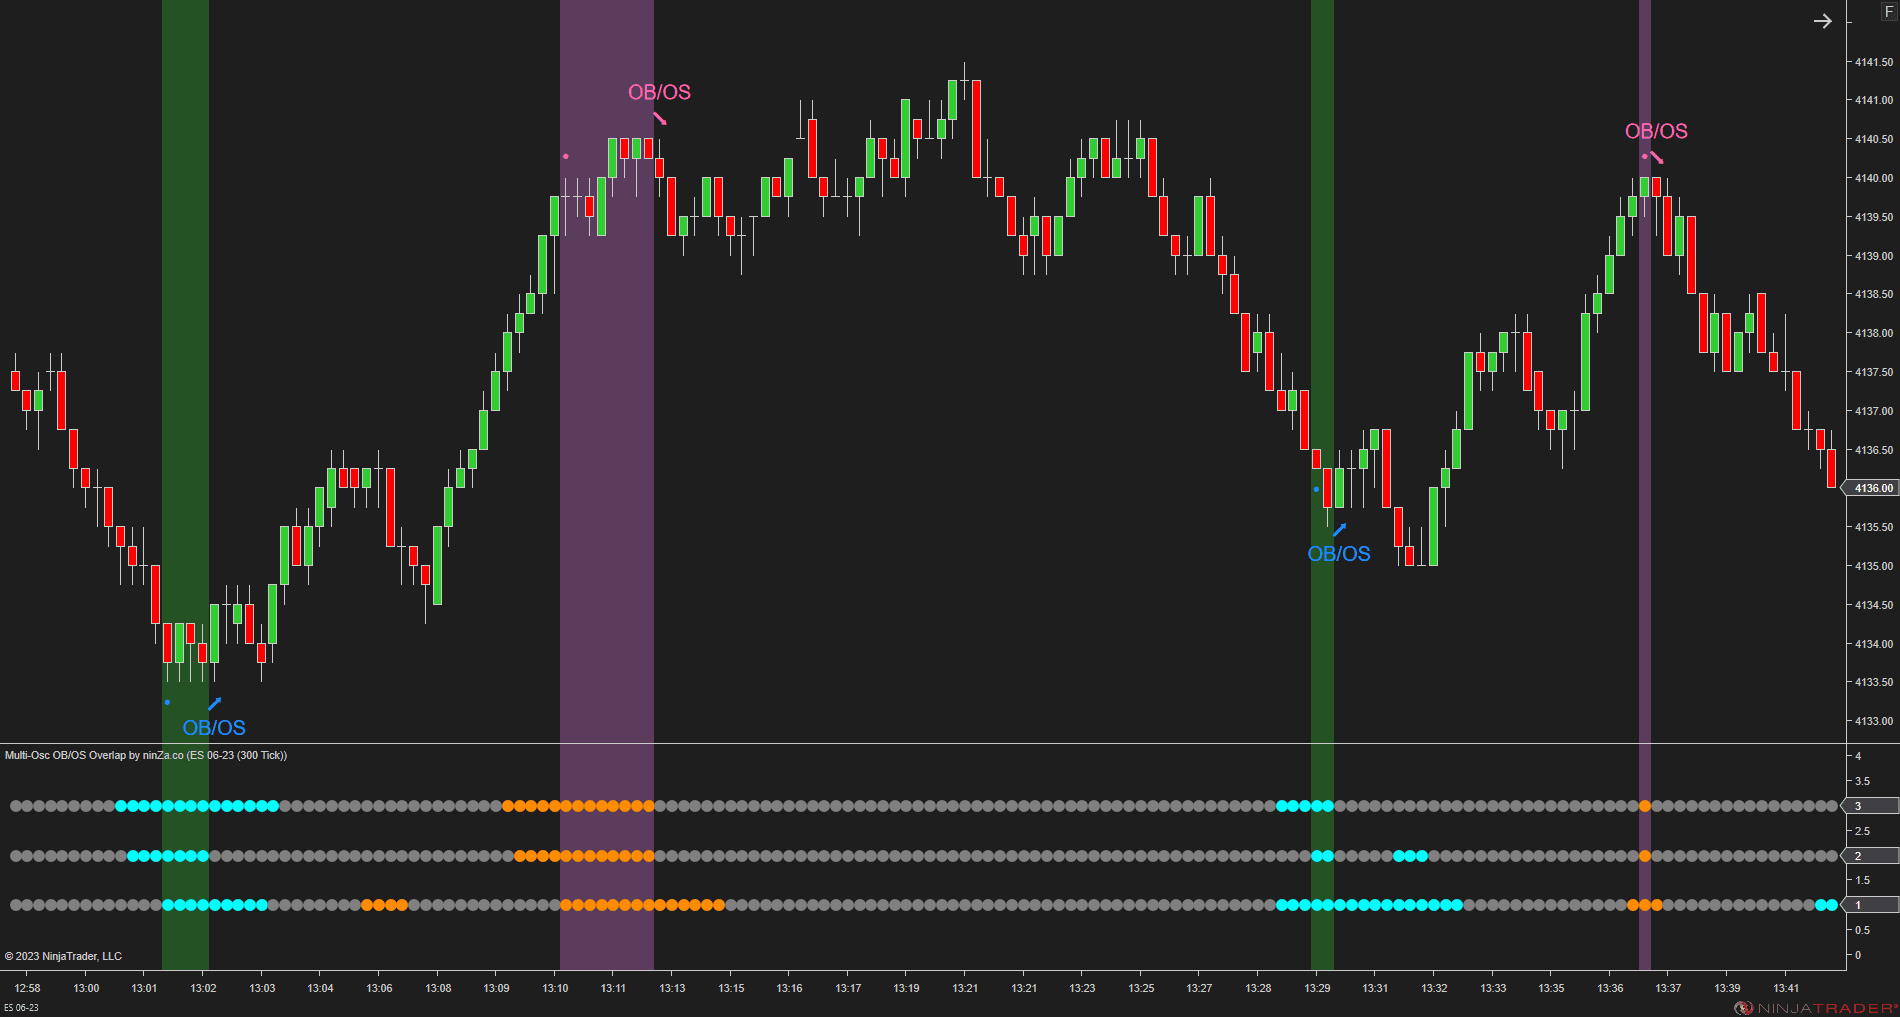
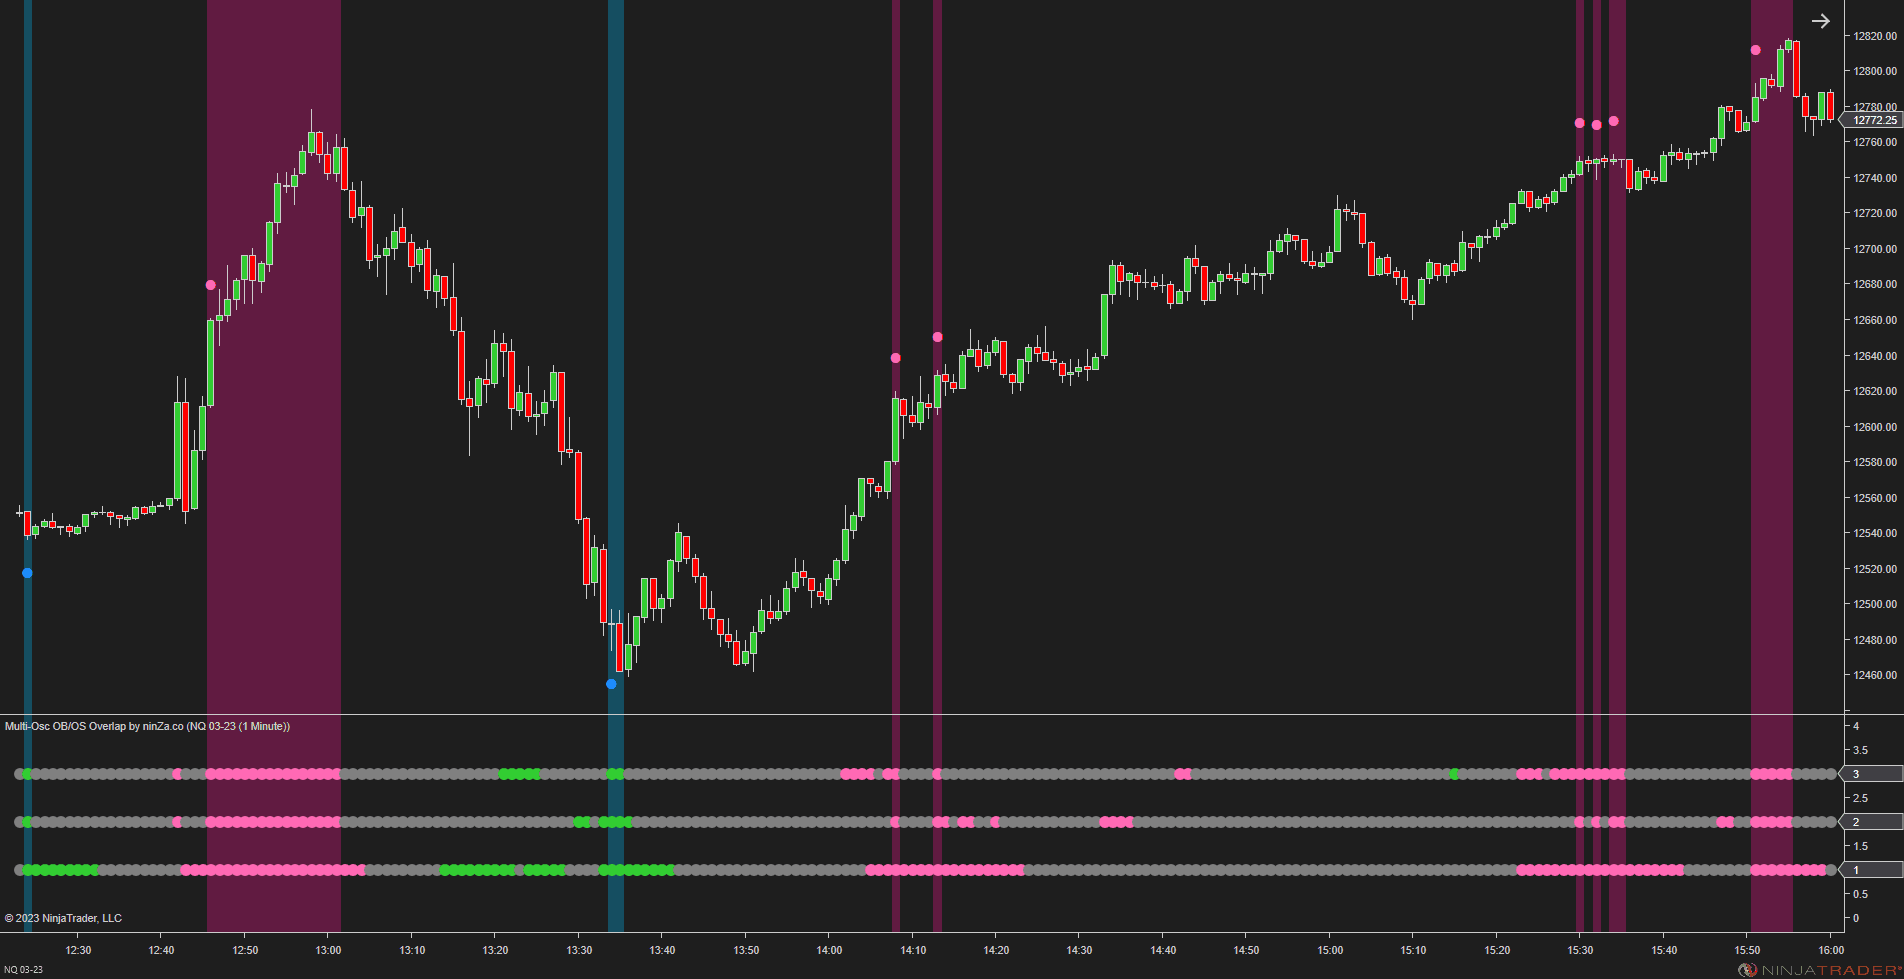
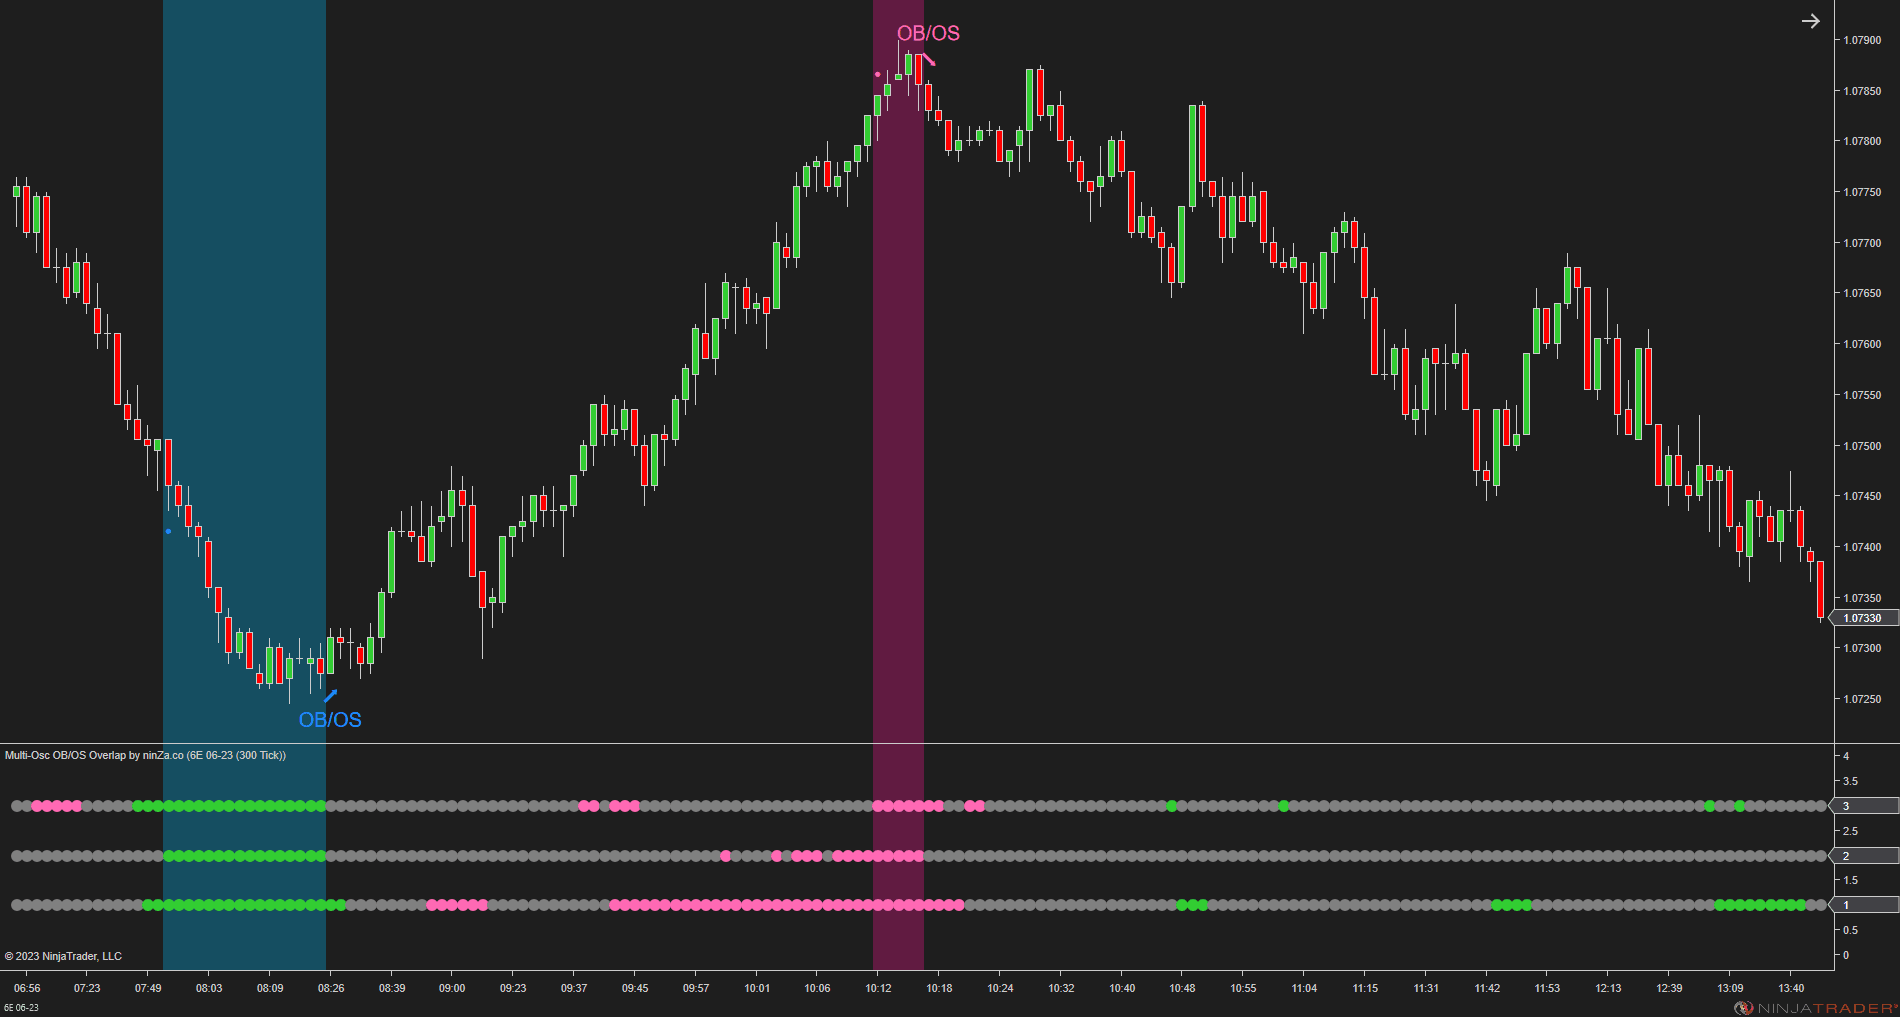
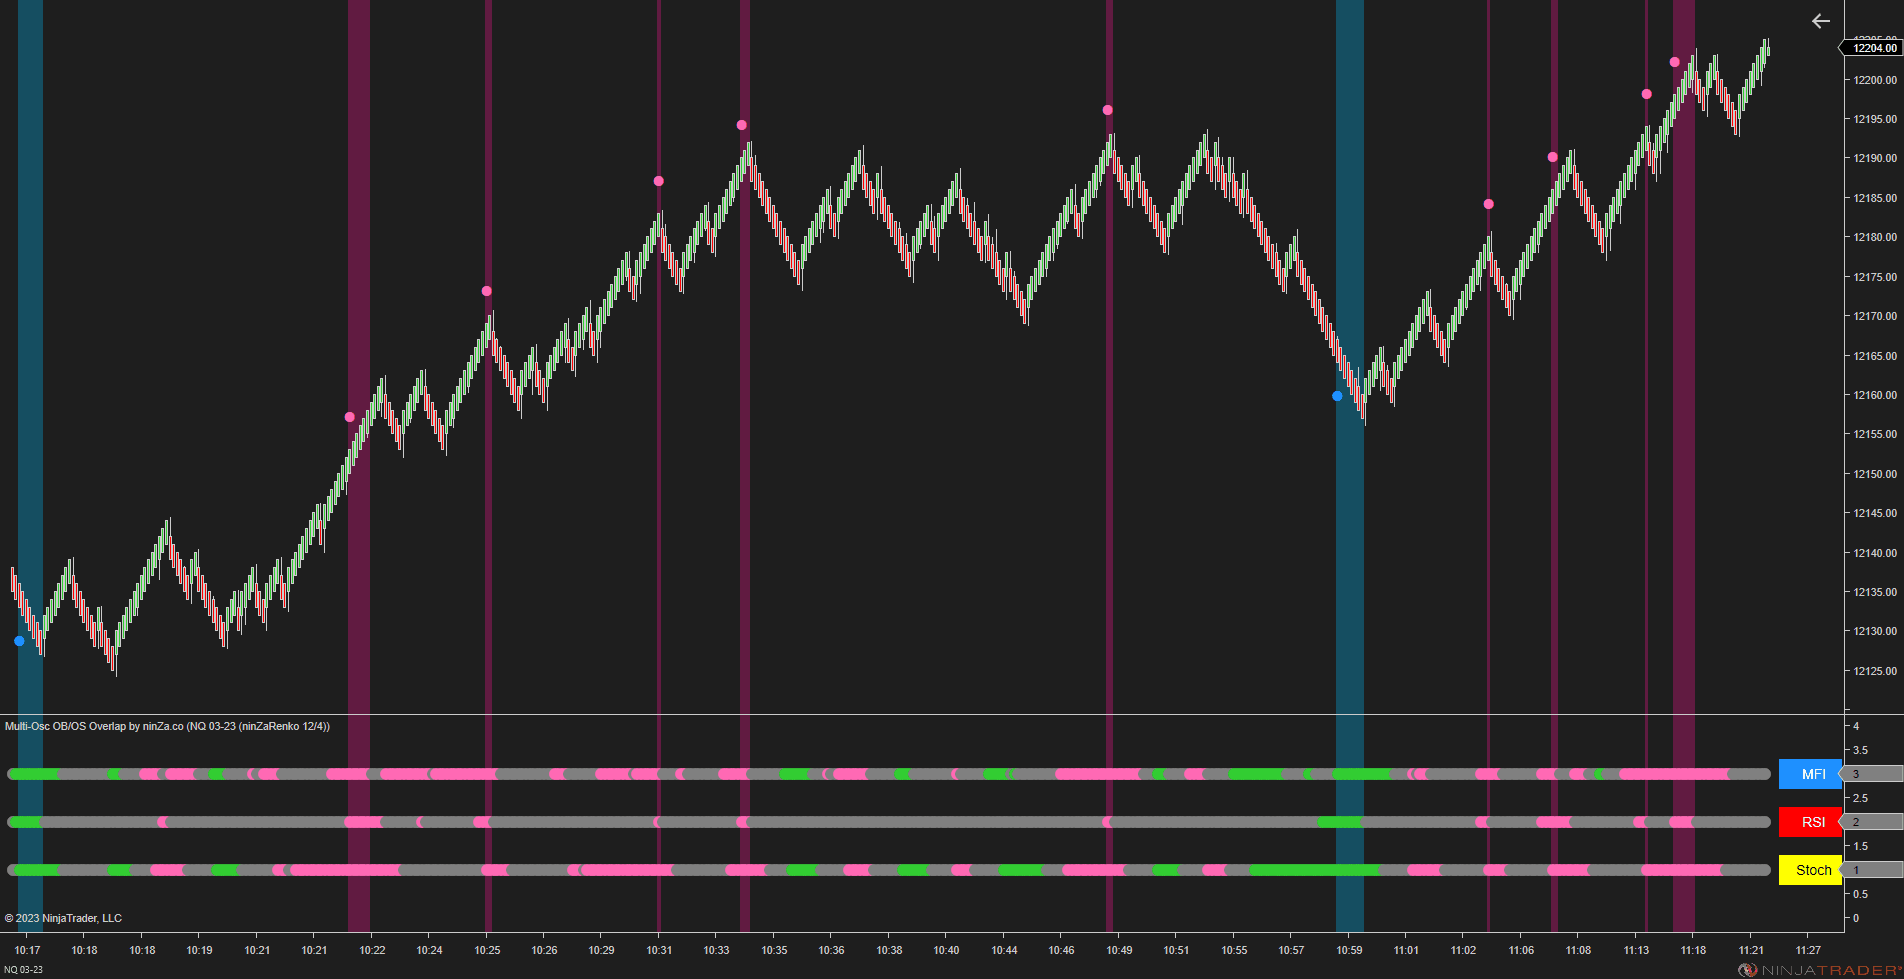
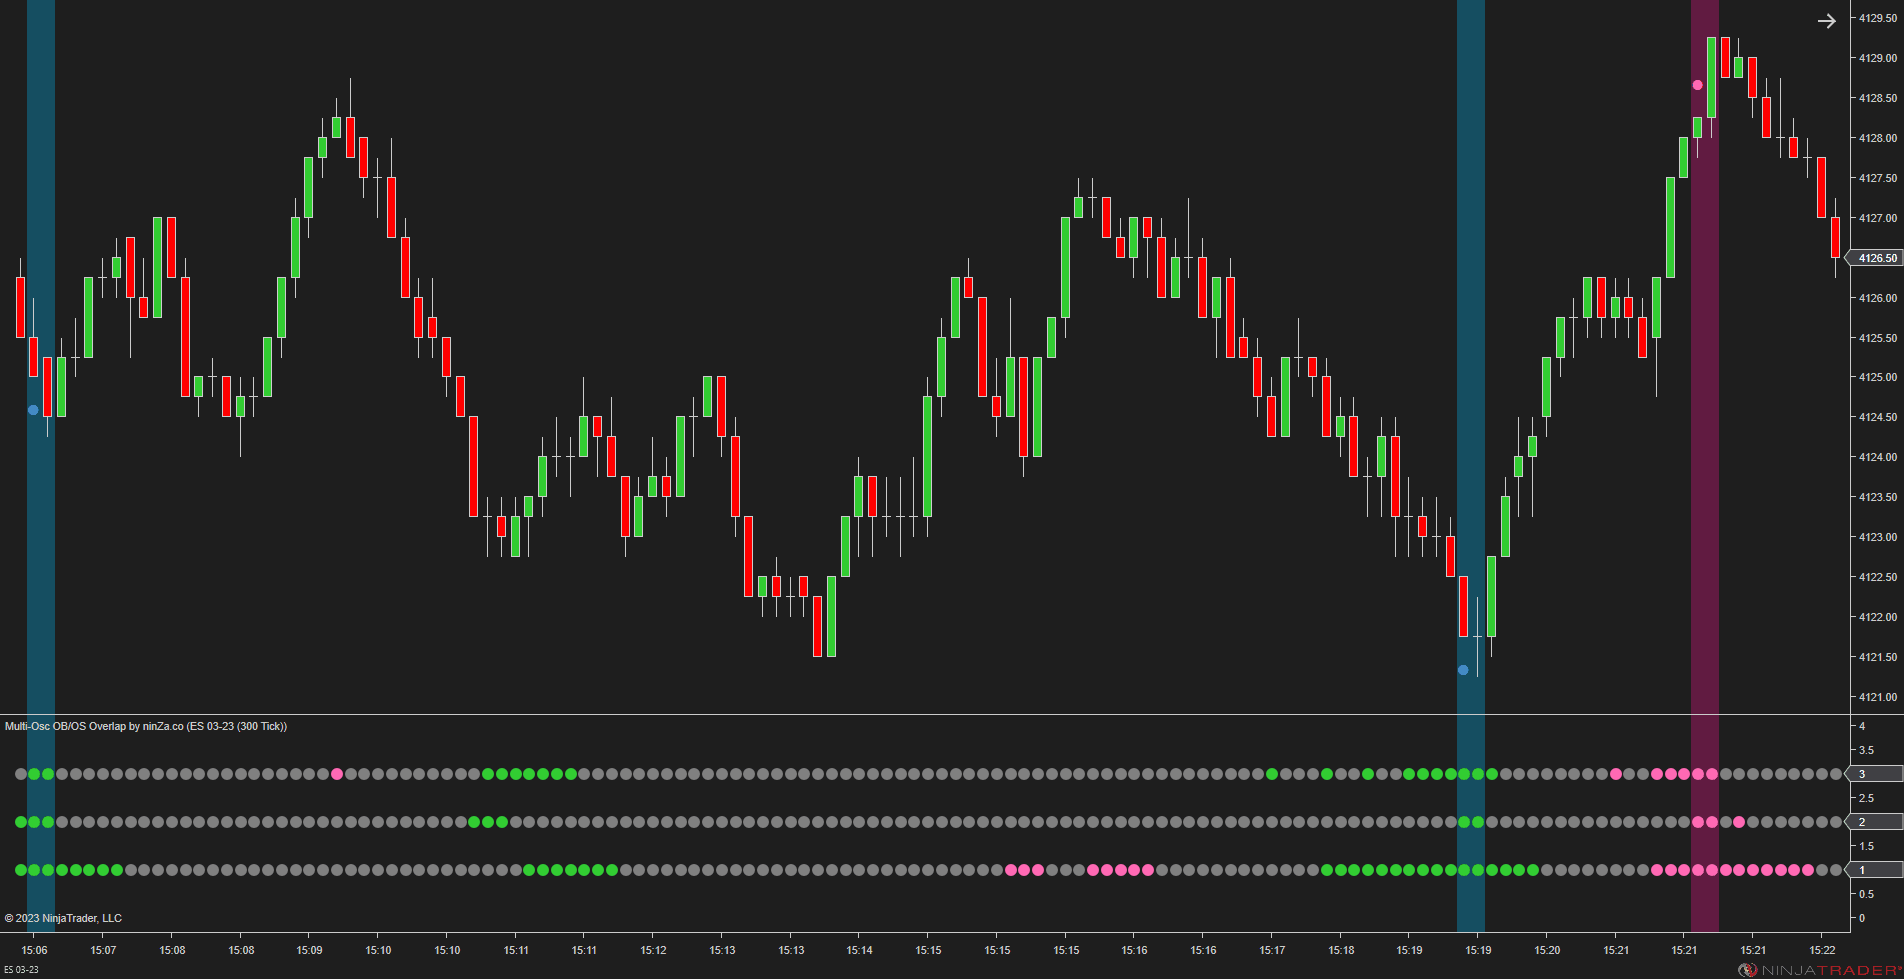
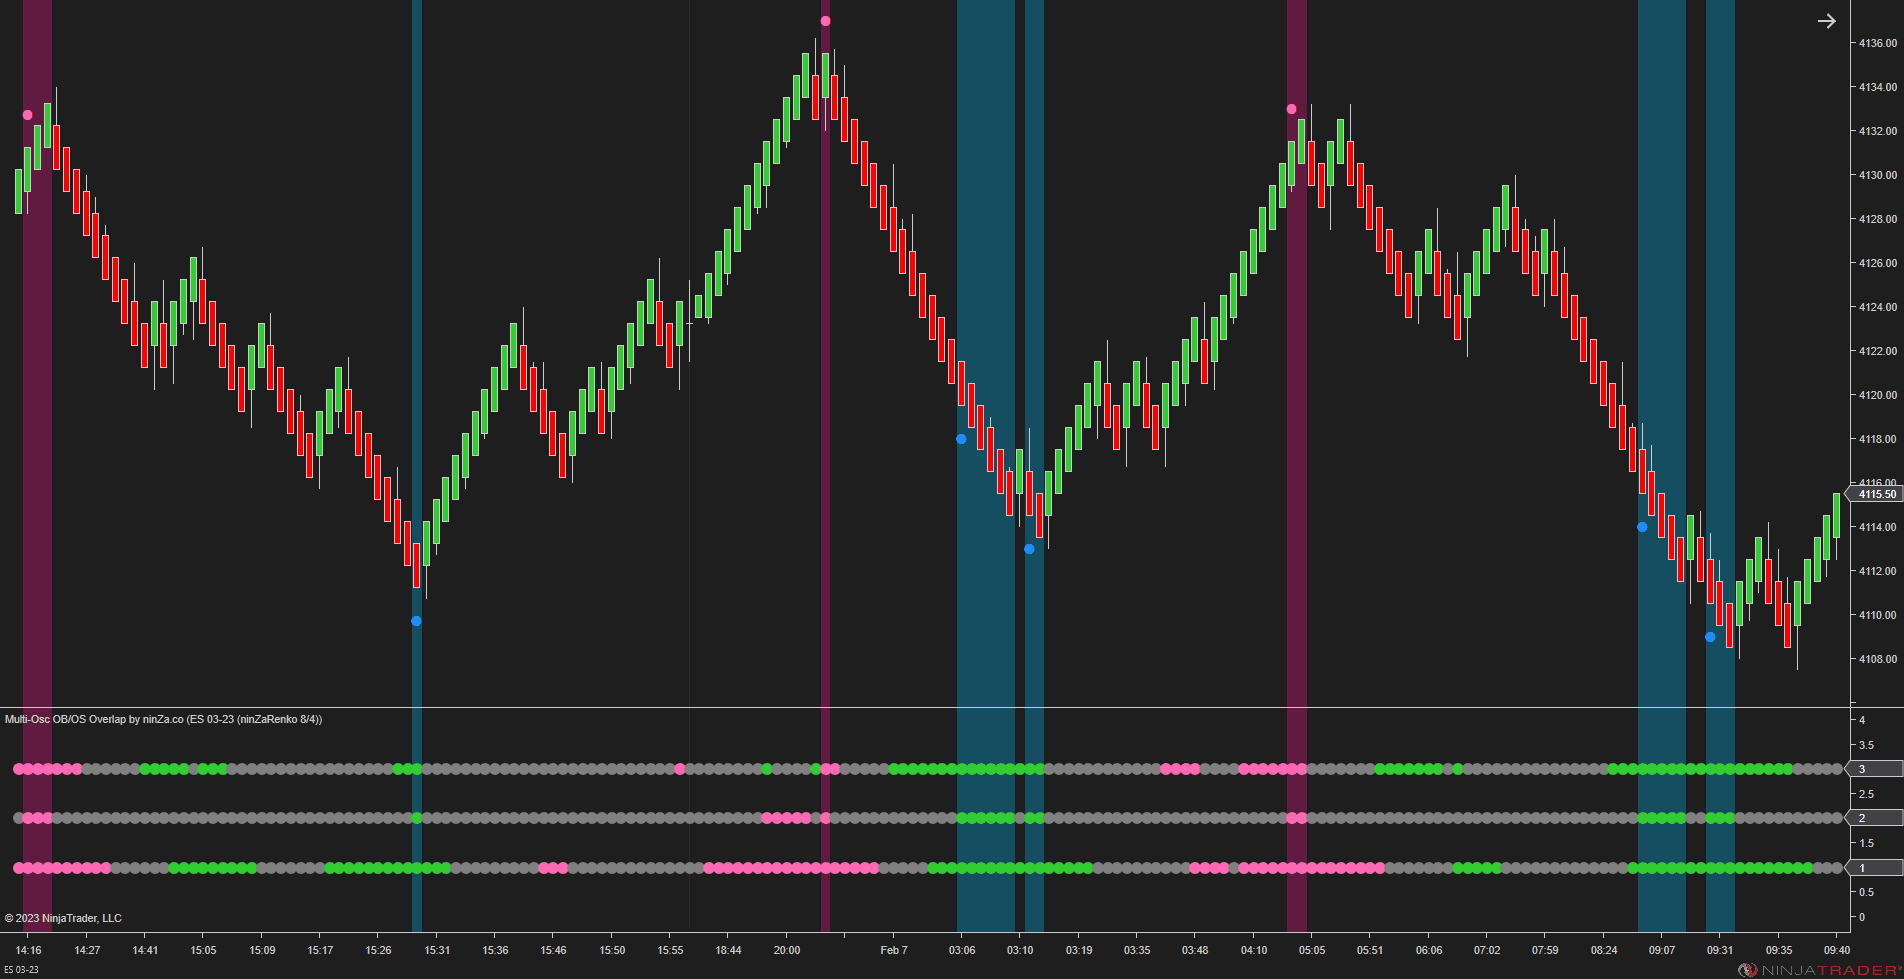
Multi-Osc OB/OS Overlap combines RSI, MFI, and Stochastic to identify conditions where all 3 oscillators reach configured overbought or oversold levels — evaluating whether momentum supports the pullback being considered, rather than trading one oscillator as an isolated signal.
Apply execution rules with Captain Optimus Strong v2
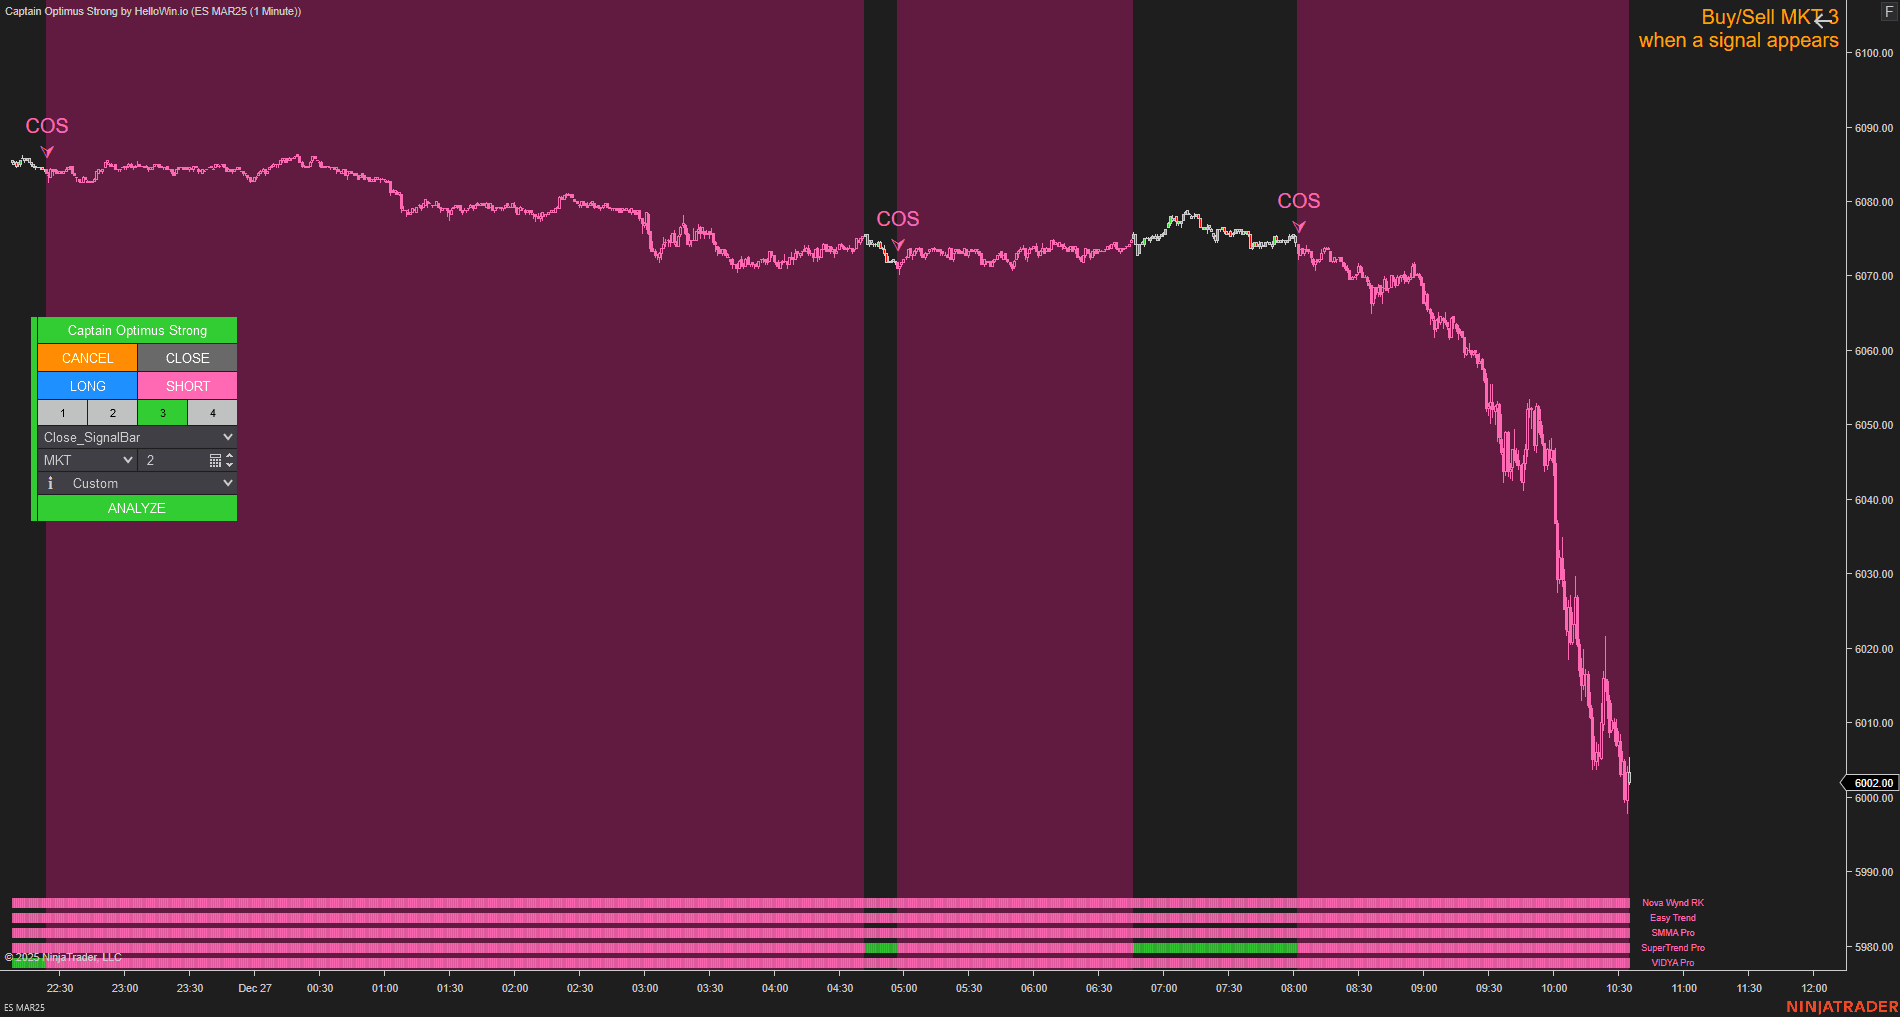
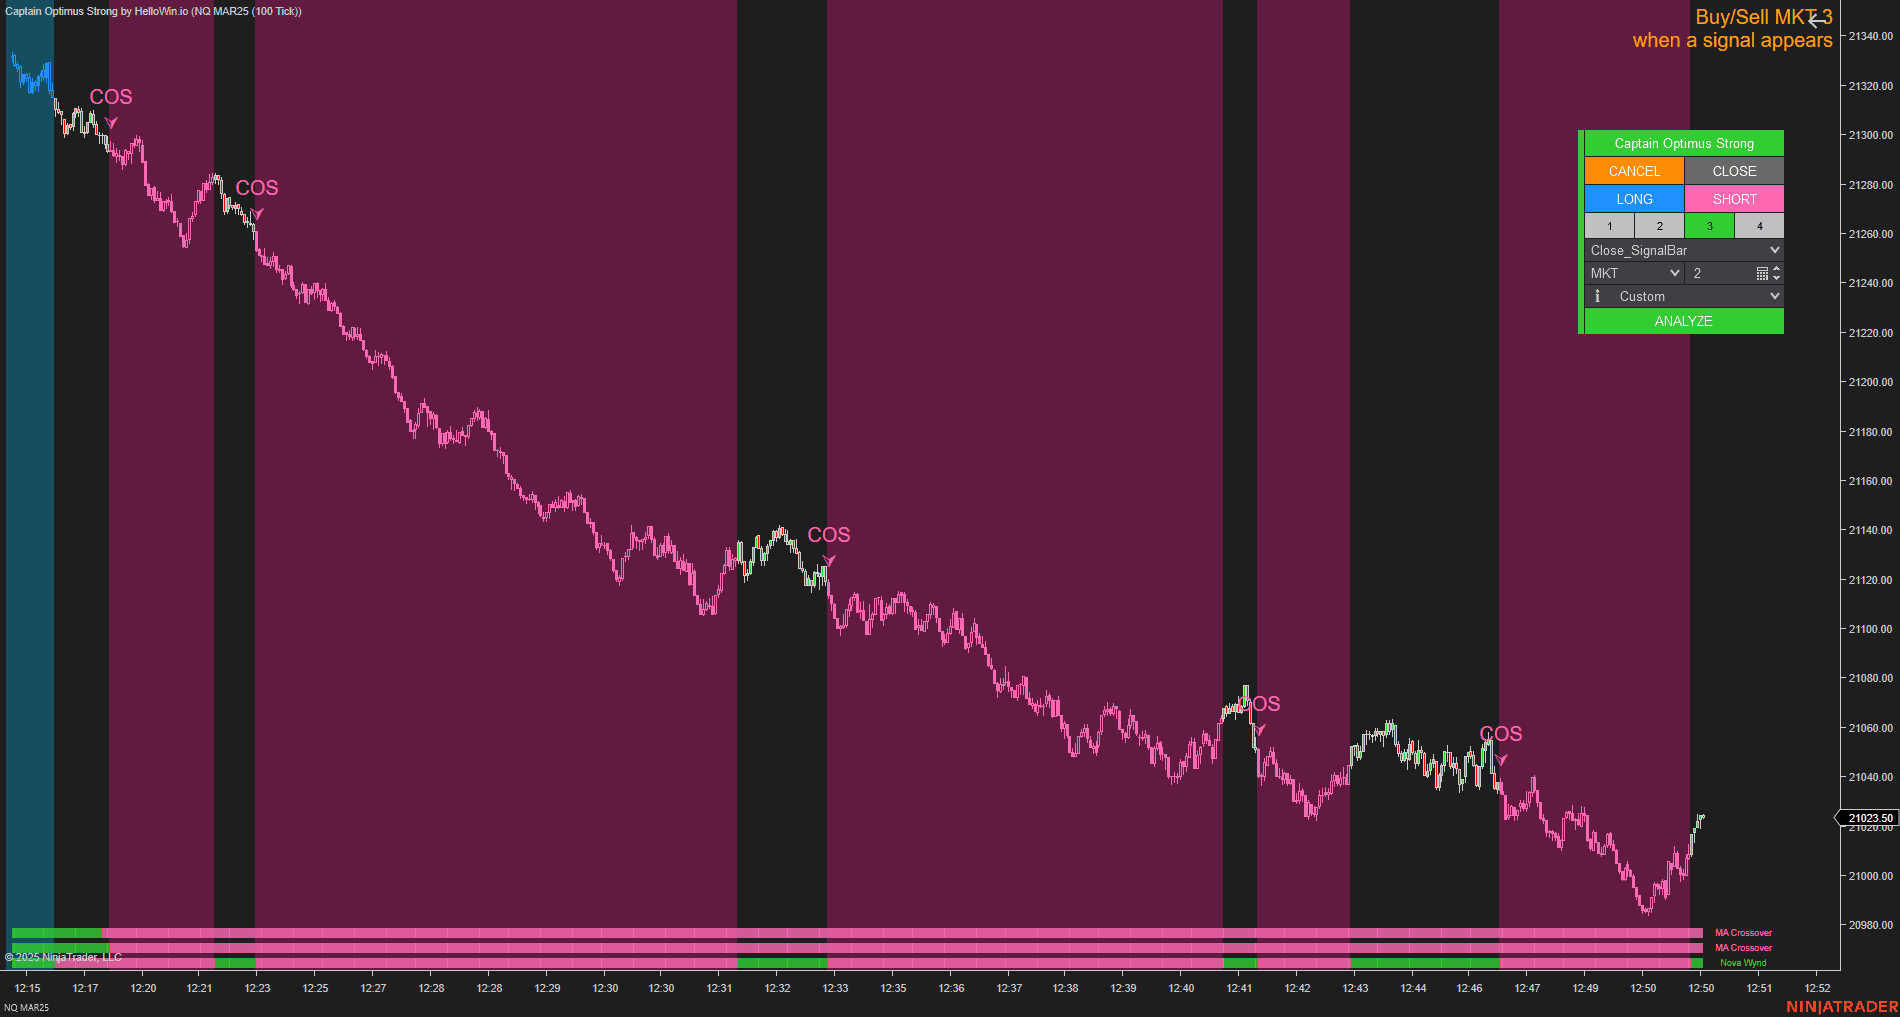
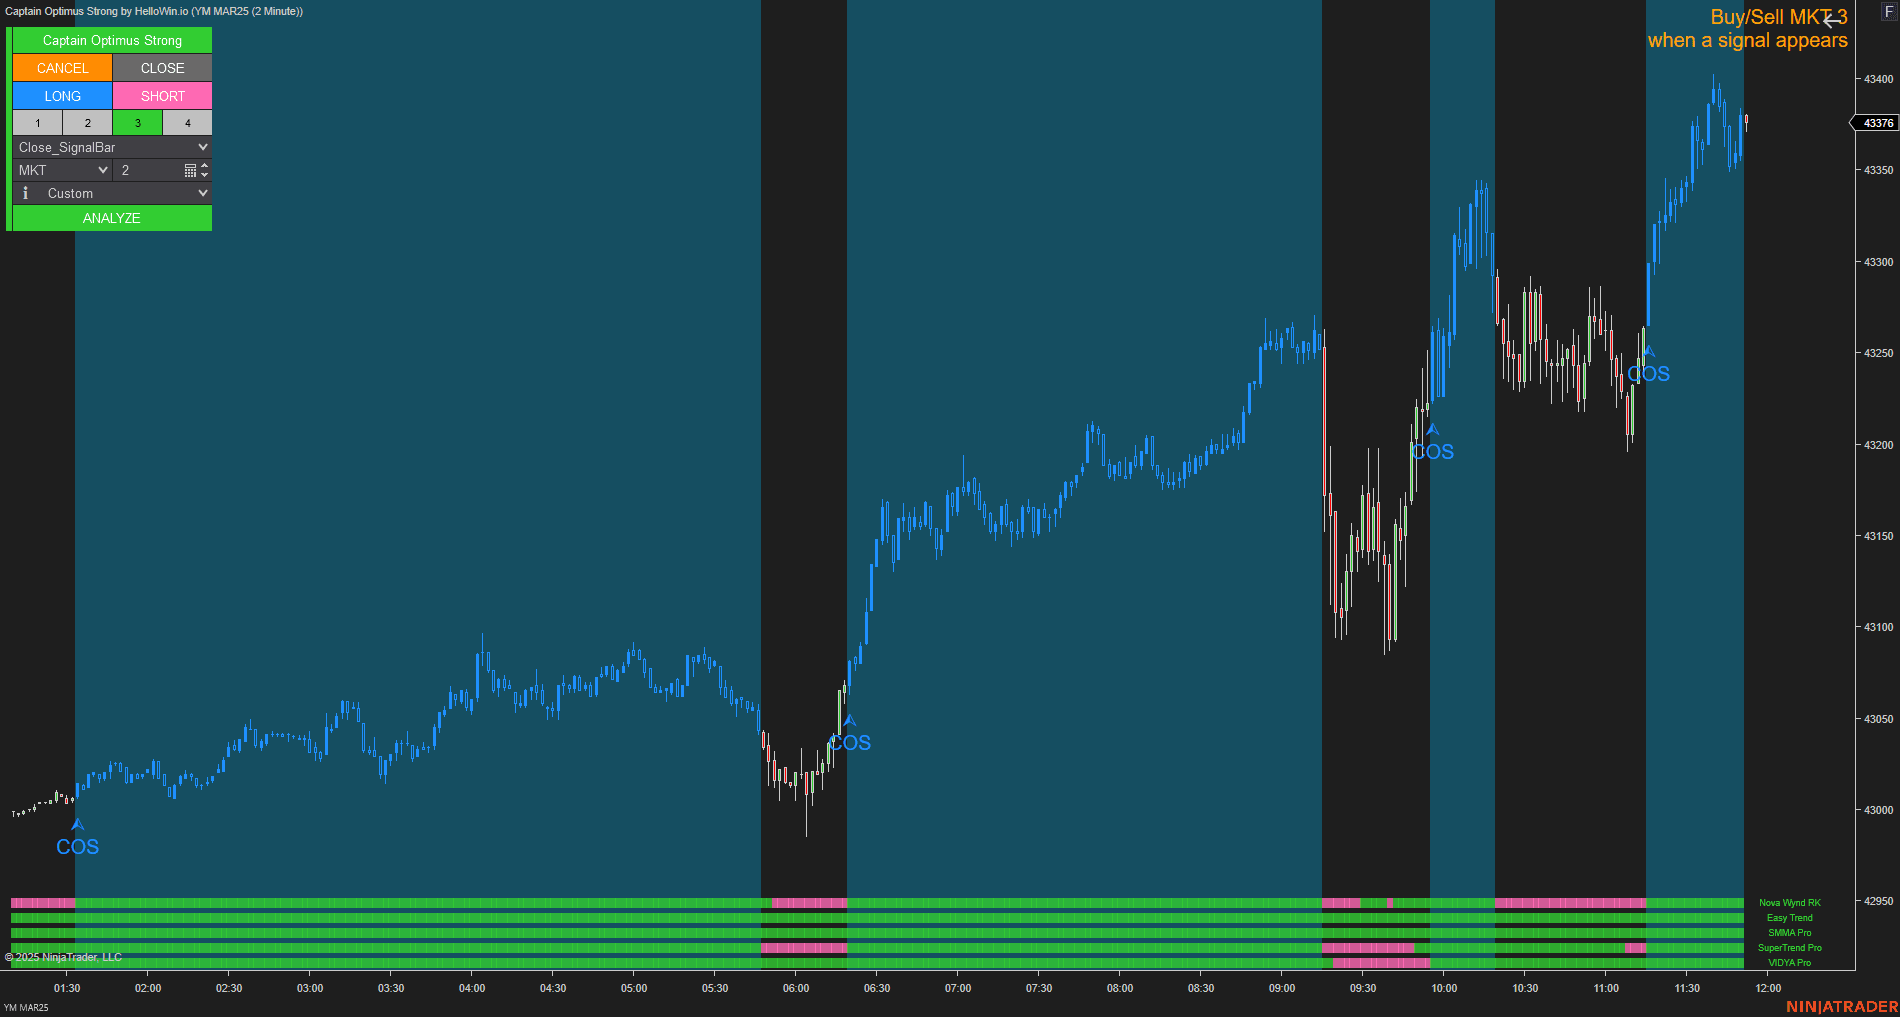
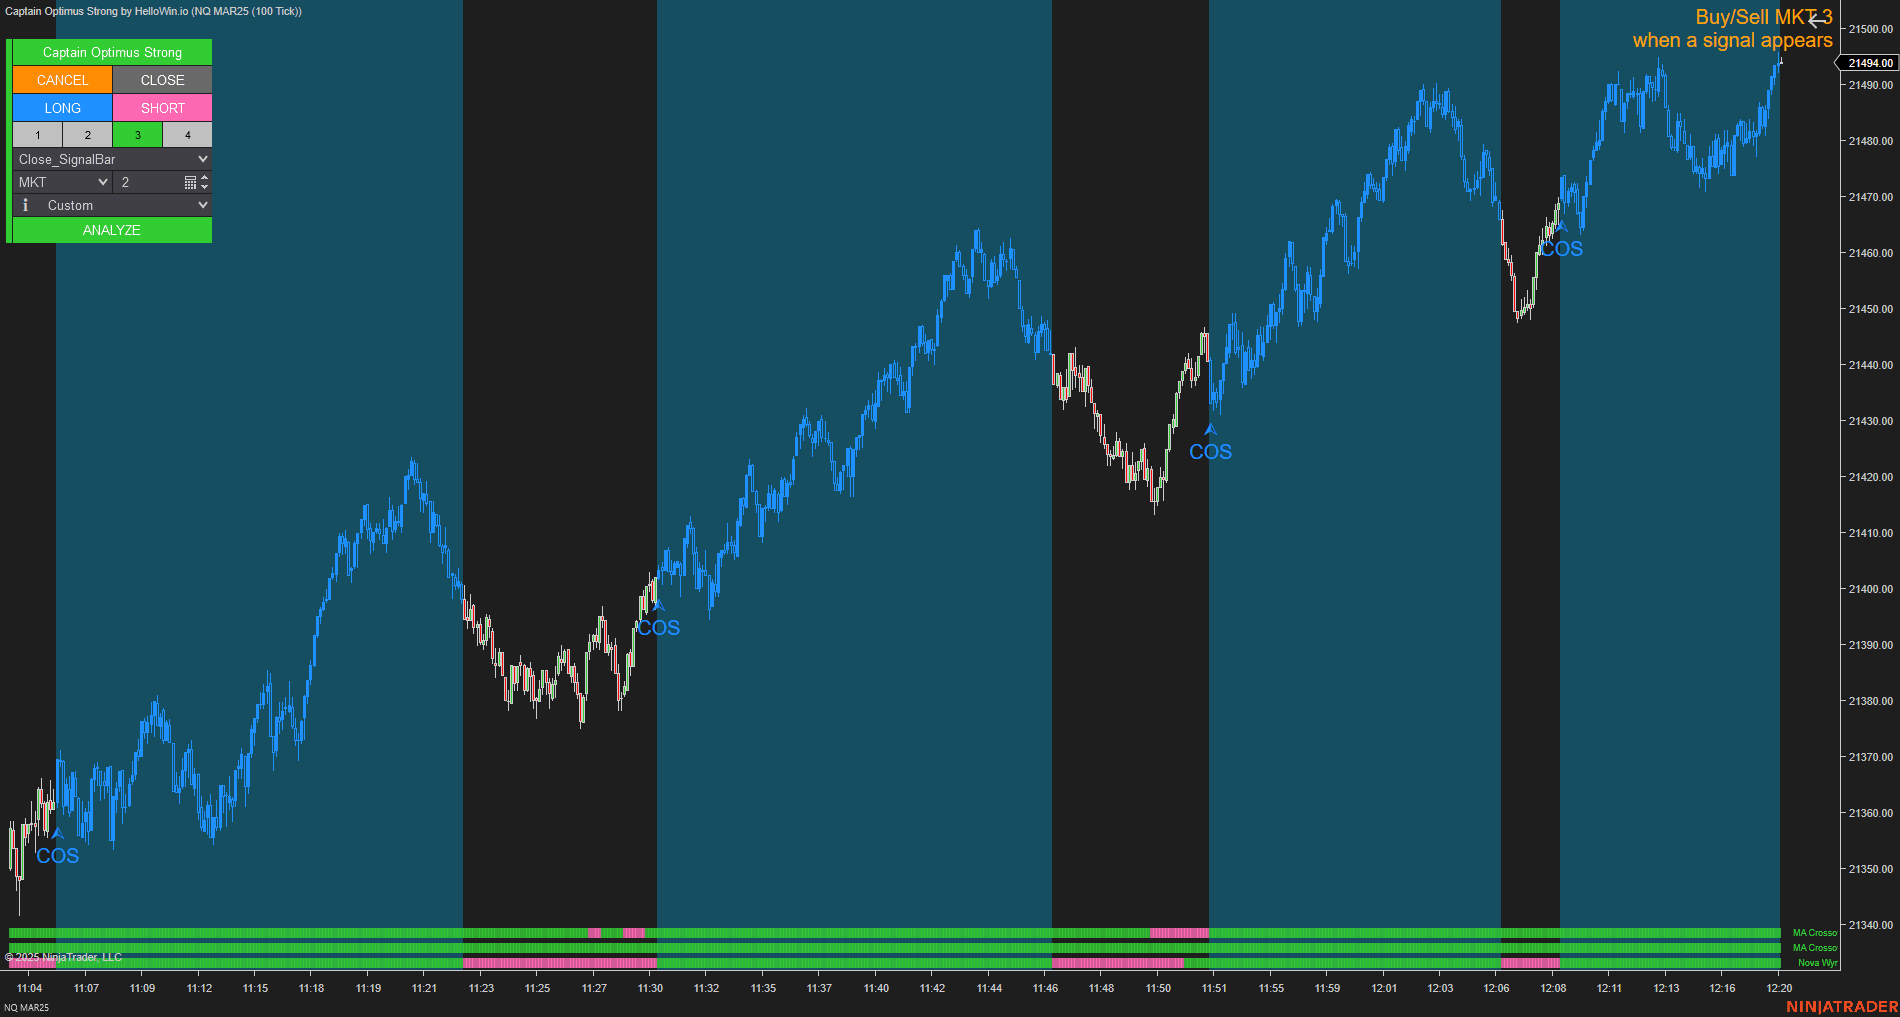
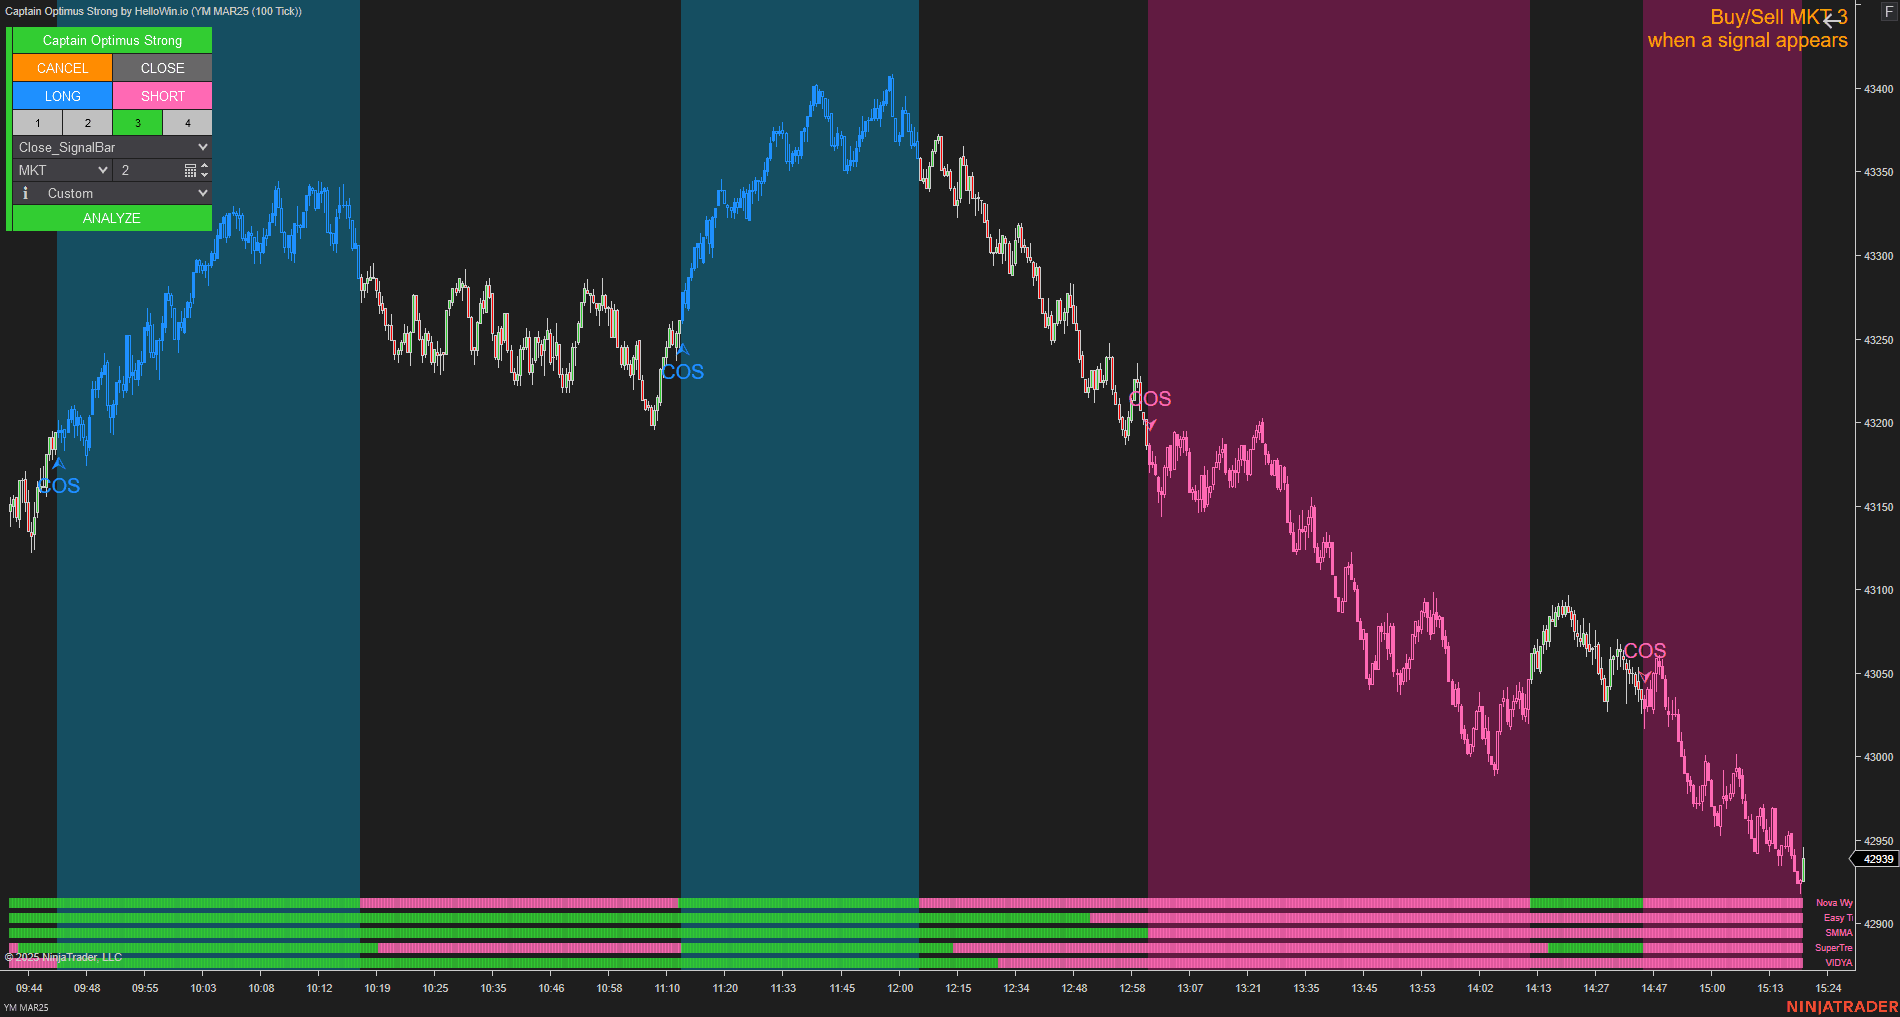
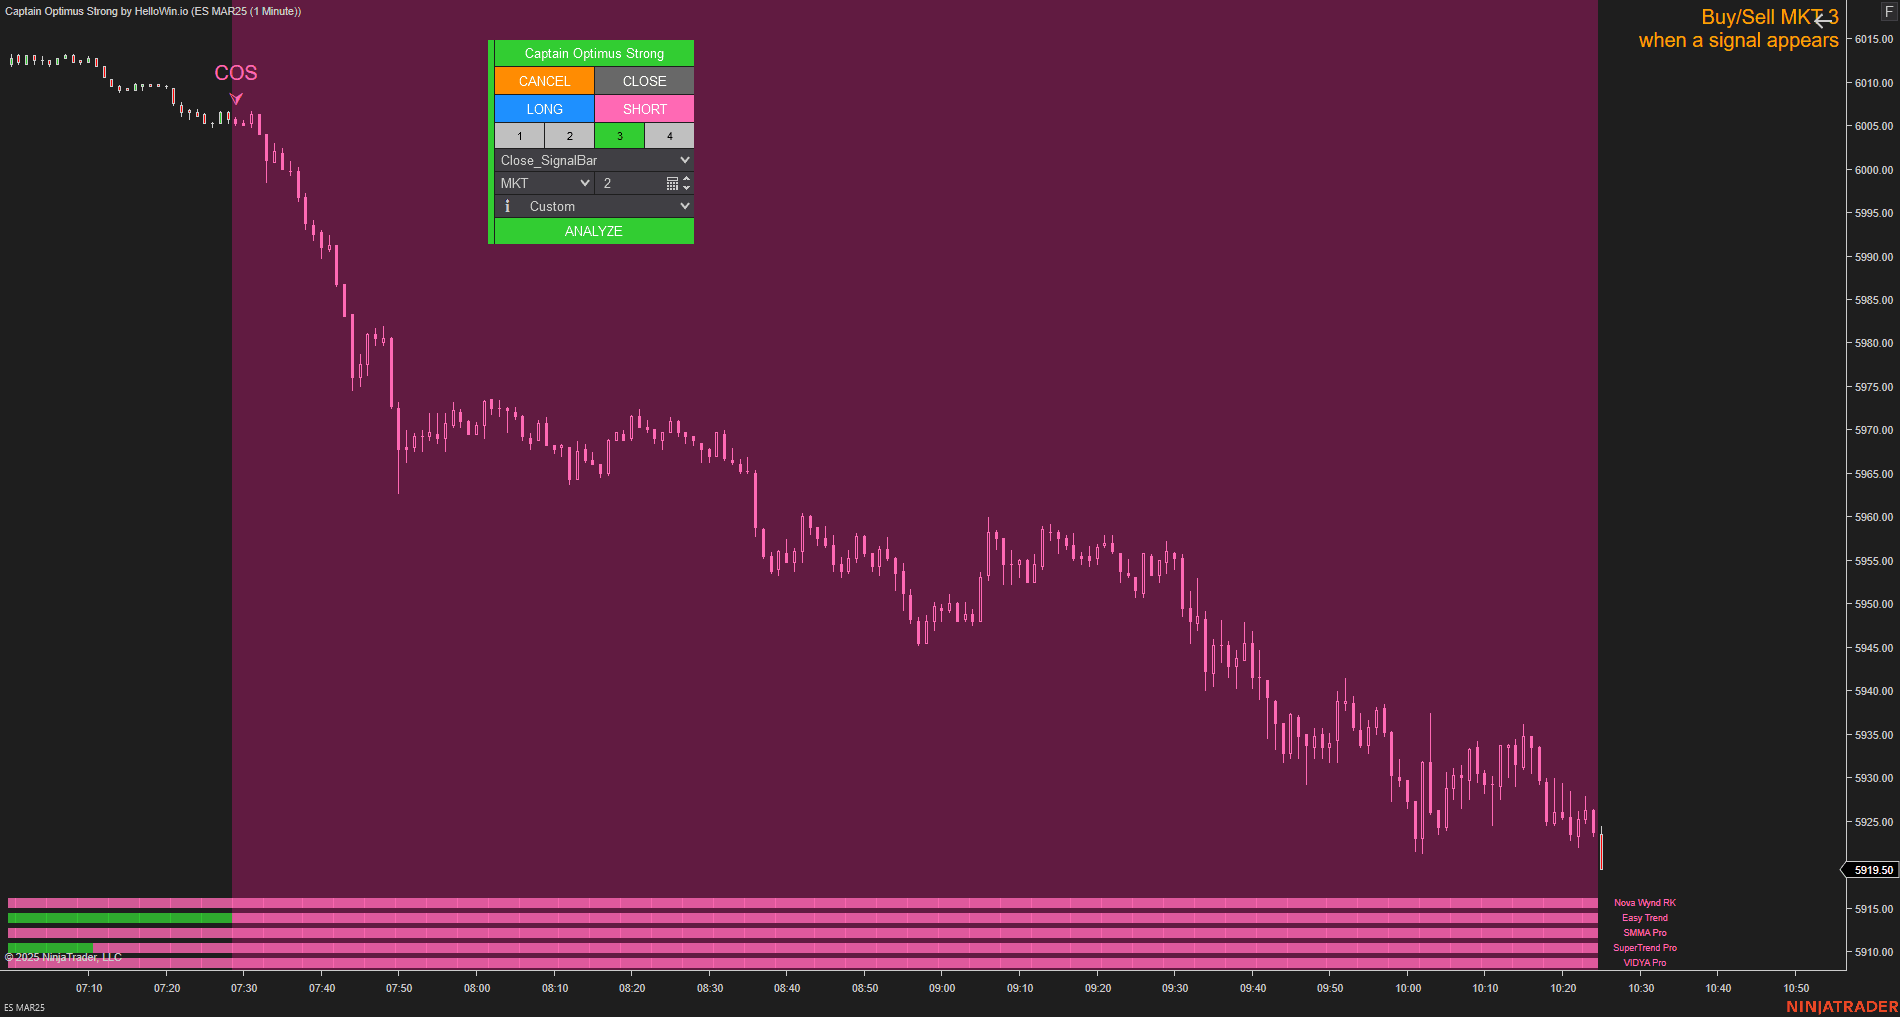
Captain Optimus Strong v2 connects the analytical conditions to a structured execution process. It can combine signals from StepMA Crossover and Multi-Osc OB/OS Overlap, execute through ATM strategies, apply trading-hour filters, set daily profit and loss limits, and support backtesting of the complete workflow.
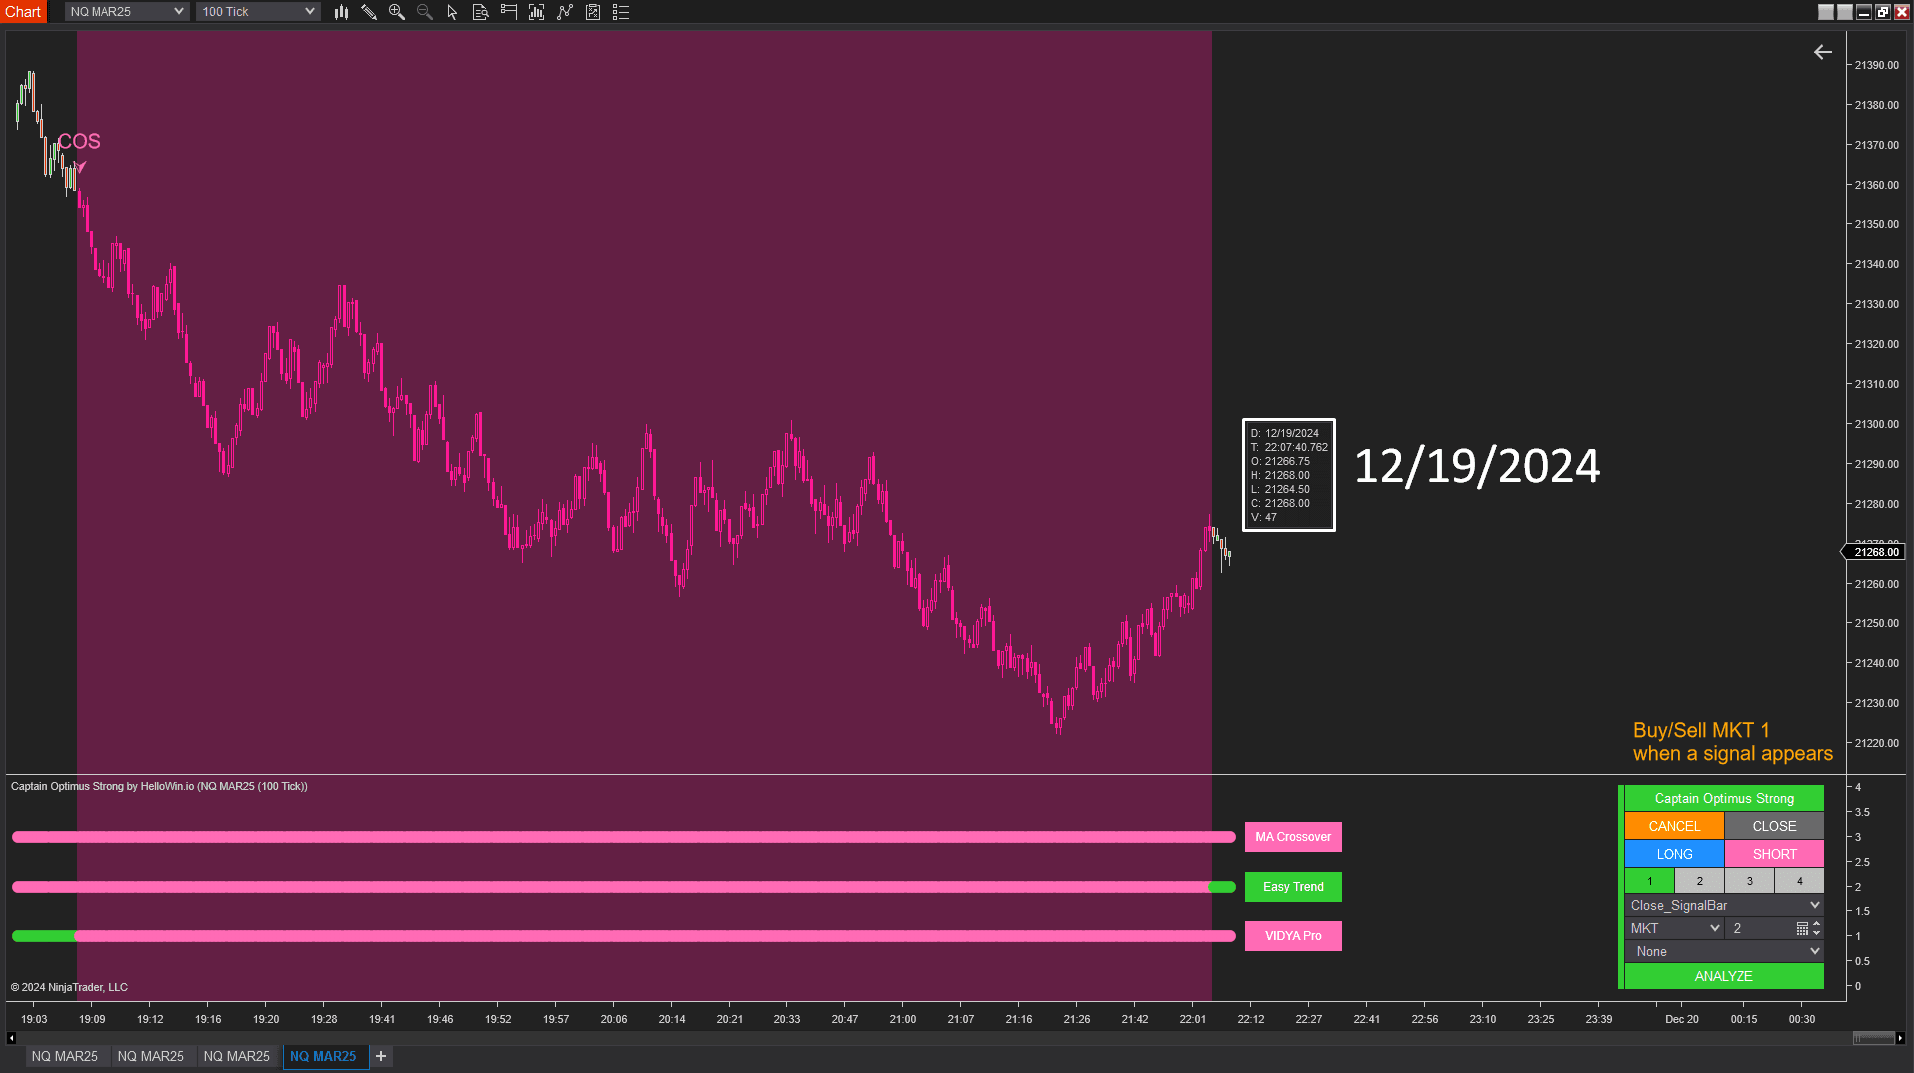
What traders can achieve
A process built to be reviewed and refined, not just followed
Maintain a clear directional bias
Identify the prevailing trend and concentrate on pullbacks that remain aligned with it, rather than reacting to every change in price.
Evaluate setups in context
Assess market structure, trend, and momentum as connected conditions instead of relying on a single indicator signal.
Avoid chasing extended moves
Use oscillator alignment to recognize when price may already be extended and when a pullback deserves closer evaluation.
Execute with defined rules
Replace session-by-session improvisation with predetermined entry, timing, trade management, and daily risk parameters.
Build a testable trading process
Apply the same decision logic across live analysis, backtesting, and automated execution — making the workflow easier to review and refine over time.
Clear enough to follow. Structured enough to develop.
Each component has one defined responsibility
KingRenko$ establishes the price structure.
StepMA Crossover defines directional context.
Multi-Osc OB/OS Overlap evaluates momentum conditions.
Captain Optimus Strong v2 applies the execution and risk rules.
This makes the workflow accessible to developing traders without removing the structure required for serious testing and system refinement.
The framework does not remove uncertainty from trading. It provides a more disciplined way to make decisions within it.
See the framework in live market conditions
The decision process, not a promise of outcome
These live trading sessions show how the workflow behaves as volatility, momentum, and market structure change in real time. They demonstrate the decision process — not that every session or setup will produce the same result.
High-volatility U.S. market open — 1 contract
See how Antonino applied the StepMA-based workflow during a volatile U.S. opening session.
3 real-account trading reviews
Follow 3 sessions shared by Antonino, with a focus on how setups were evaluated, accepted, managed, or avoided.
Reviewing StepMA Crossover During the U.S. Market Open
See how Mr. Antonino reviewed and executed his scalping strategy on January 16, 2026, using the StepMA Crossover.
He normally avoids trading the market open due to excessive noise and lack of structure. However, this session deliberately focused on the U.S. opening to stress-test the system under high volatility.
The goal was straightforward: evaluate whether the strategy could maintain structure and reach a $1,000 profit target despite challenging market conditions.
Studying Market Conditions Beyond the “Kill Zone”
Market conditions can change significantly just 10 minutes after the open. There’s no fixed rule for ideal trading hours, despite what many call “Kill Zones.”
Antonino continues to study these sessions through constant backtesting, knowing that in the markets, no two days are ever the same.
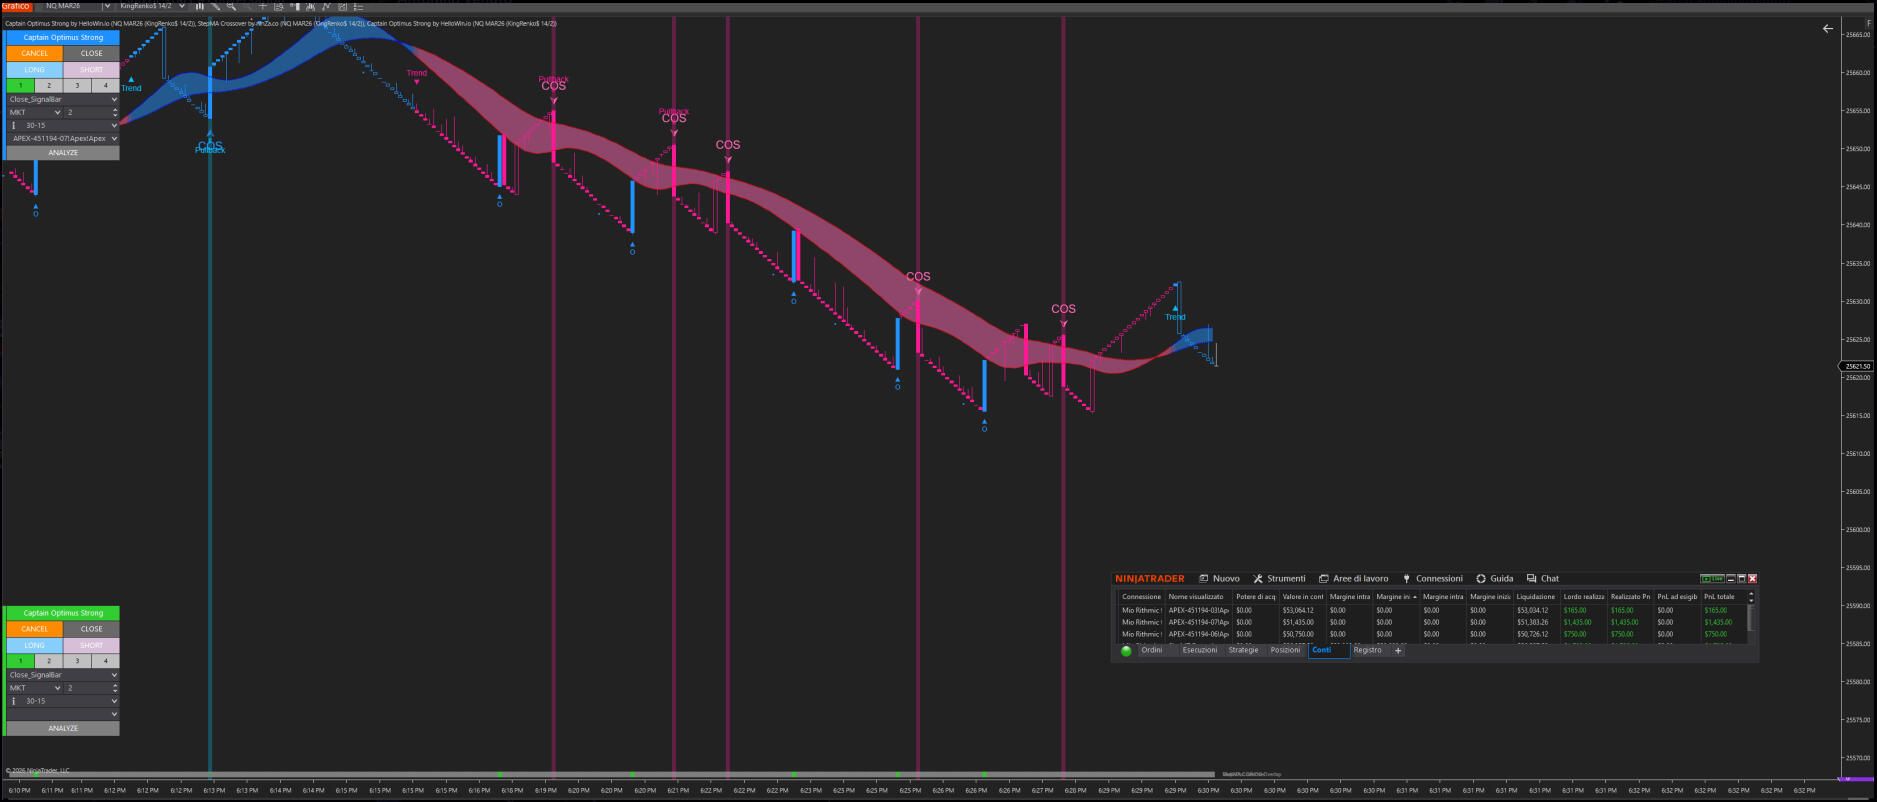
Trend Flow Suite During the U.S. Market Open
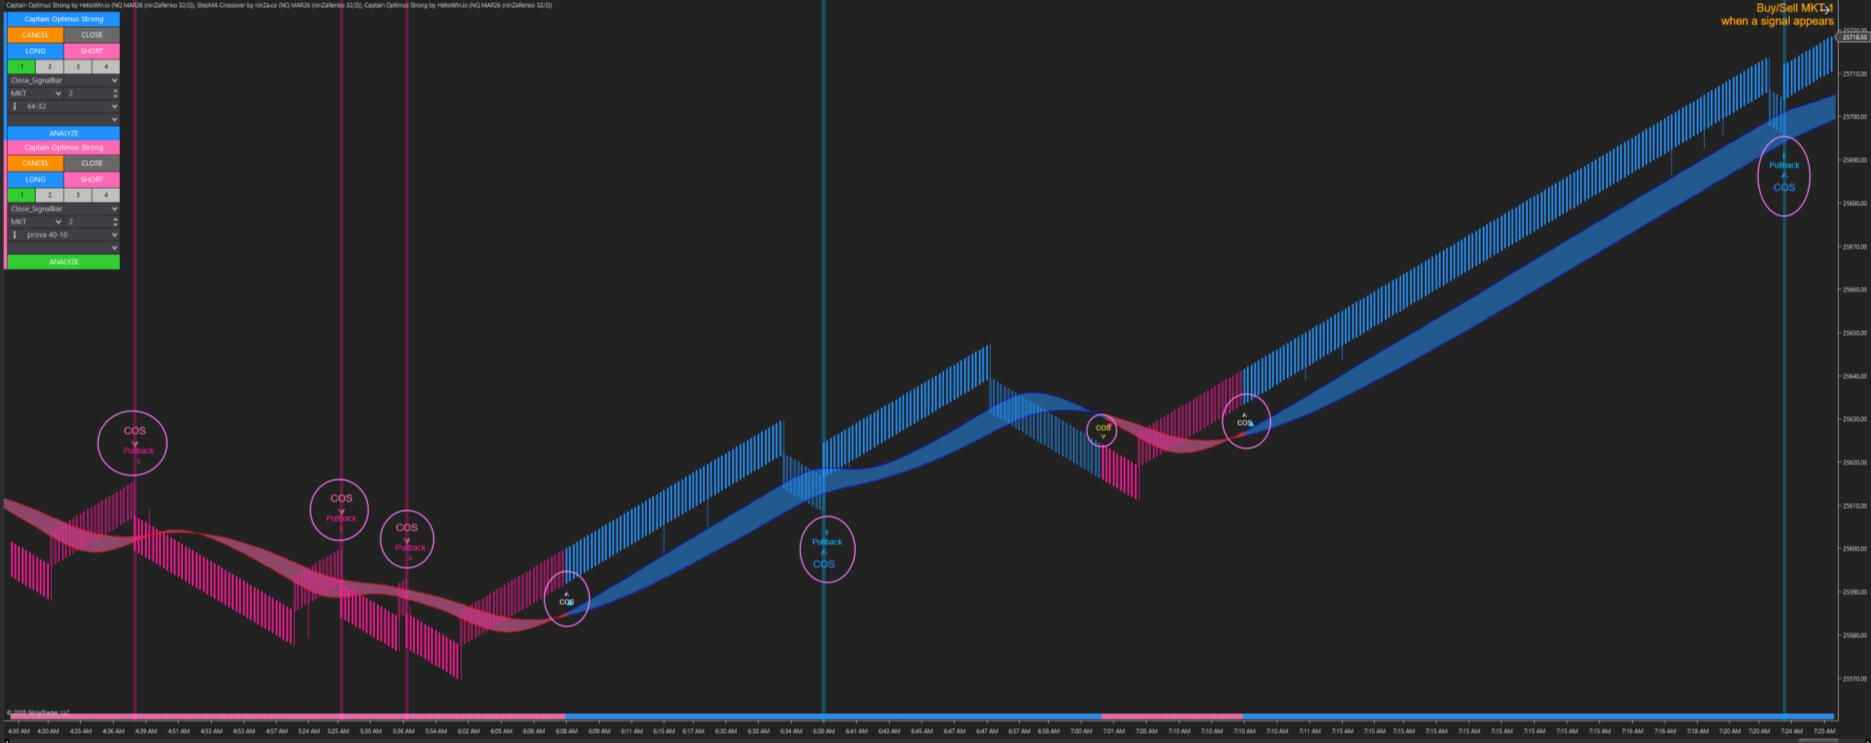
Let’s see Trend Flow Suite – in action during the last U.S. market open, catching a high-volatility move with a single contract.
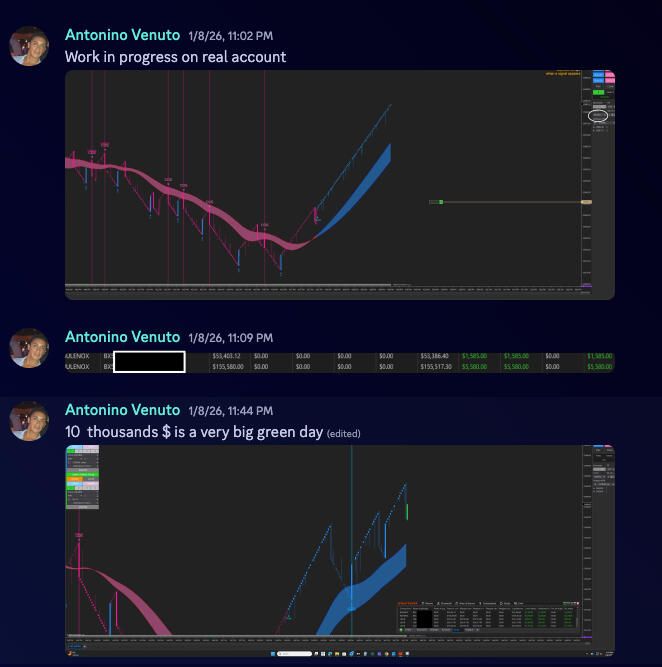
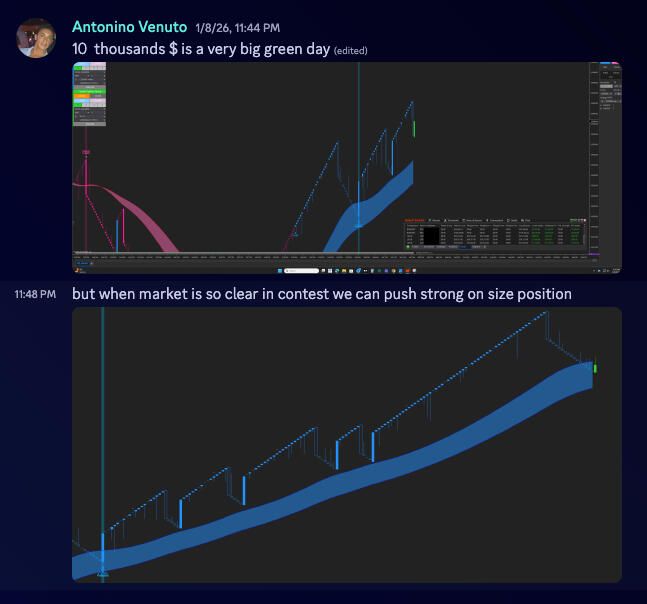
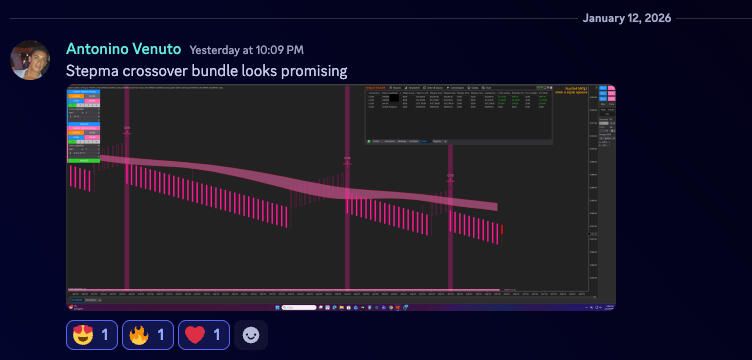
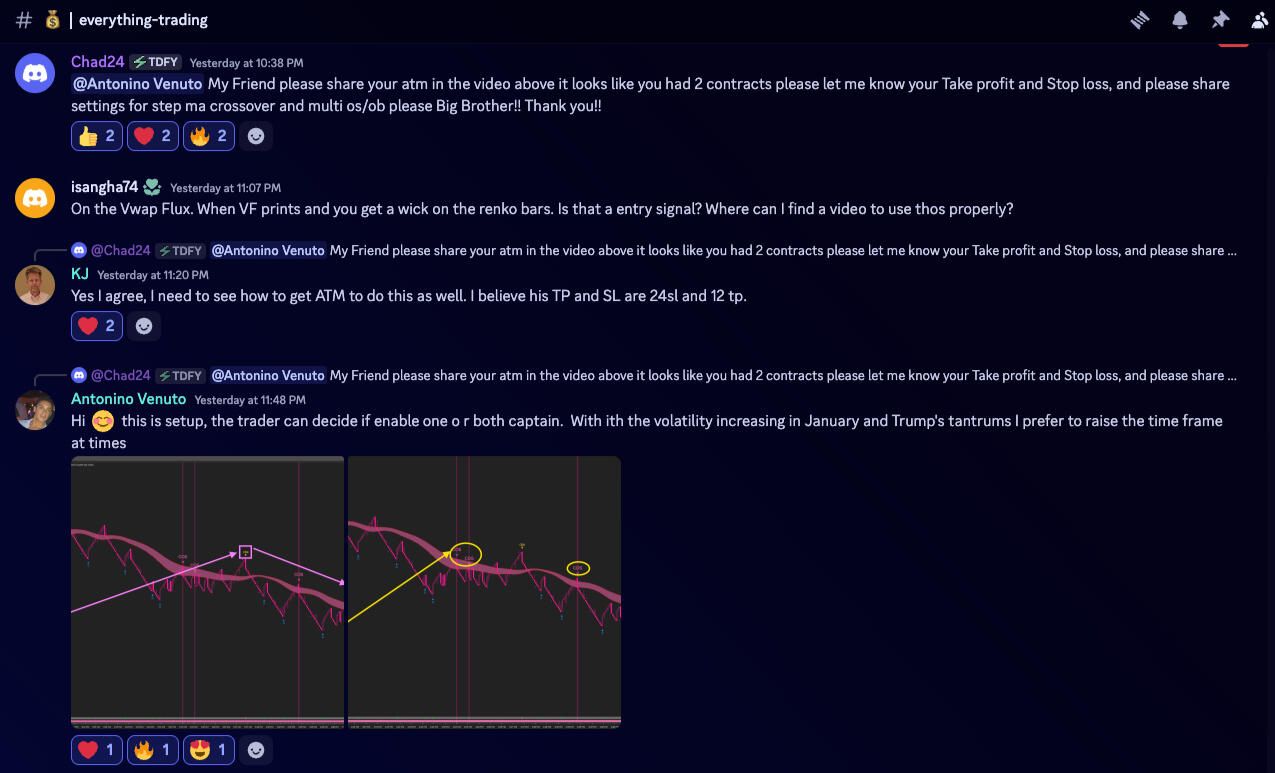
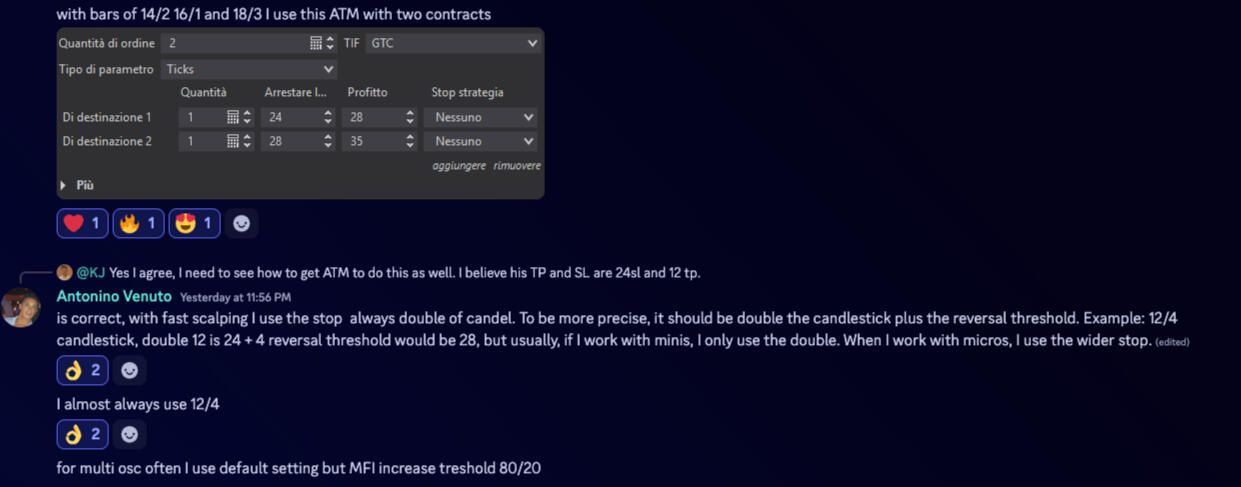
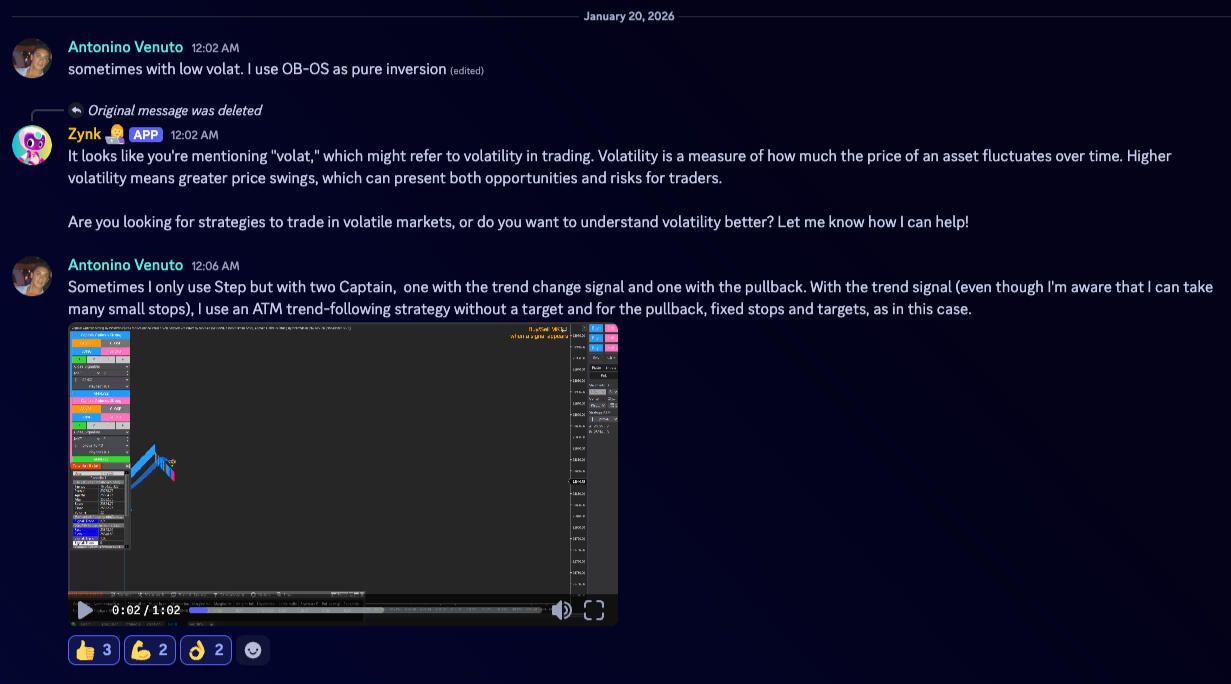
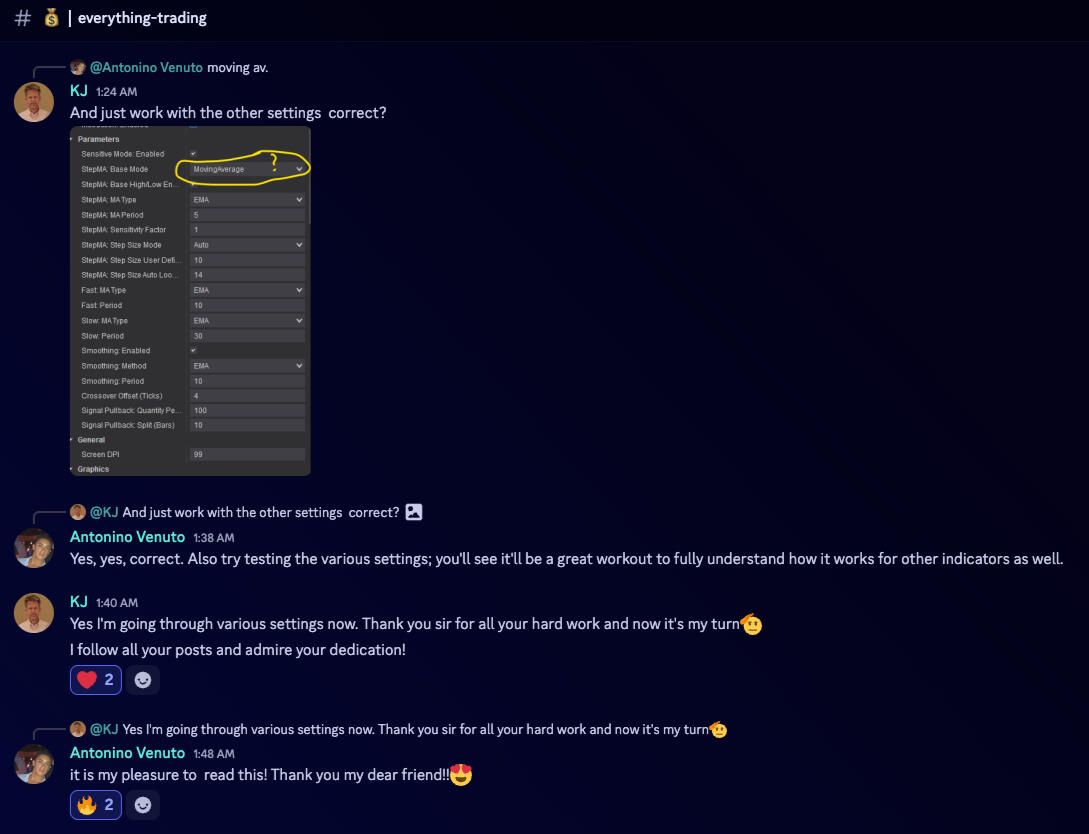
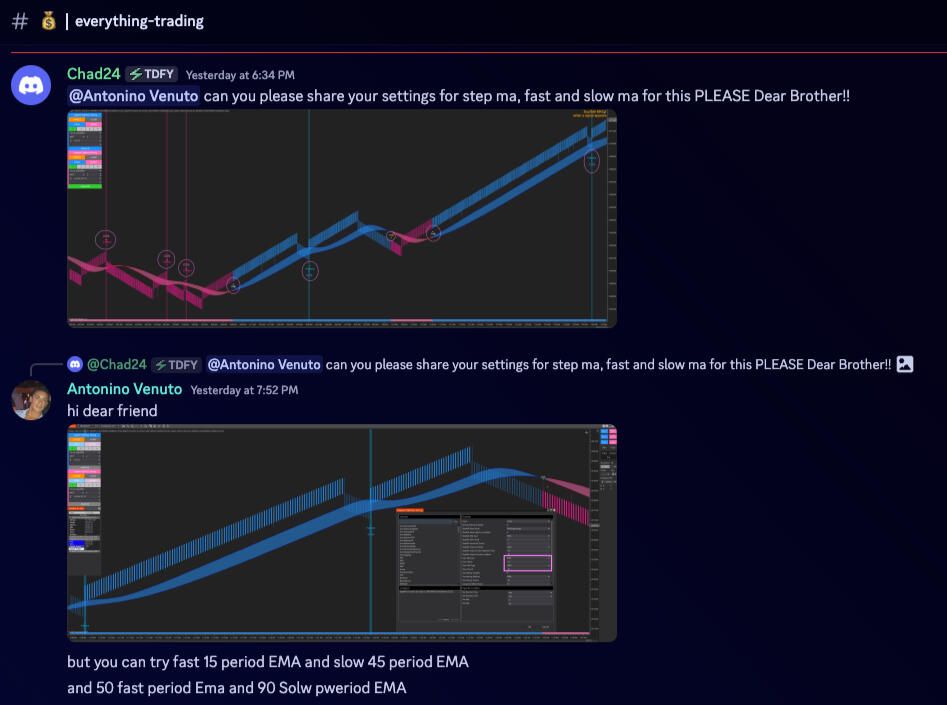
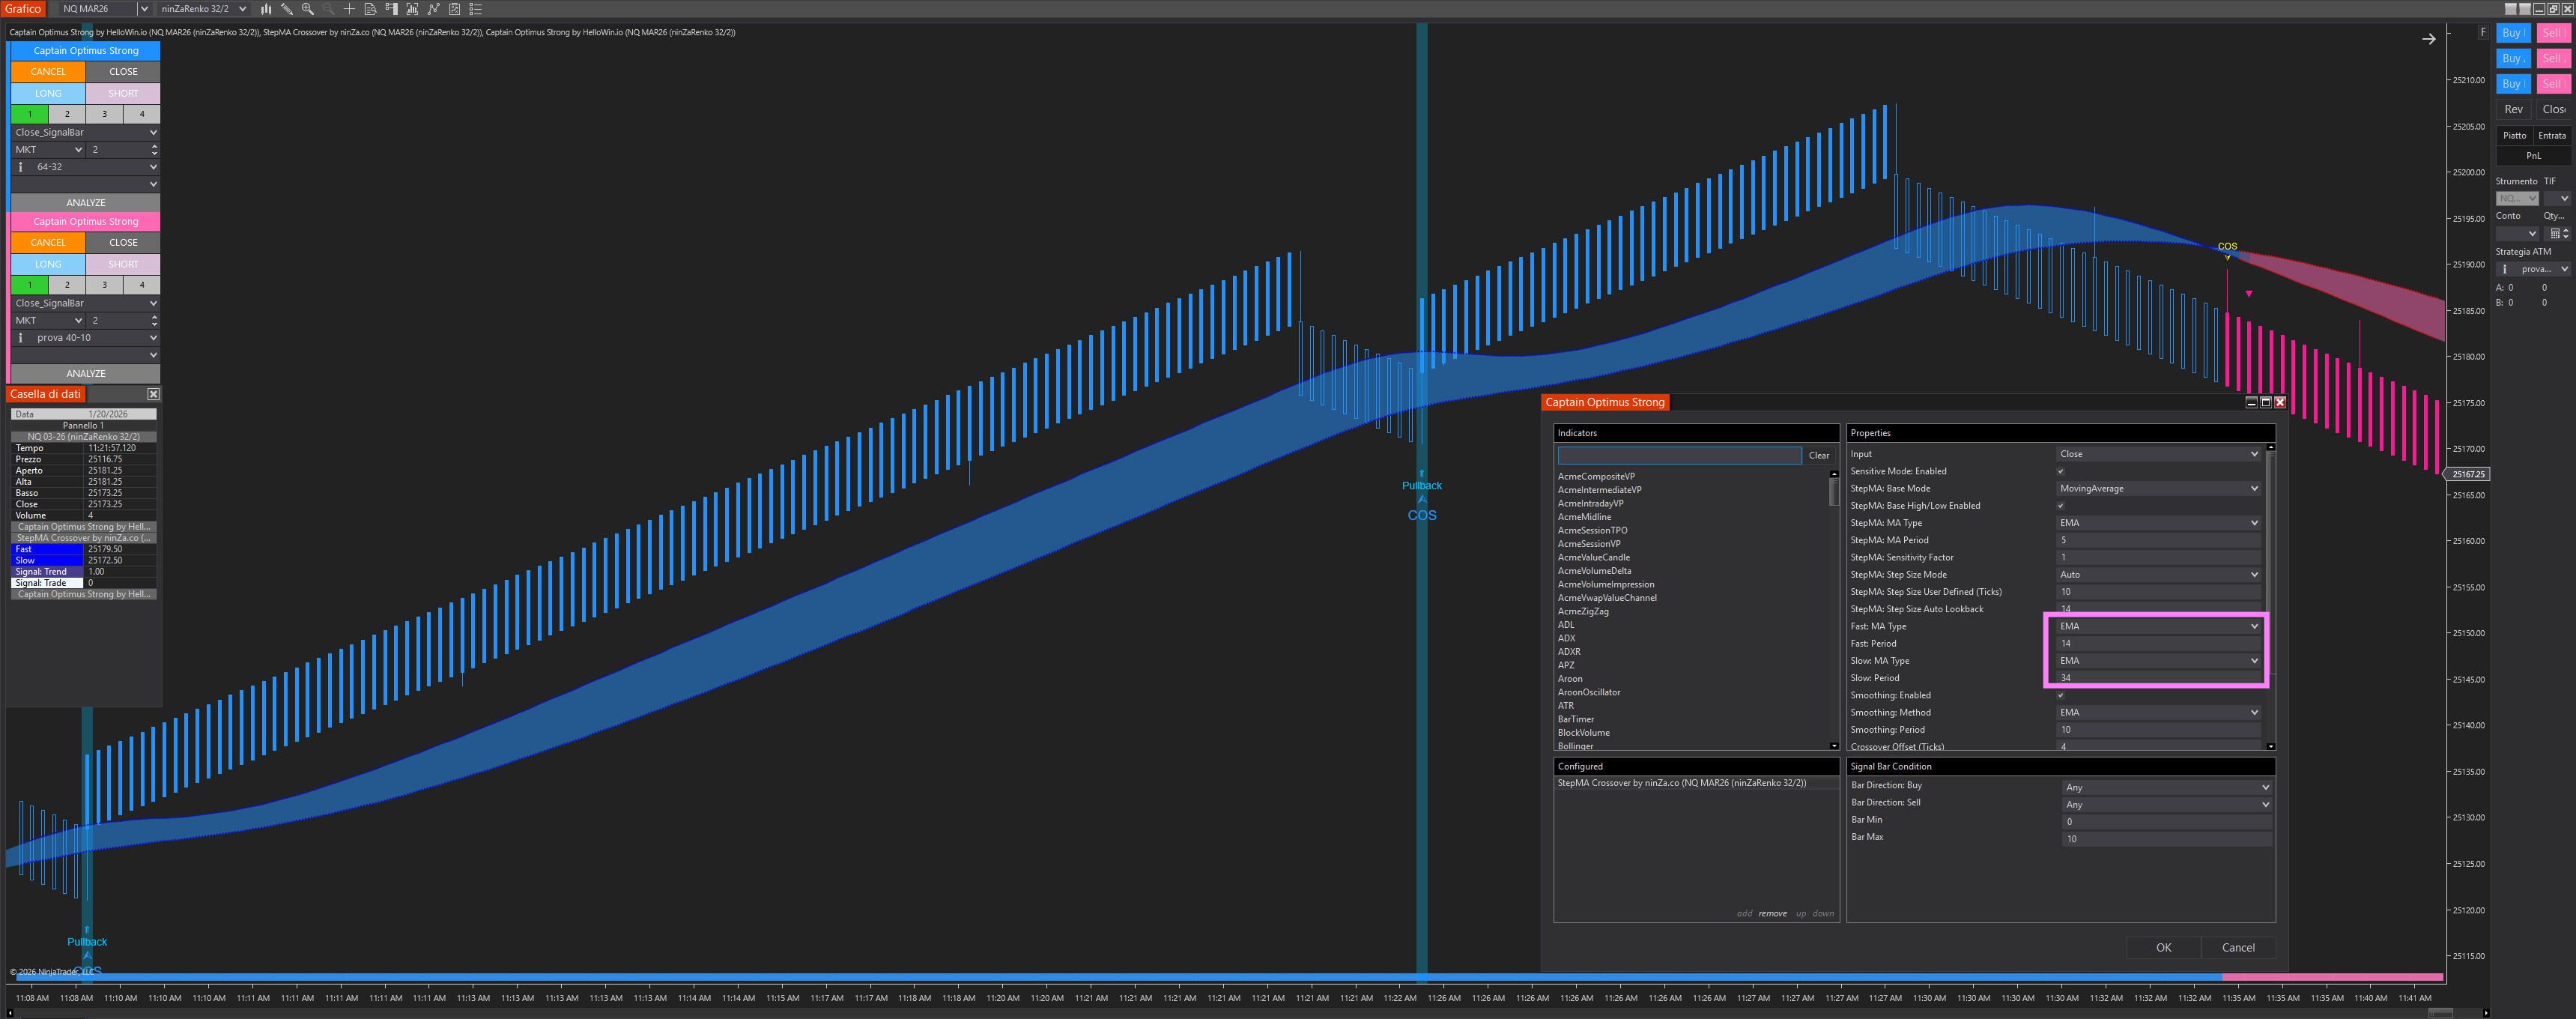
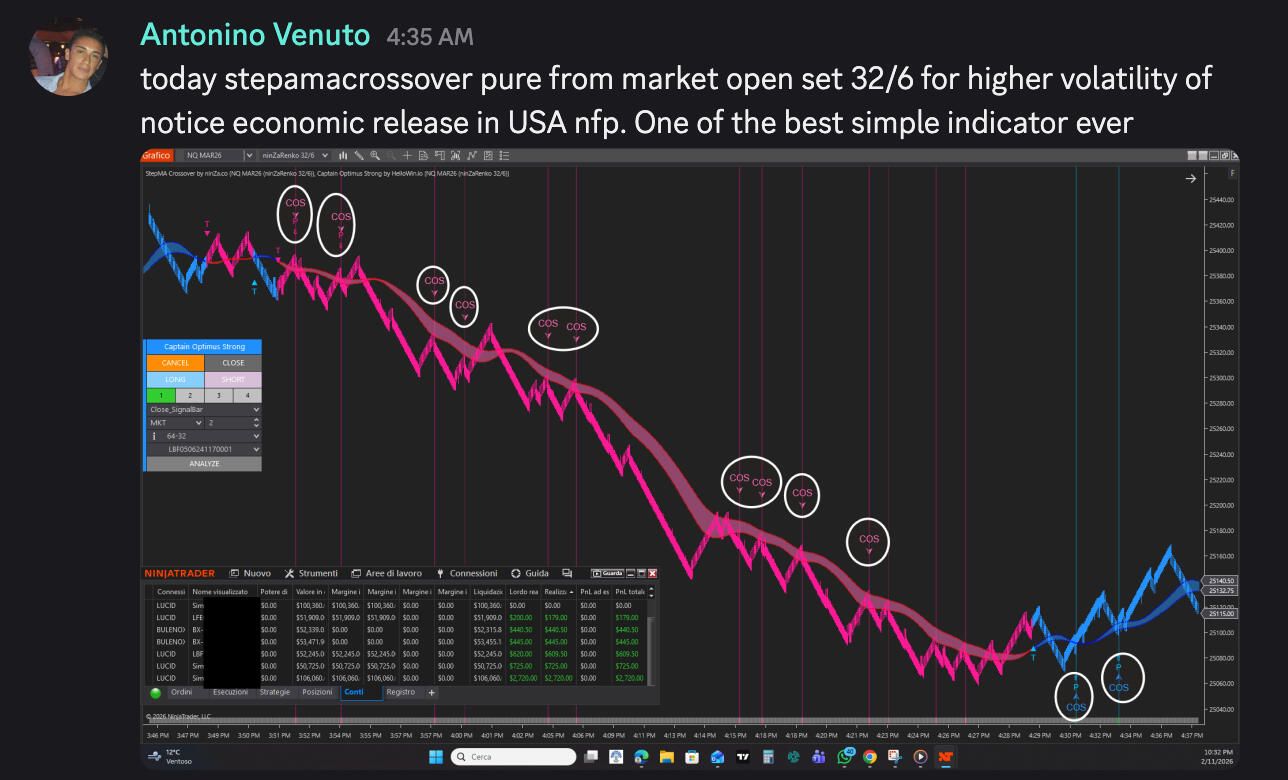
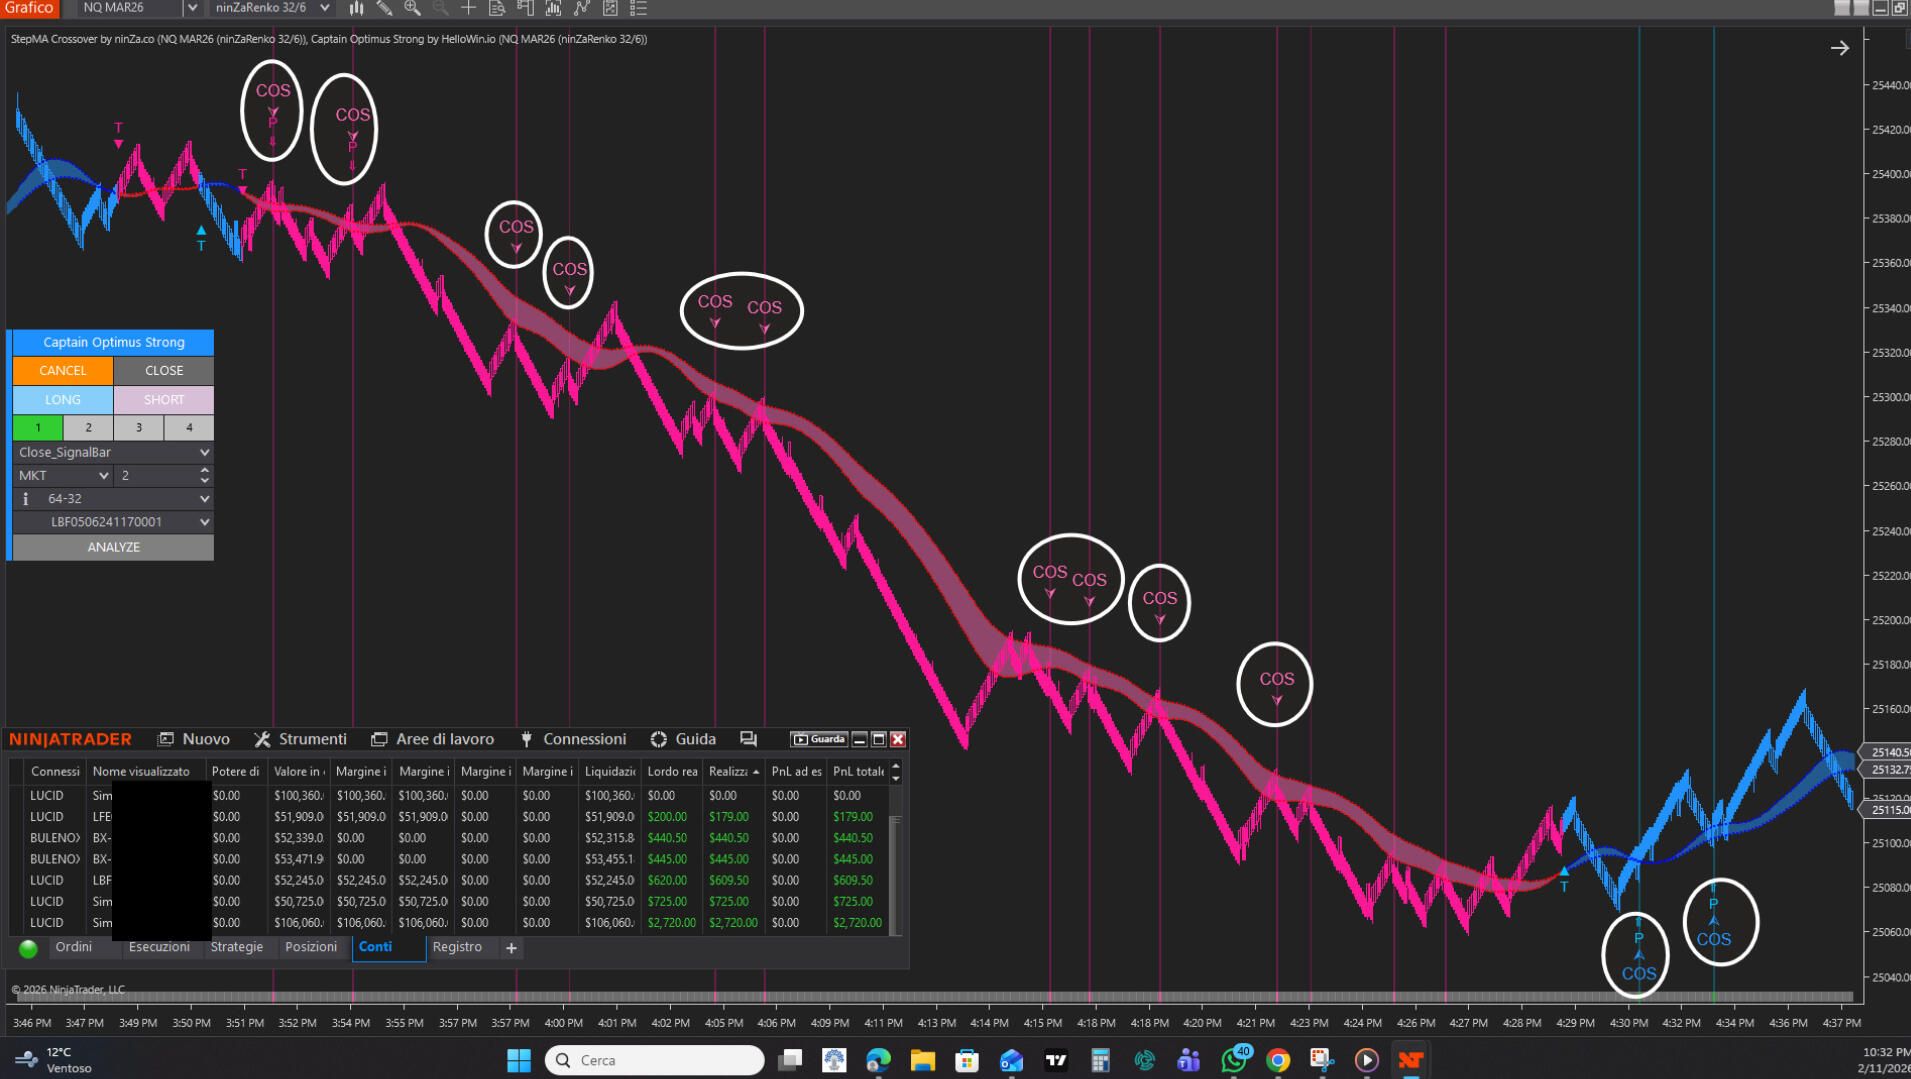
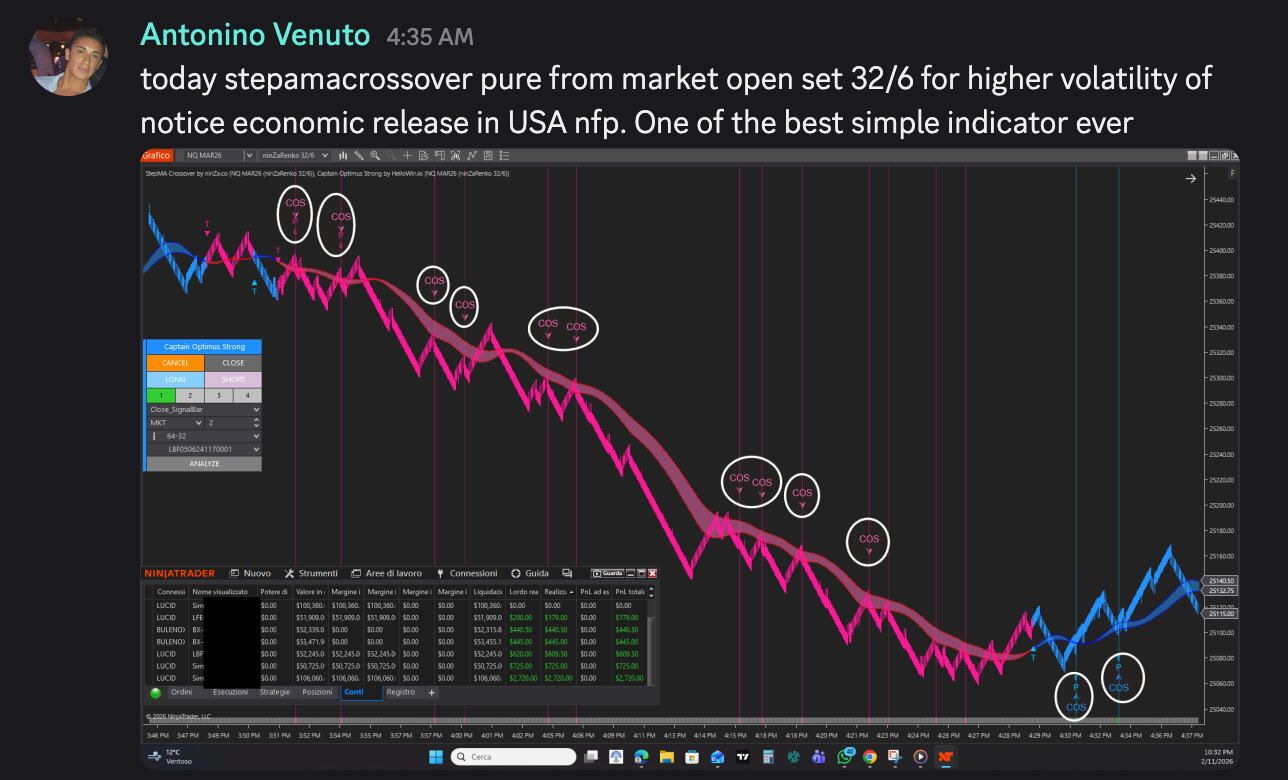
Here’s what our customers are saying about this suite:
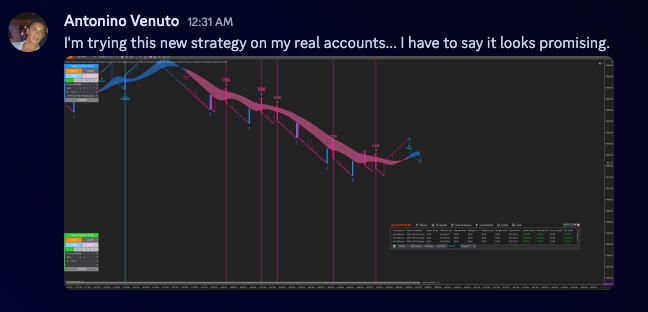
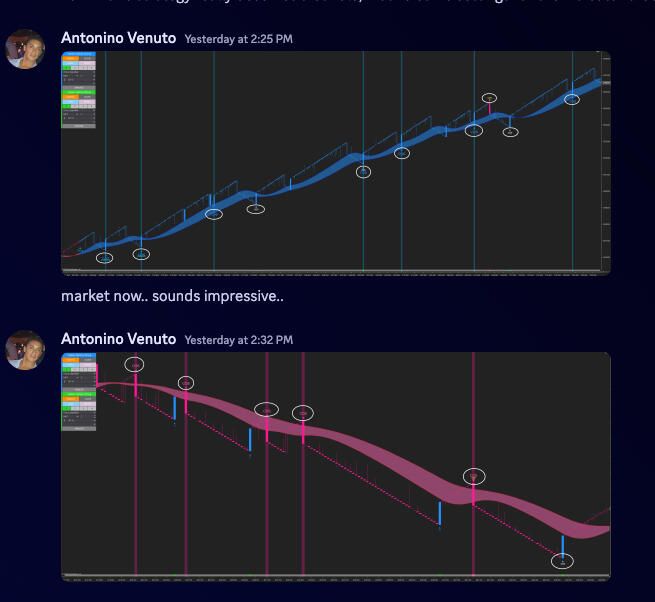
Choose the framework that fits your process
Same methodology. The difference is execution.
Both configurations use the same market-structure, trend, and momentum methodology. The Analytical suite supports manual decision-making. The Complete System Suite adds automation, backtesting, ATM integration, and daily risk controls through Captain Optimus Strong v2.
Analytical Suite
For traders who want to apply the framework manually while retaining direct control over trade execution.
- StepMA Crossover license ($400 value)
- Multi-Osc OB/OS Overlap license ($500 value)
- KingRenko$ license ($400 value)
- Personalized support
- Comprehensive trader's manual
Complete System Suite
For traders who want to connect the analytical framework to rule-based execution, strategy testing, ATM integration, and daily risk controls.
- Captain Optimus Strong v2 license ($1600 value)
- StepMA Crossover license ($400 value)
- Multi-Osc OB/OS Overlap license ($500 value)
- KingRenko$ license ($400 value)
- Personalized support
- Comprehensive trader's manual
Evaluate the framework in your own trading environment
Use the indicators with your preferred markets and trading process for 30 days. If the framework does not provide the improvement in clarity or workflow you expected, you may exchange it for another NINZA indicator under the applicable exchange terms. This evaluation period is intended to help you determine whether the framework fits your process — not to promise a particular trading outcome.
Frequently asked
Questions traders ask before adopting the framework
What is the difference between the Analytical and the Complete System Suite?
Do I need to trade the KingRenko$ 12/4 chart specifically?
Can Captain Optimus Strong v2 be backtested before going live?
How does the 30-day exchange work?
Can I start with individual components instead of a Suite?
Download ~ 40 FREE indicators & reach more useful resources !!!
LIVE Intraday Trading | Stop chasing Early Entries. Let Timing guide your entry →

ninZa.co Indicators
0 online
_1787026707358.svg)
NINZA is an official member of NinjaTrader Ecosystem together with 600+ industry-leading professionals that provide traders with quality trading products & services.




even more payment methods
Quick Links
Instructions
Support
Resources & Information
© Copyright 2026 All Rights Reserved



Because software products may be copied and stored easily, we will NOT issue refunds of any kind. ALL SALES ARE FINAL & NON-REFUNDABLE!
Futures, foreign currency, and options trading contains substantial risk and is not for every investor. An investor could potentially lose all or more than the initial investment. Risk capital is money that can be lost without jeopardizing one's financial security or lifestyle. Only risk capital should be used for trading and only those with sufficient risk capital should consider trading. Past performance is not necessarily indicative of future results.
Hypothetical performance results have many inherent limitations, some of which are described below. No representation is being made that any account will or is likely to achieve profits or losses similar to those shown; in fact, there are frequently sharp differences between hypothetical performance results and the actual results subsequently achieved by any particular trading program. One of the limitations of hypothetical performance results is that they are generally prepared with the benefit of hindsight. In addition, hypothetical trading does not involve financial risk, and no hypothetical trading record can completely account for the impact of financial risk of actual trading. For example, the ability to withstand losses or to adhere to a particular trading program in spite of trading losses are material points which can also adversely affect actual trading results. There are numerous other factors related to the markets in general or to the implementation of any specific trading program which cannot be fully accounted for in the preparation of hypothetical performance results and all which can adversely affect trading results.
NinjaTrader® is a registered trademark of NinjaTrader Group, LLC. No NinjaTrader company has any affiliation with the owner, developer, or provider of the products or services described herein, or any interest, ownership or otherwise, in any such product or service, or endorses, recommends or approves any such product or service.