
Explore
Find indicators that fit the way you already trade.

Find the indicators that truly fit through real trading experience.
Get 30 days of full access to all 12 most-chosen indicators among pro traders, with the freedom to explore different combinations and approaches — then choose 6 to own for life.
BUILD AROUND FIT
The right indicators aren't always obvious until you actually trade with them.
UTF Suite #1: Most-chosen Trend × Zone × Signal gives you the flexibility to use, combine, and evaluate different indicators before deciding which ones deserve a place in your trading for life.
The suite lets you replace upfront certainty with real trading experience.
USE IT YOUR WAY
Whether you're exploring new ideas, improving an existing setup, or building something entirely new, the suite gives you room to test different approaches.
Find indicators that fit the way you already trade.

Improve existing setups with new indicator combinations.
Compare alternatives to improve the performance of your existing setup.

Experiment with combinations to develop a complete trading strategy.
Add new indicators to extend your approach across different market conditions.
How it works
Pay one flat price to start your UTF Suite, regardless of individual indicator value. No recurring charges or hidden fees.
Access every feature across all 12 indicators from day one – along with the supporting resources you need throughout your evaluation.
Use 30 days to run the indicators on real charts, explore different combinations and approaches at your own pace.
Make your final selection of 6 from the 12, with lifetime updates and technical support at no additional cost.
Trend × Zone × Signal
The following 12 indicators are carefully selected from our extensive library of 250+ pro-grade indicators, based on what traders look for most. Evenly split across 3 essential aspects of the market — Trend × Zone × Signal — they give you a well-rounded foundation for exploring and building trading setups.
Identify the market's prevailing direction to understand the broader market context.

Read the prevailing trend with 11 moving-average types and tune how sensitively you follow direction.
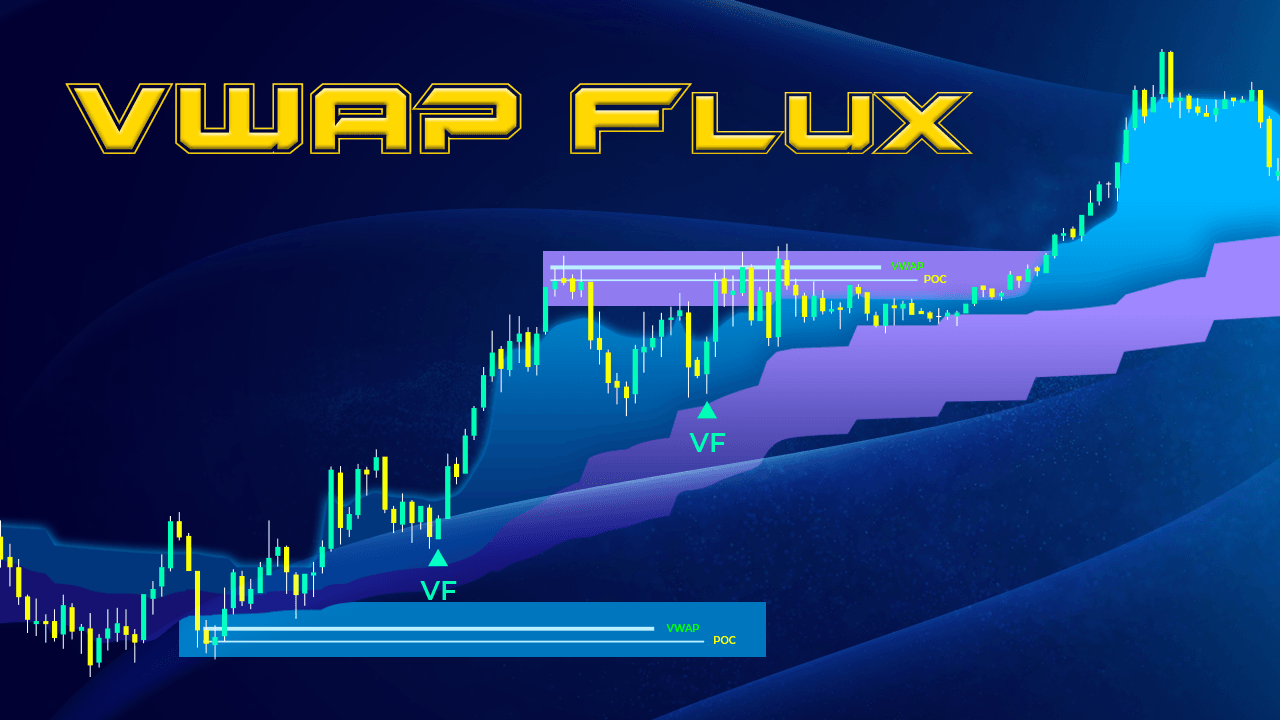
Compare price with segment-based VWAP for a more responsive view of changing market direction.
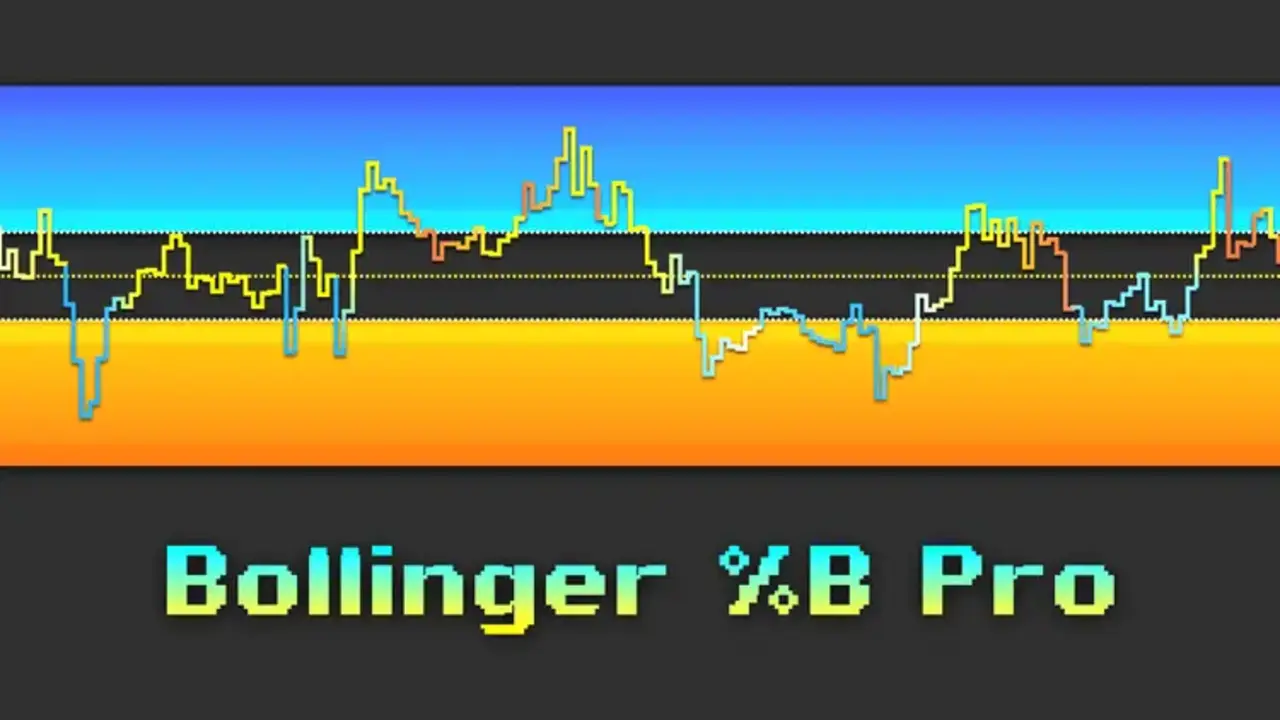
Measure price position inside Bollinger Bands to read direction, momentum, and trend strength more clearly.
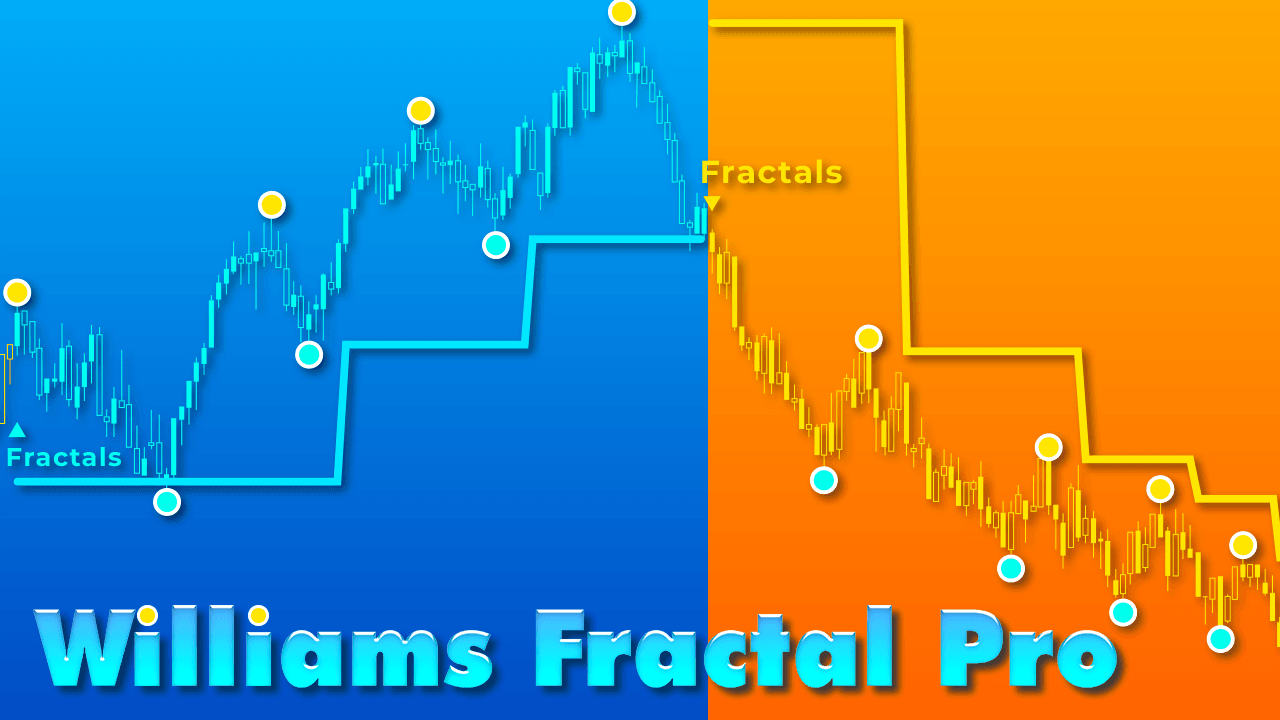
Follow evolving swing structure to spot higher highs, higher lows, and meaningful structural shifts.
Explore Trend indicators through practical trading examples and walkthroughs.
11 videos
Map key price areas and zones of interest to define where to look for potential trading opportunities.
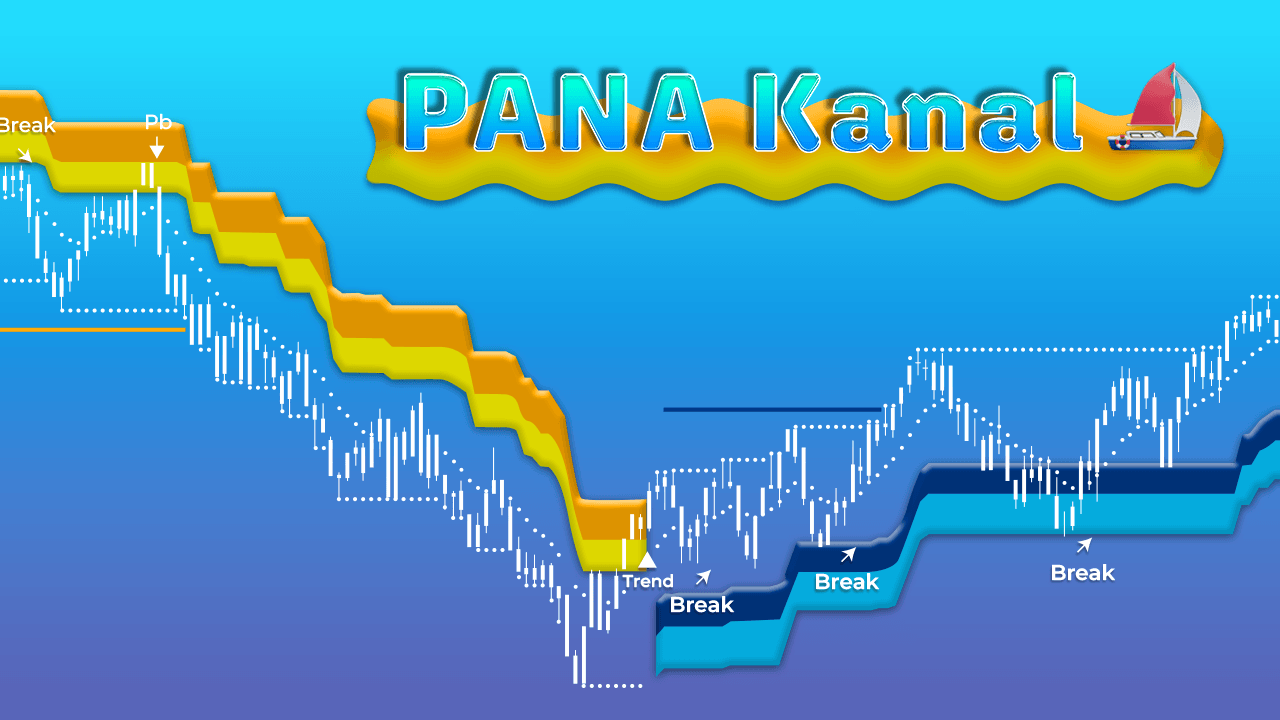
Highlight dynamic zones with a Fibonacci- and ATR-based framework for pullbacks, breaks, and context.
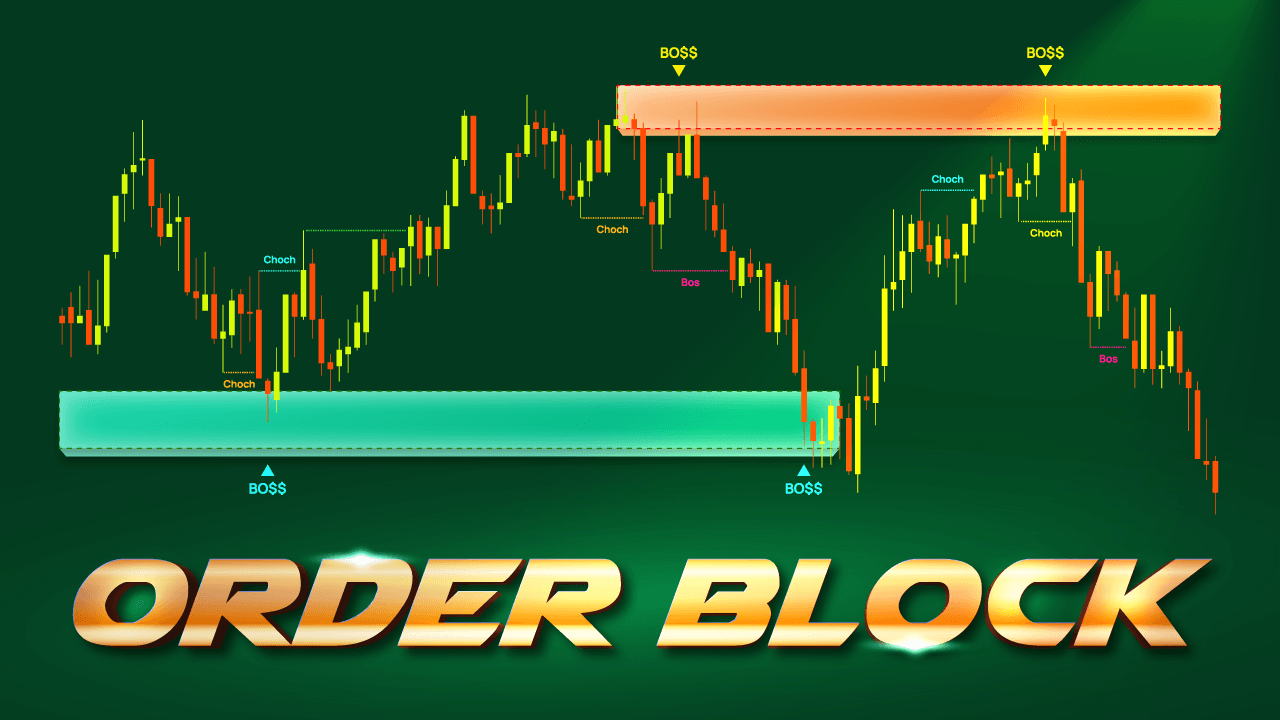
Detect supply and demand areas using order blocks, imbalance, BoS, and ChoCH structure.
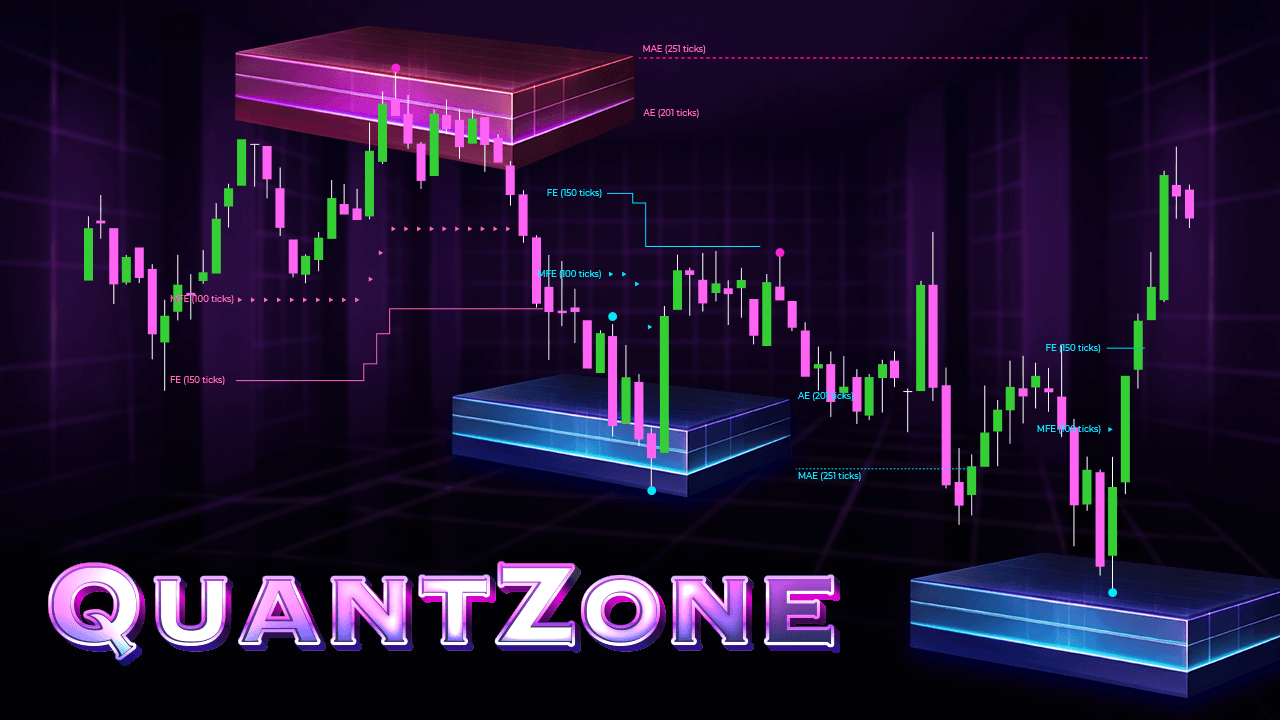
Find probability-based trading zones from historical price behavior and statistical analysis.
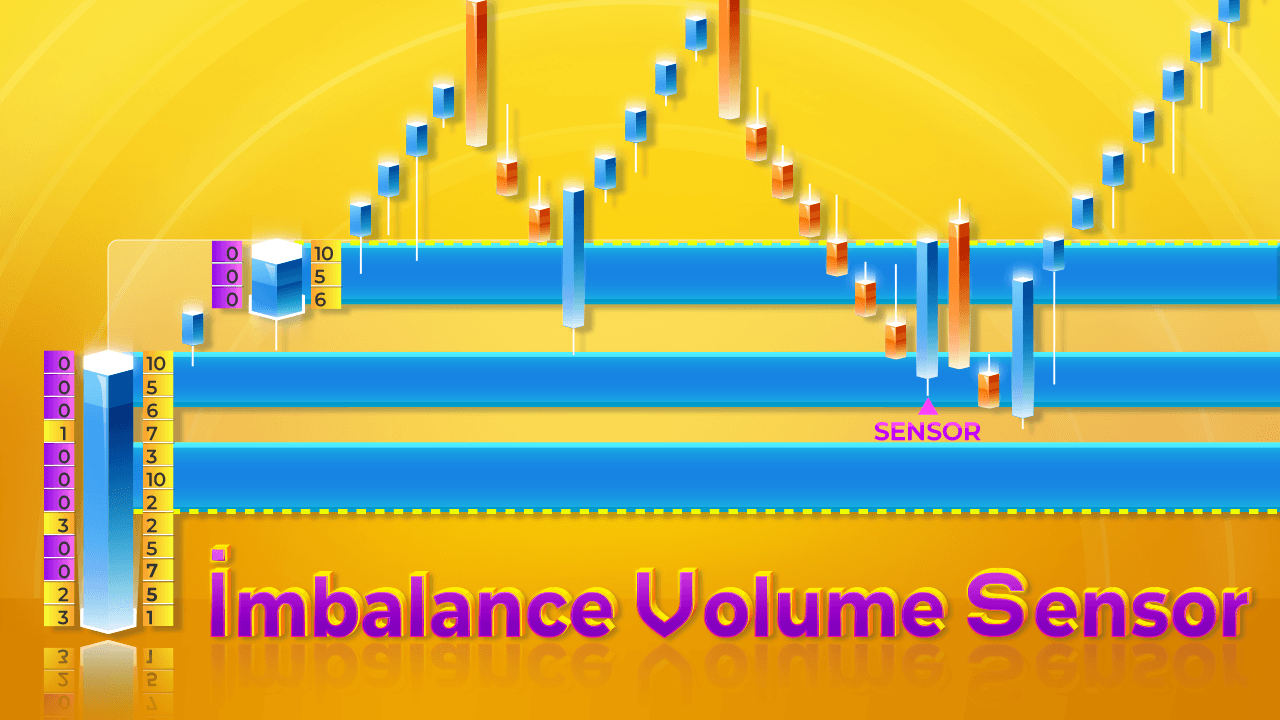
Reveal imbalance areas with tick-level order-flow analysis where buying or selling volume is notably absent.
Explore Zone indicators through practical trading examples and walkthroughs.
12 videos
Spot potential entry signals when market conditions align with your trading approach.
Use dual-timeframe momentum to surface Push & Pull signals when momentum aligns or diverges.
Track shifts in buying and selling pressure, with volume-size filters for the trader groups you want to study.
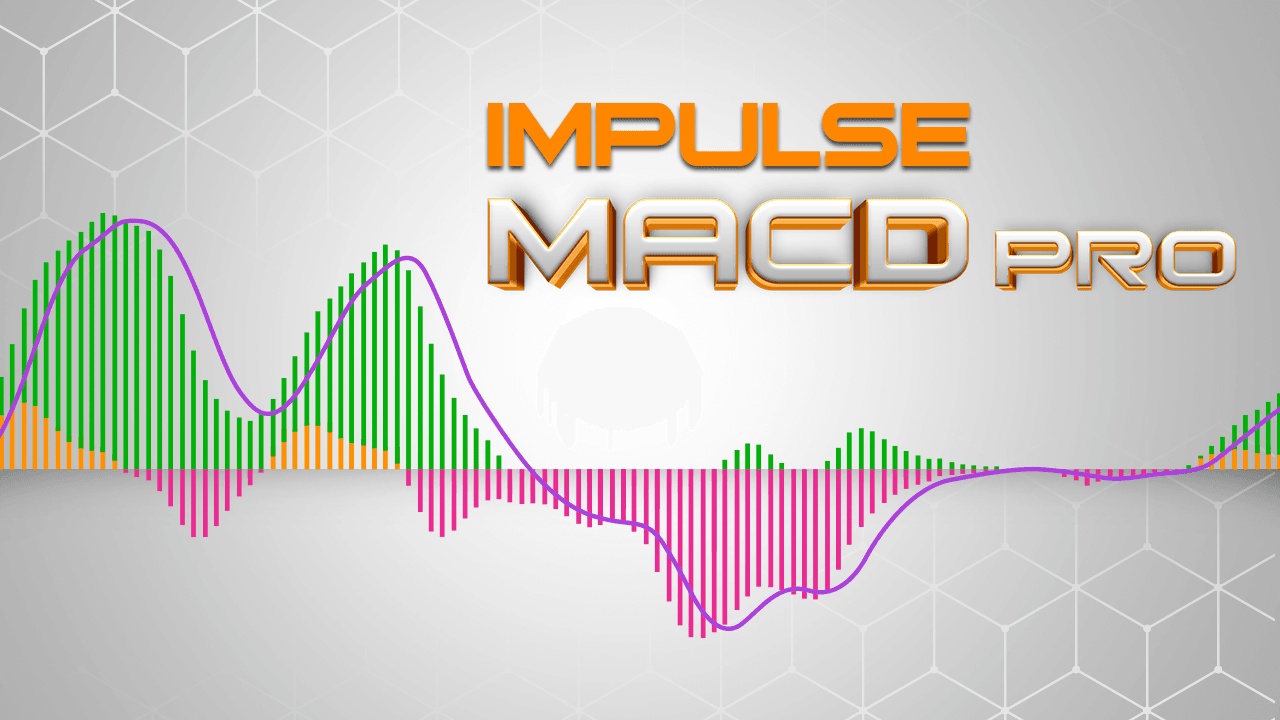
Spot reversals, breaks, and momentum changes with three signals designed to reduce short-term noise.

Detect institutional pressure and absorption zones, then confirm reversal opportunities with structural breakouts.
Explore Signal indicators through practical trading examples and walkthroughs.
10 videos
Trader feedback
Real feedback from traders using ninZa.co indicators across different markets, setups, and trading styles.
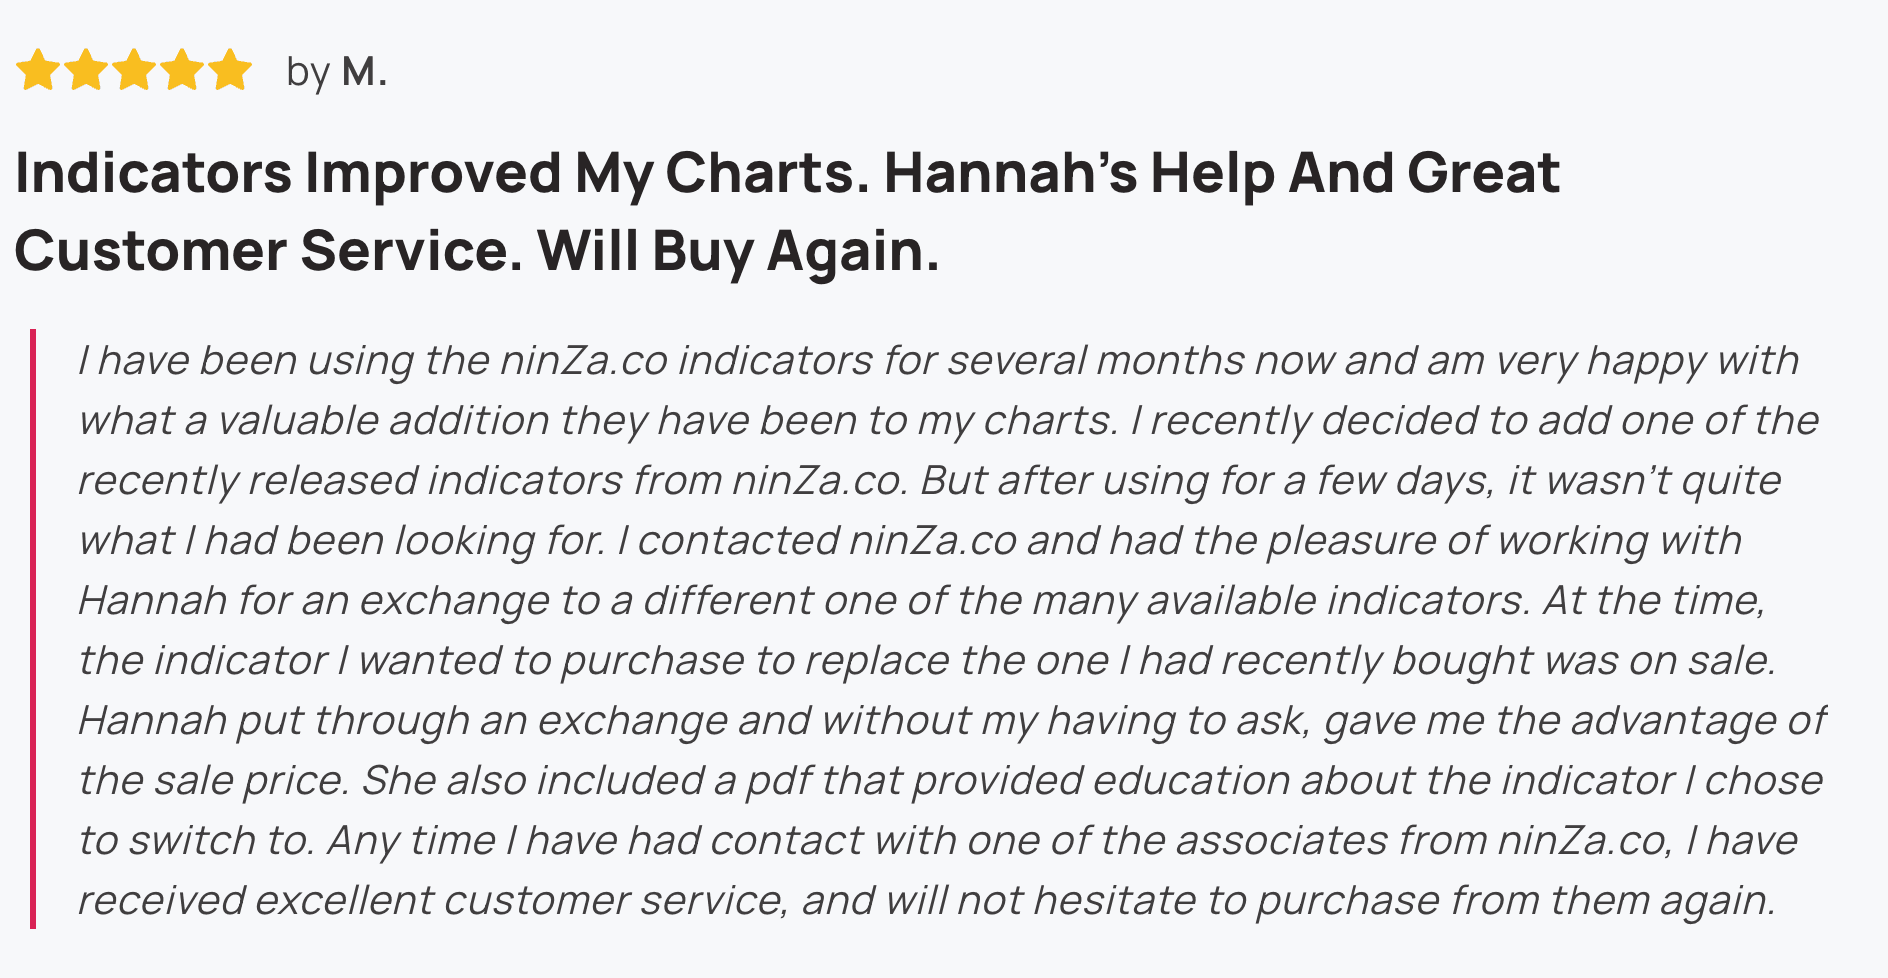
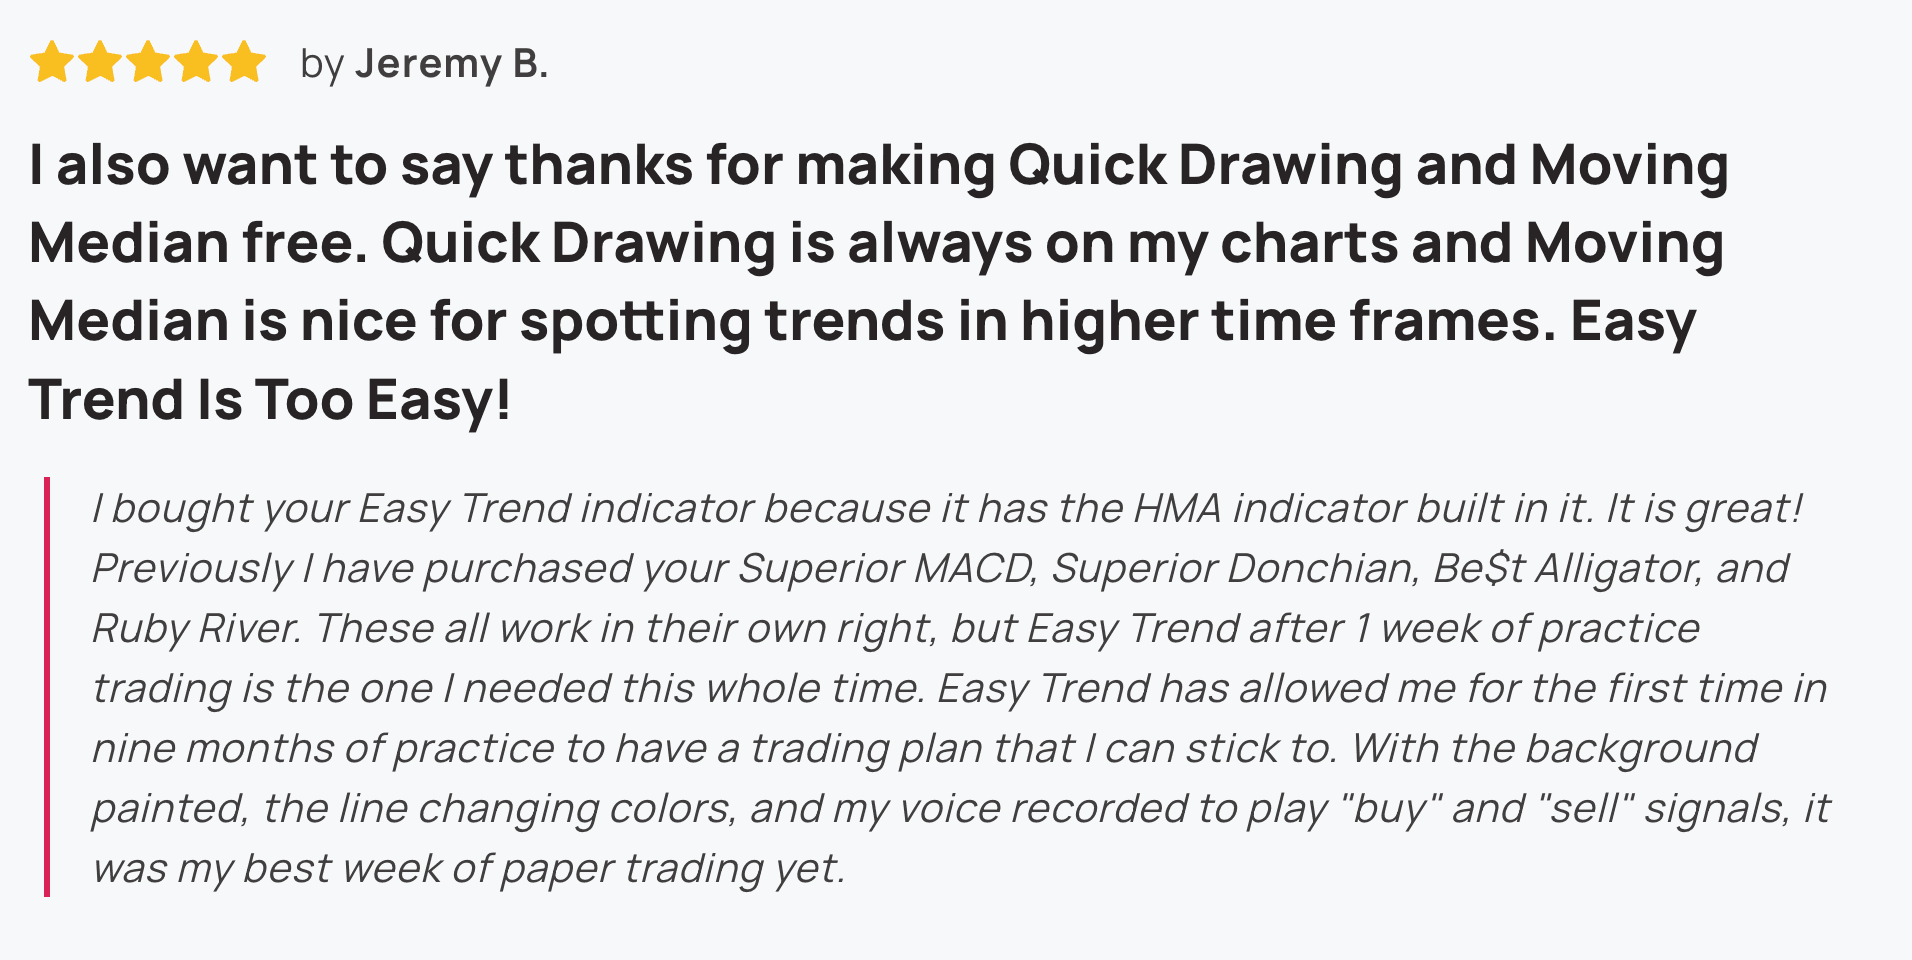

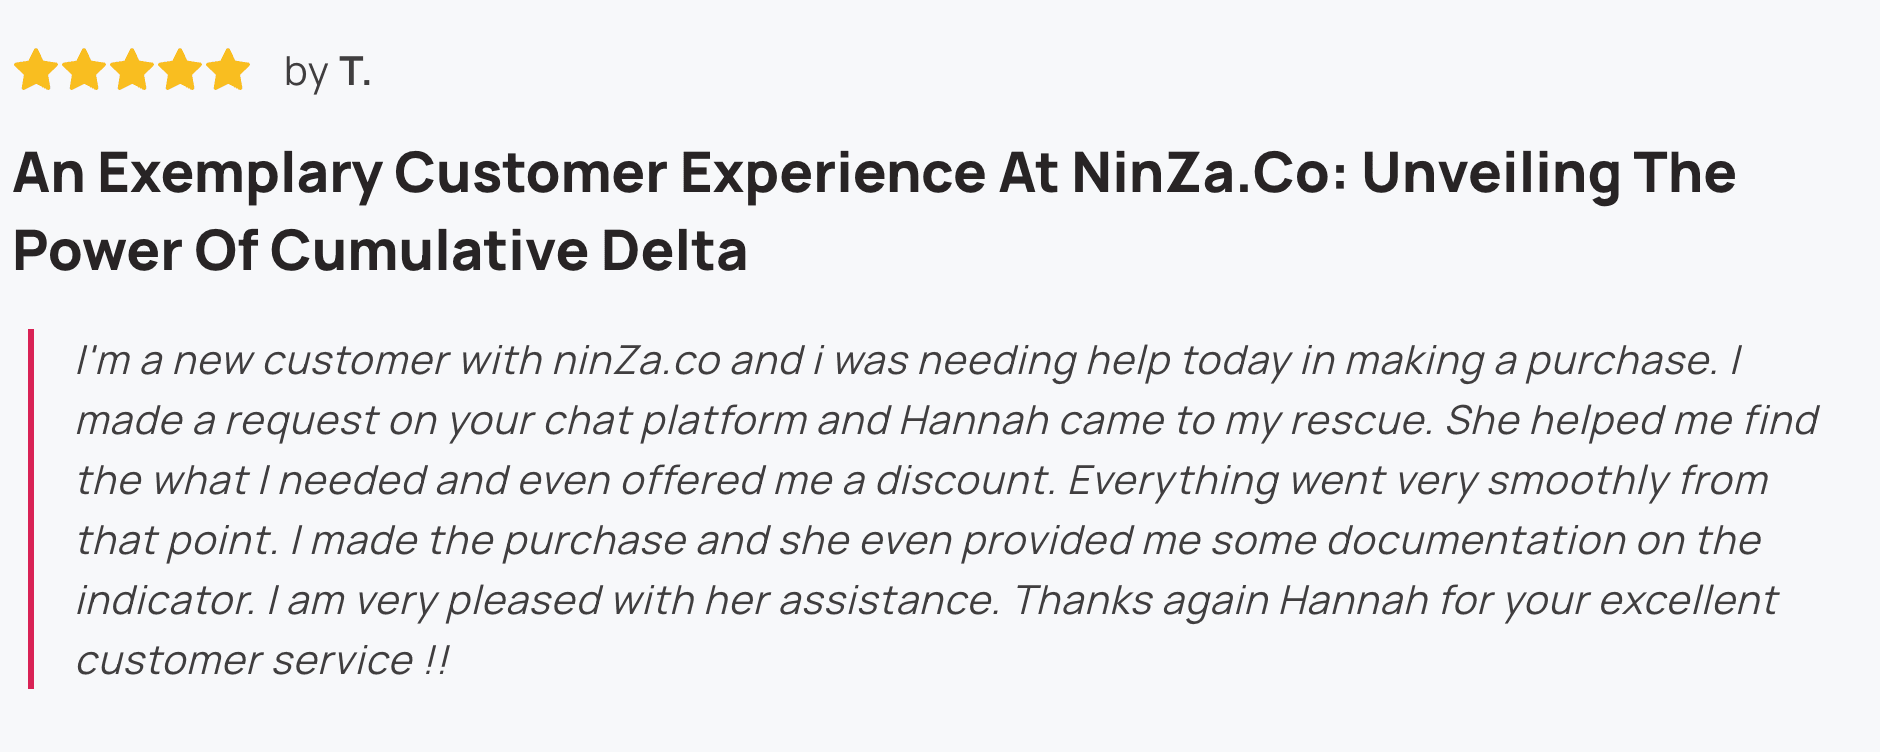
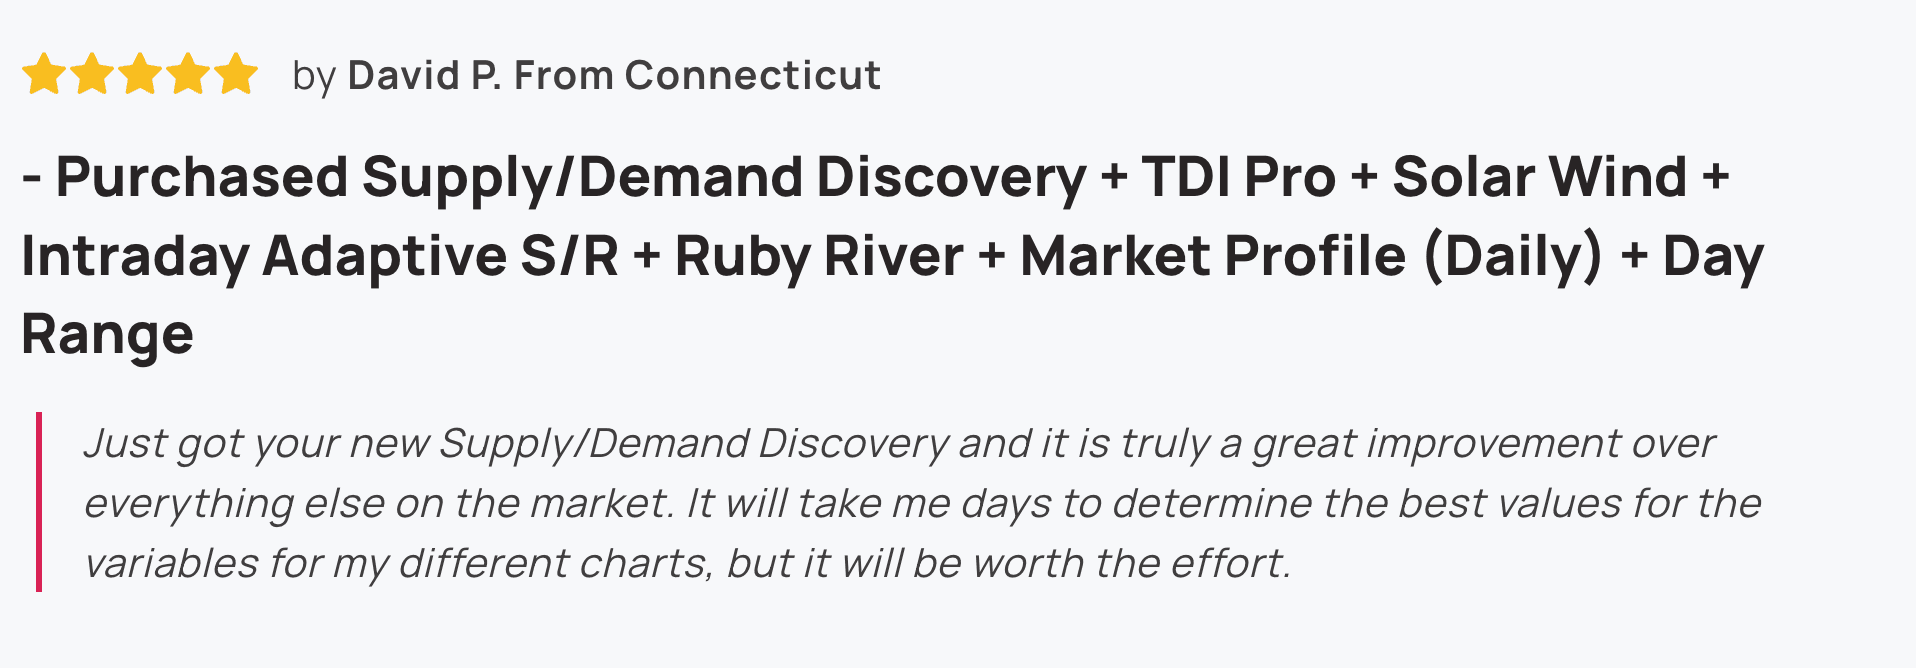
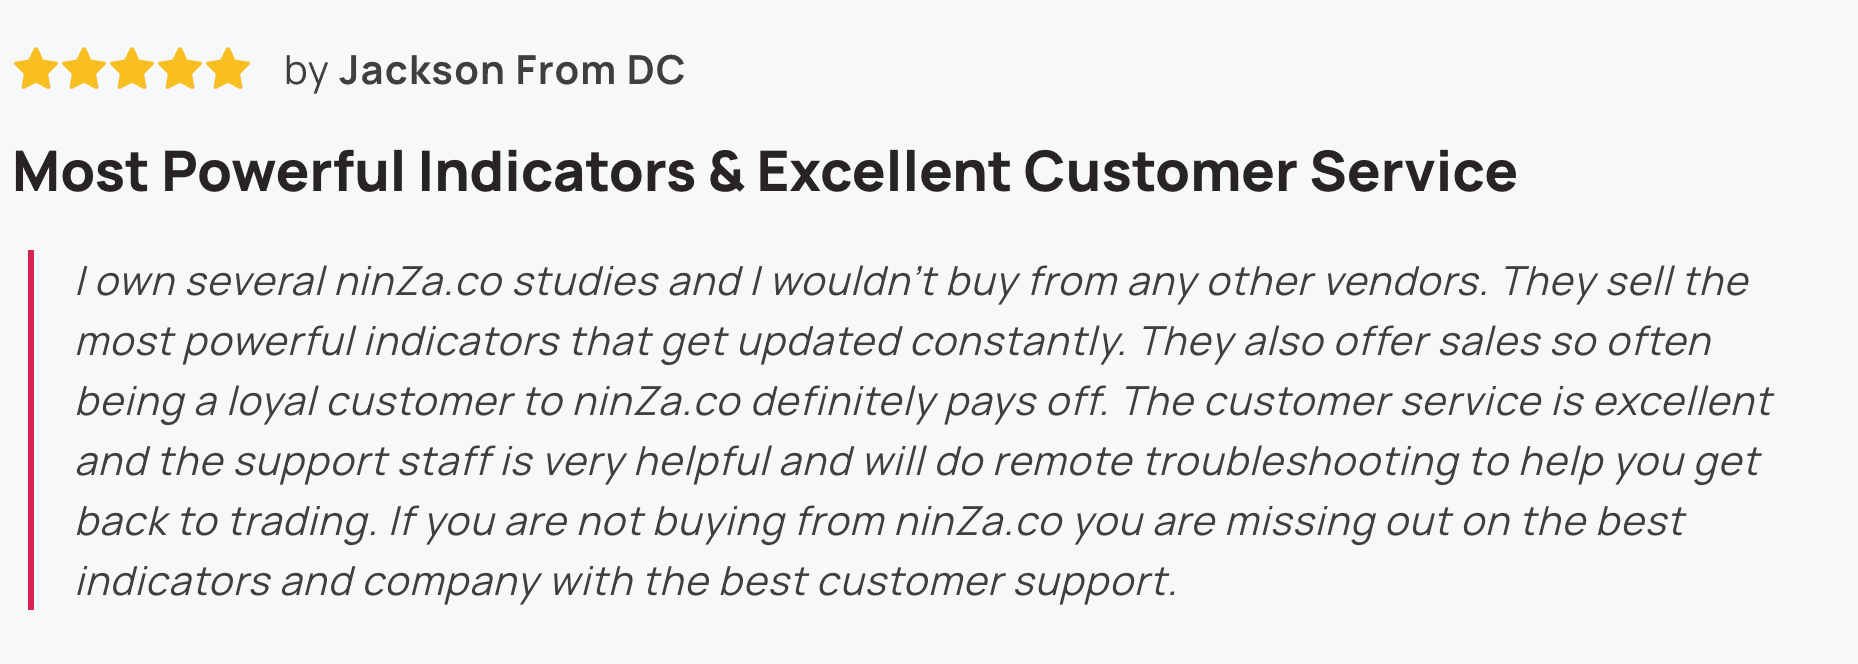
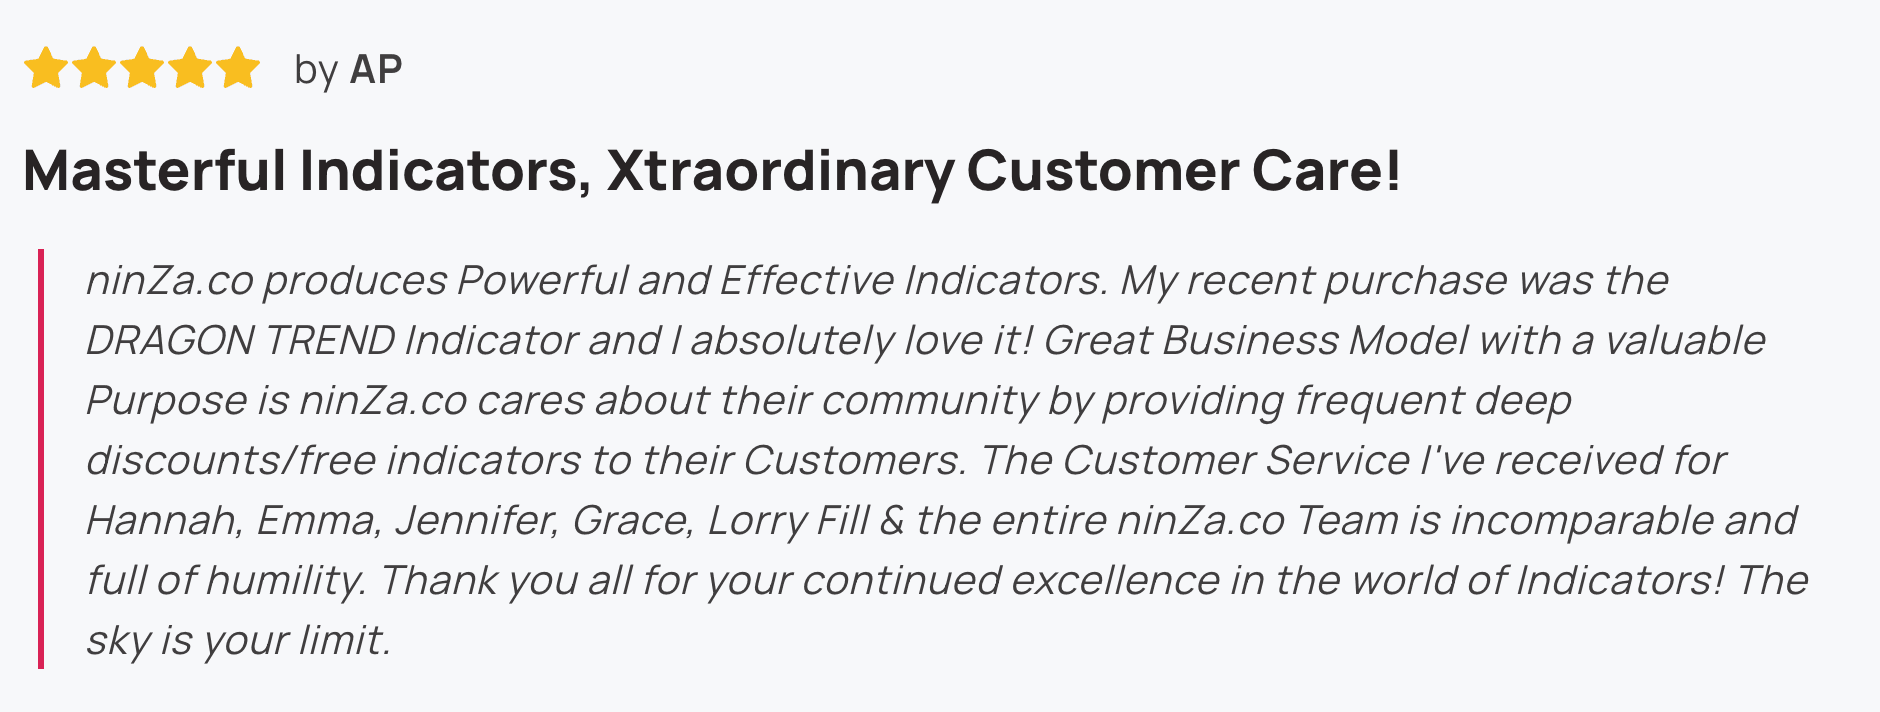
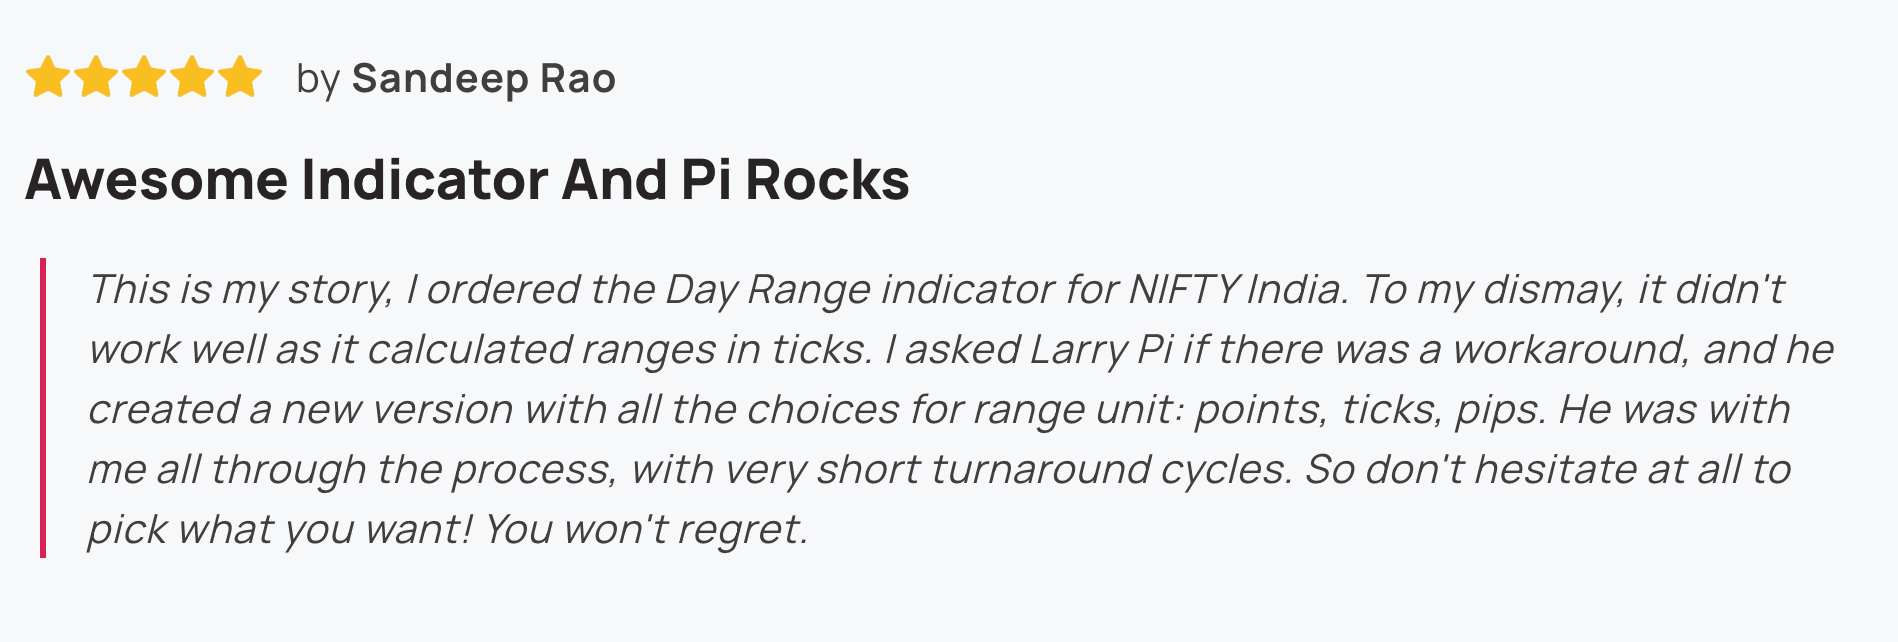
4.9/5
MORE THAN INDICATORS
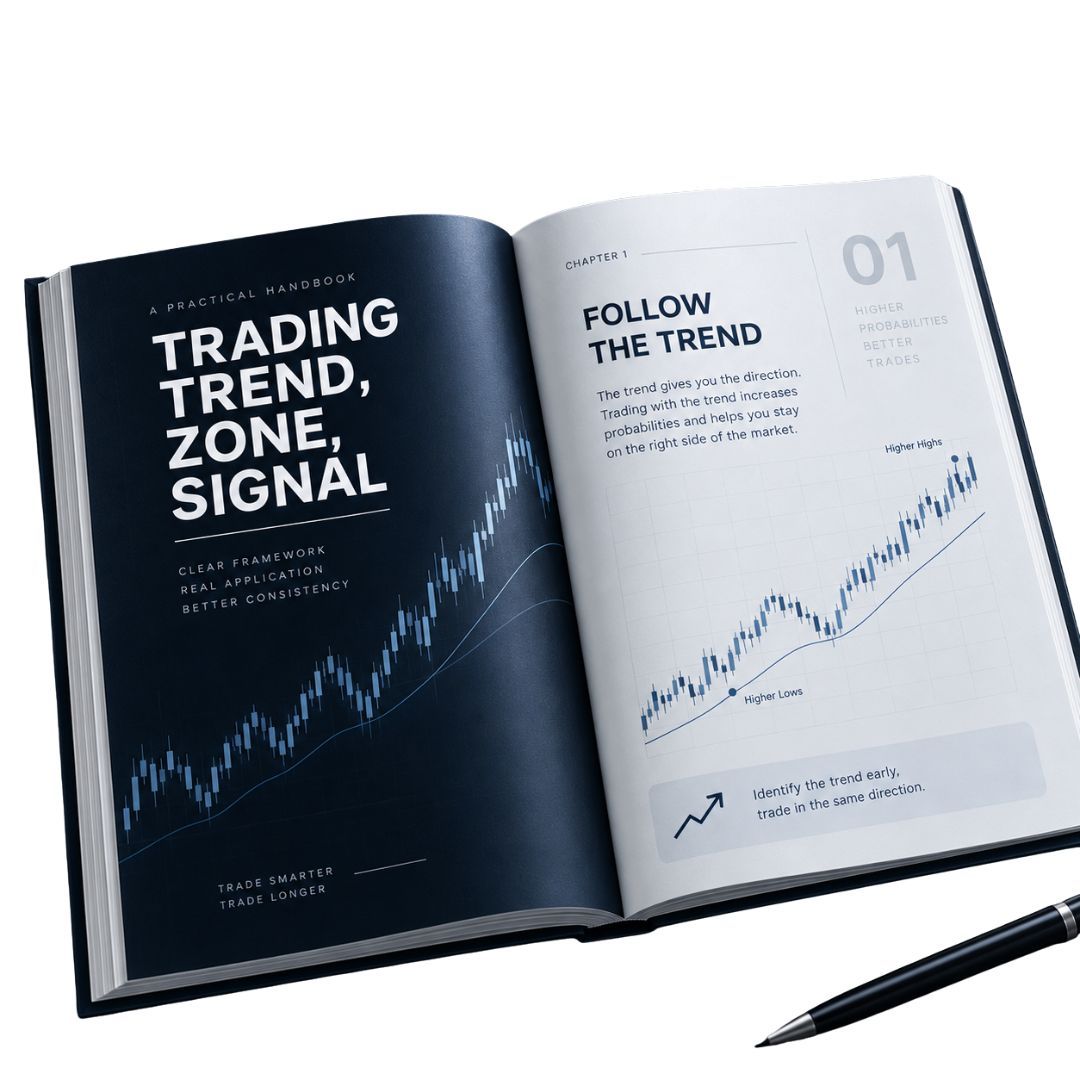
Get everything you need to make the most of your evaluation — from learning each indicator to building workflows, validating ideas, and getting support tailored to the way you trade.
A
01
Get familiar with each indicator and put it into practice.
02
See how the indicators work in real-market conditions.
03
Follow the strategy-building workflow to combine Trend × Zone × Signal into a complete trading strategy.
04 · AUTOMATION
Learn how to combine your indicators with Captain Optimus Strong v2 to automate your strategy.
05 · RESEARCH & REFINEMENT
Get guidance on using Oracle Matrix to find optimal market conditions, backtest, evaluate, and refine your strategy.
B
INCLUDED BONUS
01
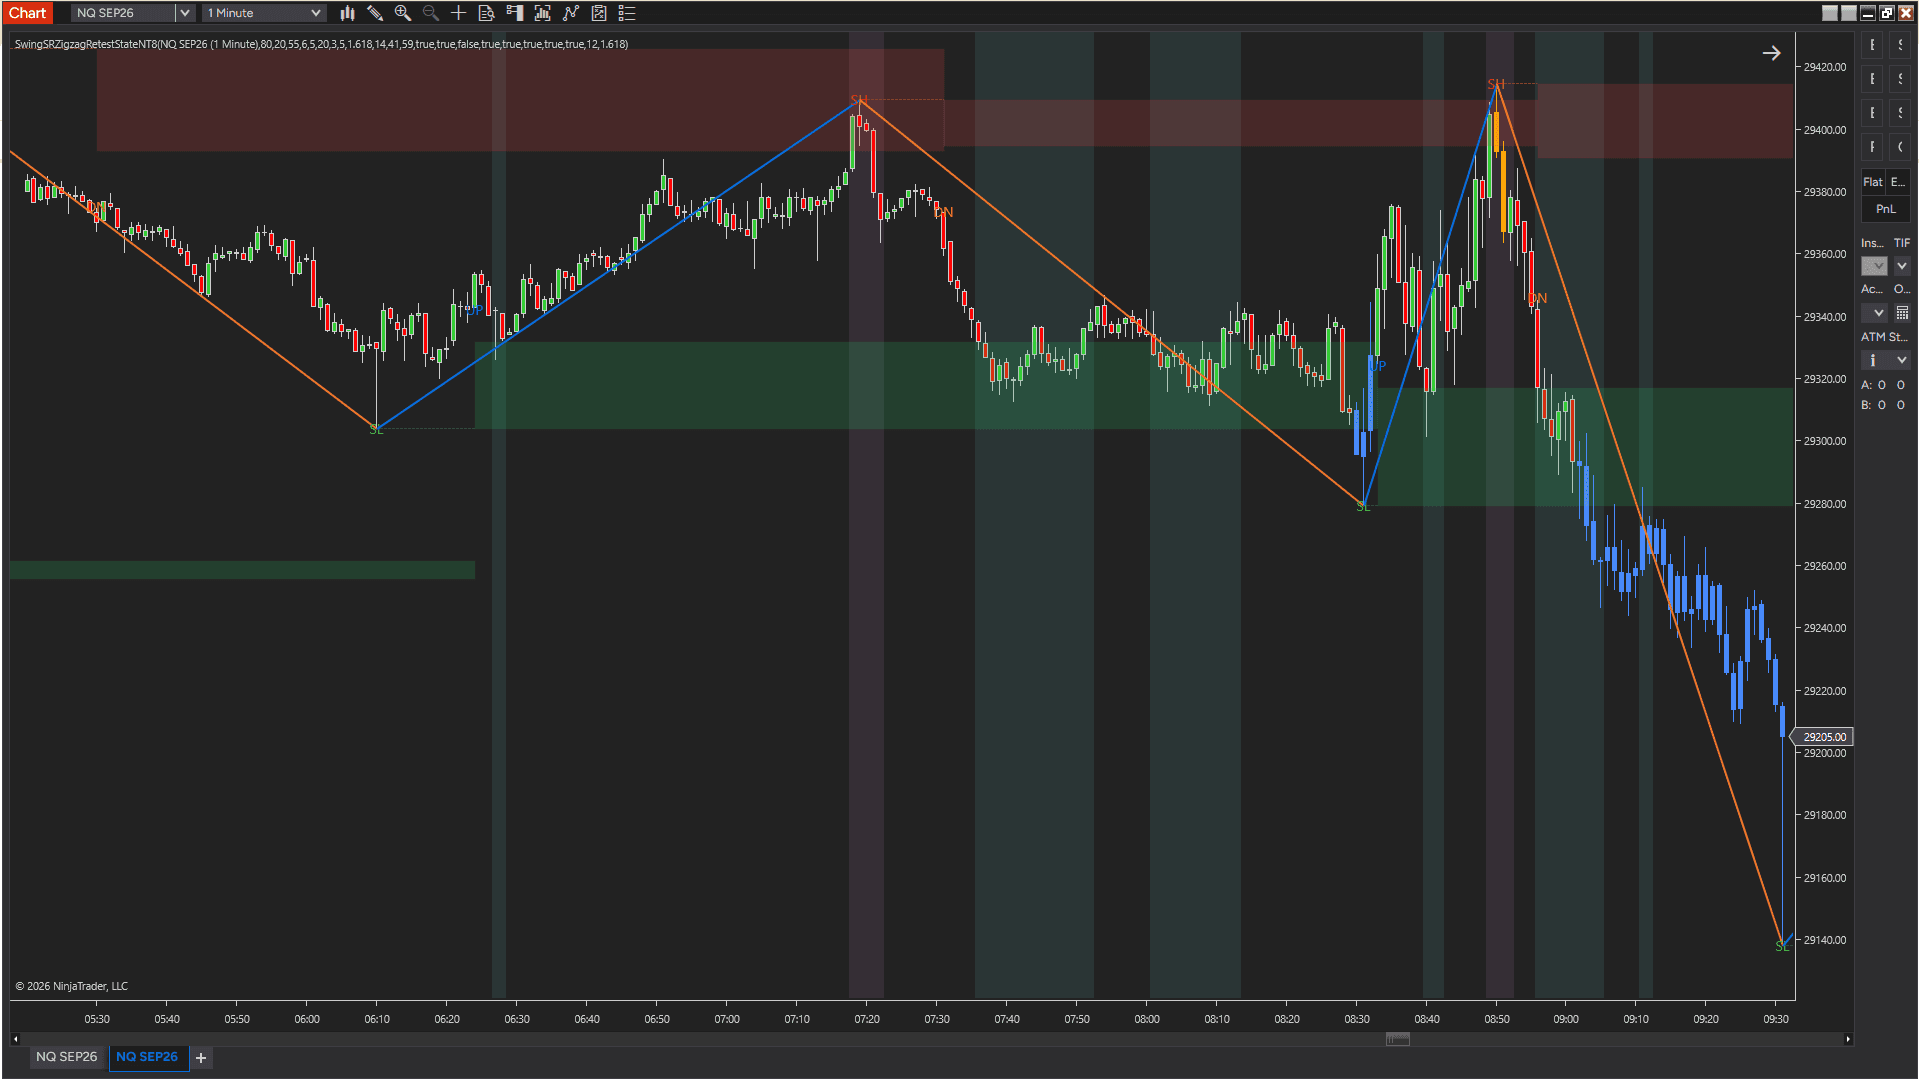
This indicator identifies Support and Resistance (S/R) zones using specific Swing Points derived from a combination of moving averages and momentum, resulting in more consistent and accurate zones.
02
It incorporates the mechanism where Support flips to Resistance (and vice versa) during strong price movements, allowing for more precise identification of S/R zones.
03
In addition to the Signal Zone, the indicator provides two types of Entry Signals based on S/R Zone Retests and S/R Zone Liquidity Sweeps.
C · PERSONALIZED SUPPORT
Work with our Trading and Support Teams to better understand the tools, get your questions answered, and adapt your workflow to your own market and trading style.

FAQ
In fact, the suite includes 1 additional premium indicator of your choice at no additional cost, alongside the 6 you select. This gives you the flexibility to use that extra slot where it creates the most value.
If you want to expand beyond those 7, additional indicators can still be added based on their applicable R2B or Absolute Price value.
For a complete understanding of UTF Suite pricing and the applicable exchange terms, please refer to the full policy here: https://ninza.co/utf-suite
The UTF Suite isn't about replacing what already works.
It gives you a broader pool of trading intelligence to test against your existing approach – whether that means validating a new idea, finding a stronger alternative, or uncovering possibilities your current setup doesn't cover.
With 12 indicators across Trend × Zone × Signal, 30 days of full access, and supporting strategy-building materials, the suite gives you everything needed to put new ideas into practice and evaluate their value in real market conditions.
We understand – evaluating 12 different indicators can feel like a lot to take on, especially when each one has its own logic and application. But UTF Suite isn't designed to leave you alone with 12 indicators to figure out. The evaluation comes with the resources and structure needed to understand what each indicator does, see how it behaves in real markets, and explore how different indicators can work together. Detailed manuals, video tutorials, live trading videos, and the UTF Materials are included throughout the 30-day evaluation – covering everything from understanding individual indicators to combining Trend × Zone × Signal into a complete trading strategy.
It's a valid concern – having access to 12 indicators is one thing. Knowing how to turn them into a coherent setup is another. That's where the Universal Trading Framework comes in. Rather than relying on random combinations, it provides a structured approach to building a strategy around three essential roles: Trend × Zone × Signal. The included UTF materials walk through this framework step by step, supported by detailed manuals, video tutorials, and live trading videos to help put each indicator into practice and explore different combinations. You don't need to know the right combination from the start. Use the 30-day evaluation to explore different possibilities, refine what fits, and choose the 6 indicators that ultimately earn a place in your trading.
Pricing
Get 30 days to research and trade with all 12 indicators before you decide. Then choose 6 indicators to keep for life — with detailed manuals, bonus tools, and personalized support included.
$2875
EVERYTHING INCLUDED
Your Suite includes the research time, trading tools, learning resources, bonus indicator, and support you need to discover what actually fits your trading.
CHOOSE YOUR OPTION
Both options include the same 30-day indicator evaluation and the ability to choose 6 indicators to keep for life.
Premium Services are optional. The standard UTF Suite #1 remains available for a one-time payment of $1000.
Policy
_1787026707358.svg)
NINZA is an official member of NinjaTrader Ecosystem together with 600+ industry-leading professionals that provide traders with quality trading products & services.




even more payment methods
Quick Links
Instructions
Support
Resources & Information
© Copyright 2026 All Rights Reserved



Because software products may be copied and stored easily, we will NOT issue refunds of any kind. ALL SALES ARE FINAL & NON-REFUNDABLE!
Futures, foreign currency, and options trading contains substantial risk and is not for every investor. An investor could potentially lose all or more than the initial investment. Risk capital is money that can be lost without jeopardizing one's financial security or lifestyle. Only risk capital should be used for trading and only those with sufficient risk capital should consider trading. Past performance is not necessarily indicative of future results.
Hypothetical performance results have many inherent limitations, some of which are described below. No representation is being made that any account will or is likely to achieve profits or losses similar to those shown; in fact, there are frequently sharp differences between hypothetical performance results and the actual results subsequently achieved by any particular trading program. One of the limitations of hypothetical performance results is that they are generally prepared with the benefit of hindsight. In addition, hypothetical trading does not involve financial risk, and no hypothetical trading record can completely account for the impact of financial risk of actual trading. For example, the ability to withstand losses or to adhere to a particular trading program in spite of trading losses are material points which can also adversely affect actual trading results. There are numerous other factors related to the markets in general or to the implementation of any specific trading program which cannot be fully accounted for in the preparation of hypothetical performance results and all which can adversely affect trading results.
NinjaTrader® is a registered trademark of NinjaTrader Group, LLC. No NinjaTrader company has any affiliation with the owner, developer, or provider of the products or services described herein, or any interest, ownership or otherwise, in any such product or service, or endorses, recommends or approves any such product or service.