NINZA CrossWave

NINZA CrossWave

NINZA is officially multi-platform.

Choose your indicators and assign each license to TradingView or MetaTrader 5.

👉 Build your setup

3 newest indicators. 1 exclusive bundle.

3 newest indicators. 1 exclusive bundle.

Execution, pattern recognition, and liquidity — in 1 september-exclusive bundle

➡️ Explore this bundle

[Live Trading] Volume Flow Scalping Solution

[Live Trading] Volume Flow Scalping Solution

See how volume creates price inertia through a live trading session with 14 trades and 12 wins.

👉 See the strategy in action

Zaccess extended through September

Zaccess extended through September

Receive up to $800 in purchase assistance

Explore eligible products →

[Live Trading #4] Expansion Entry Scalping Solution

[Live Trading #4] Expansion Entry Scalping Solution

20 consecutive scalping trades with Momentum-confirmed candles

Watch all 4 live trading sessions

[Abs] FELIX2

Developed by Antonino Venuto

FELIX2 by Antonino Venuto

Turn trend-following into a defined, testable process.

FELIX2 is a rules-based trend-following framework developed by professional trader Antonino Venuto.

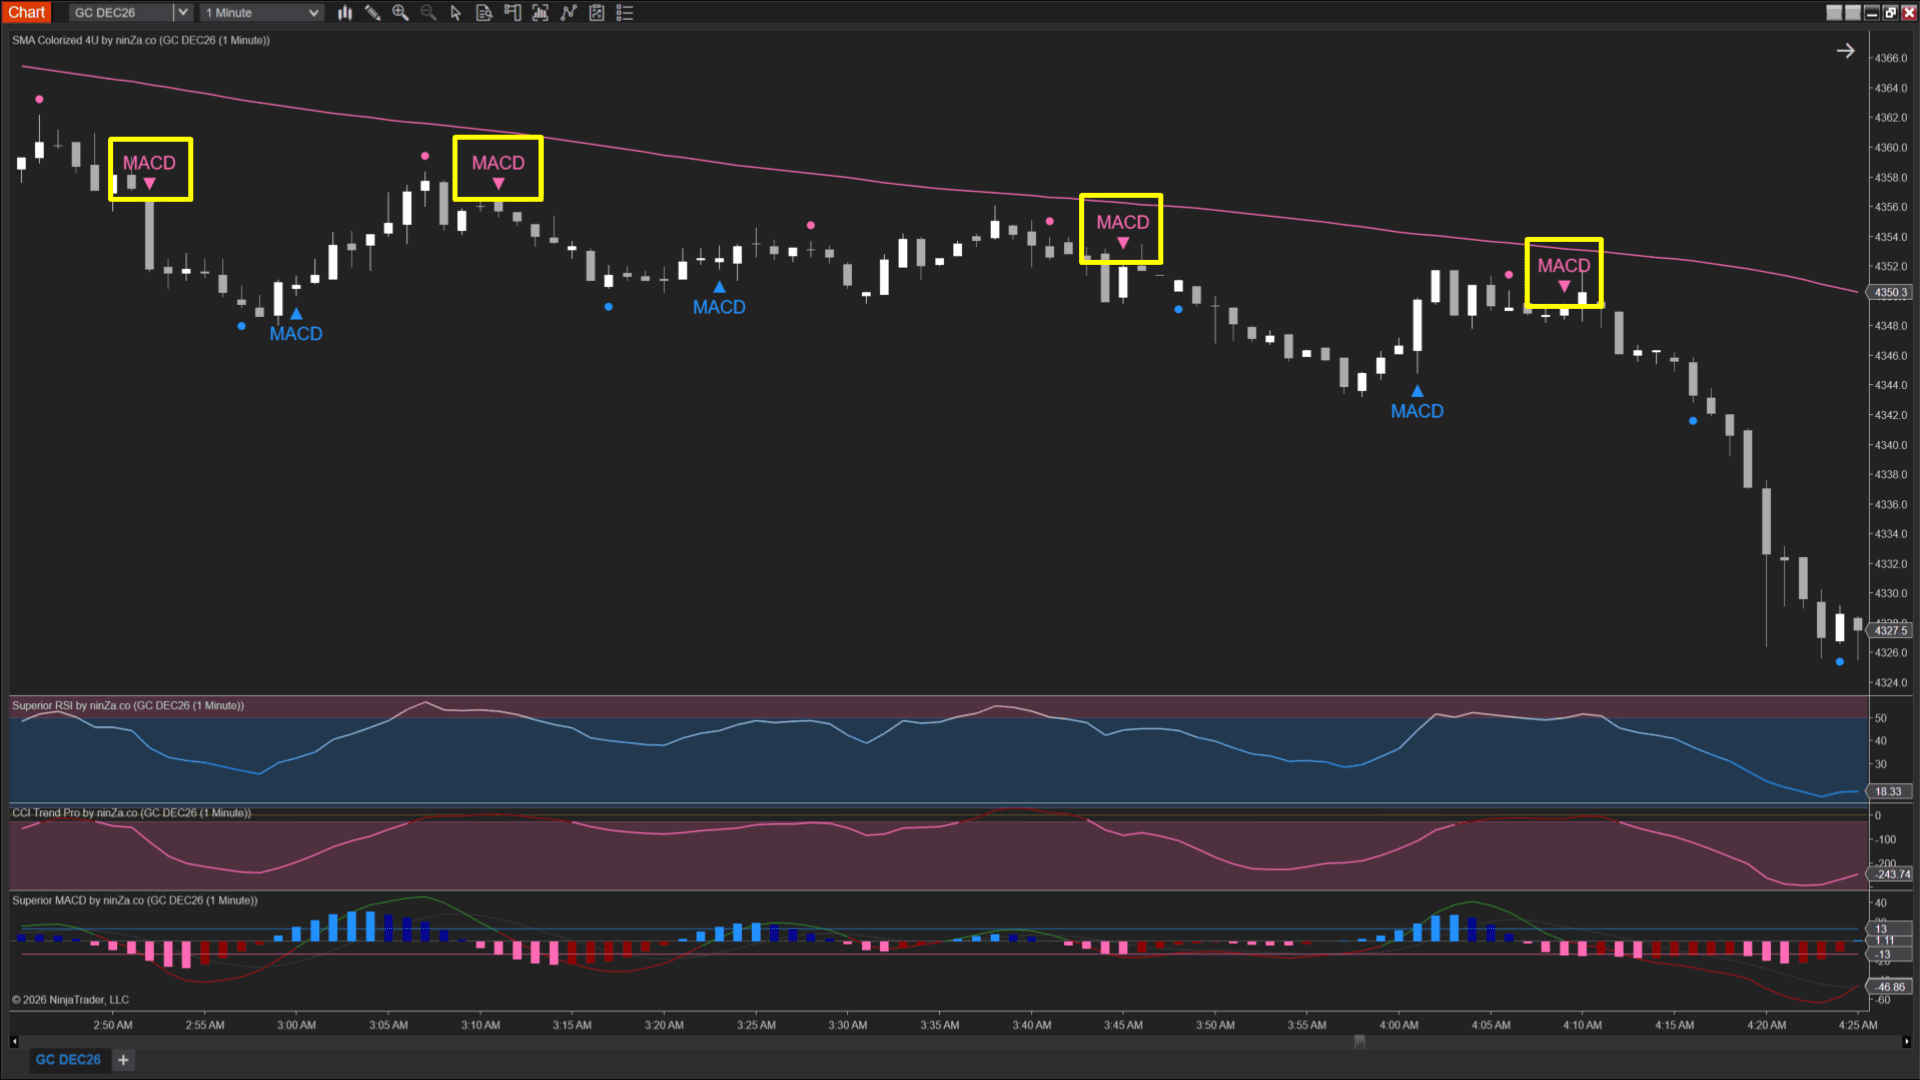
Instead of relying on 1 indicator or treating several indicators as interchangeable signals, FELIX2 gives each one a specific job: establish trend direction, assess momentum strength, confirm momentum direction, then trigger the entry.

The result is a clearer way to evaluate trend-following setups through defined conditions rather than loosely interpreted confluence.

 
4-part decision sequence
01 Trend directionEstablish the broader directional bias
02 Momentum strengthCheck whether momentum supports that bias
03 Momentum directionRequire another layer of directional alignment
04 Entry triggerTime the entry only after the other conditions align

The principle

Each signal should have a defined job

Trend direction and entry timing are not the same thing.

Neither are momentum strength and momentum direction.

When several indicators are simply stacked together as buy or sell signals, it becomes harder to know why a setup qualifies and what each indicator is actually contributing.

FELIX2 takes a more structured approach:

Define what each indicator is responsible for, then require the conditions to align before entry.

This keeps the decision process clear without asking 1 indicator to do everything.

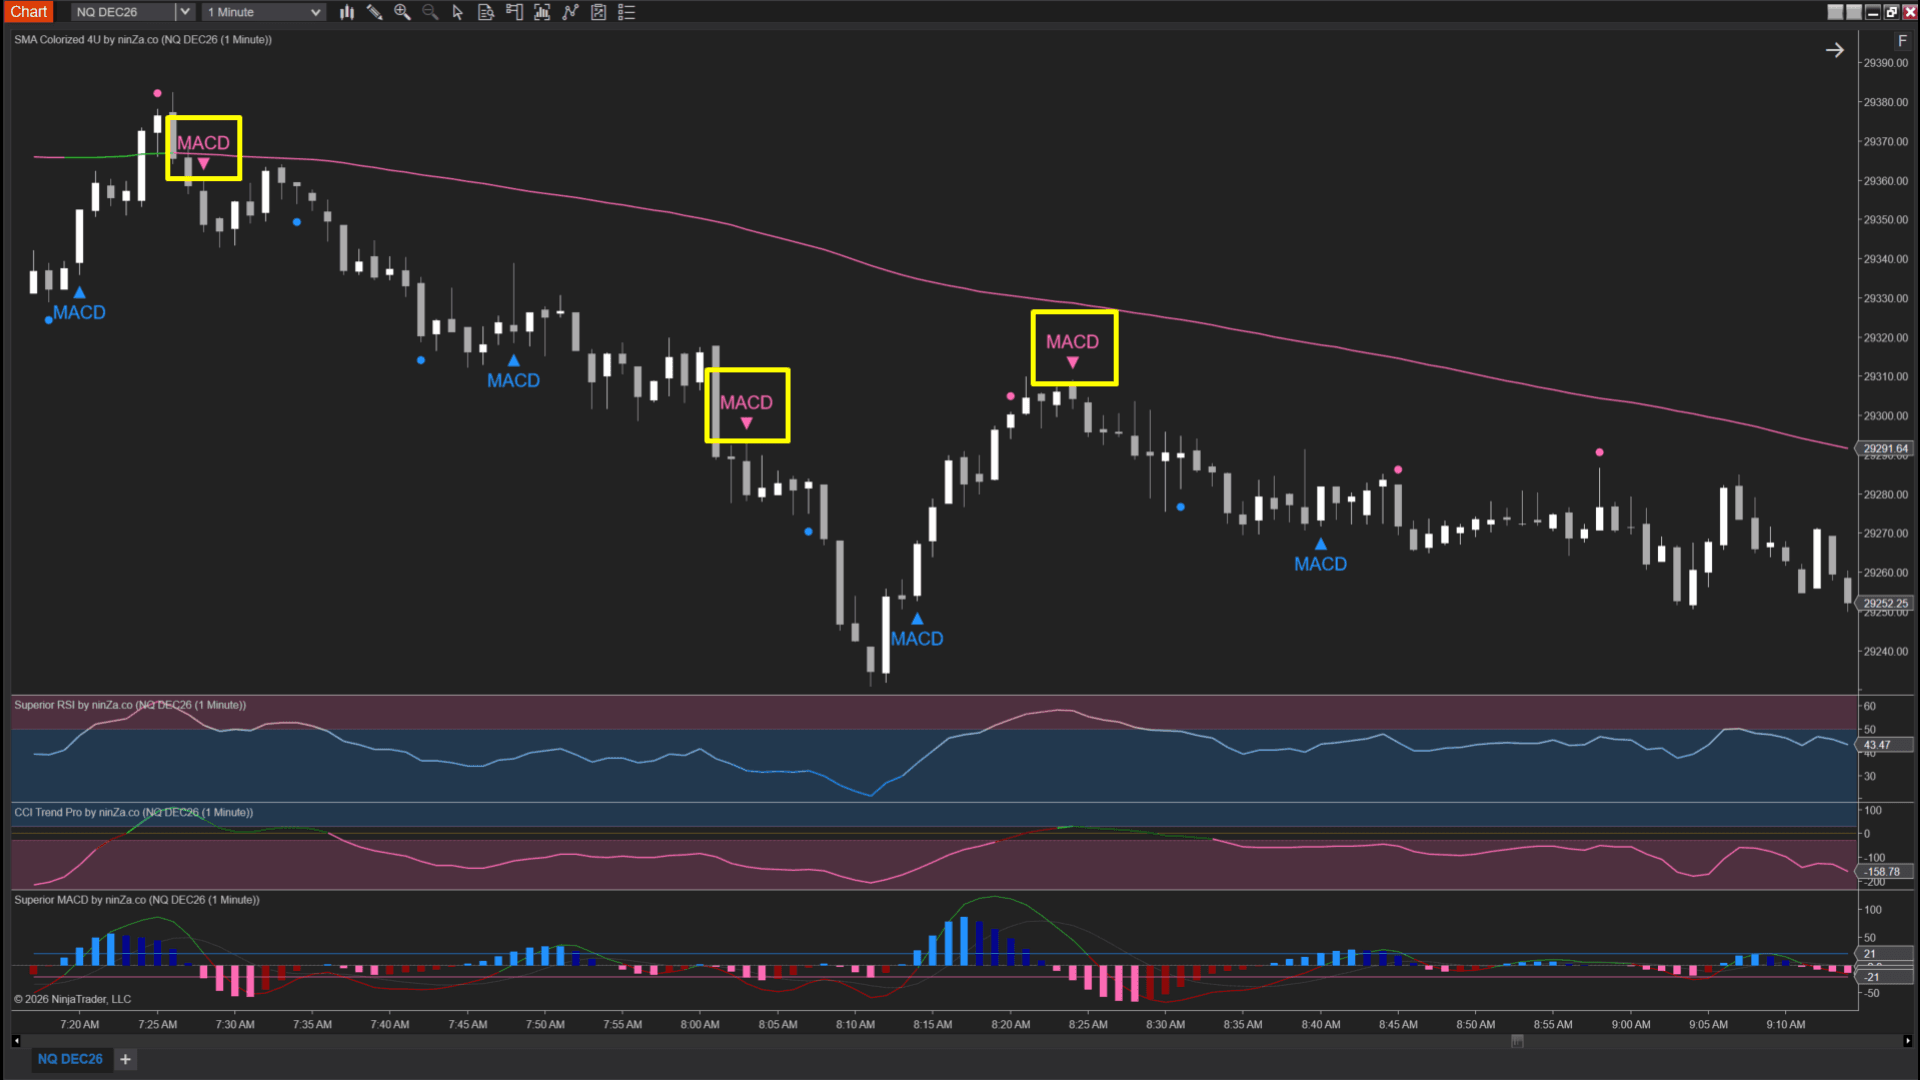
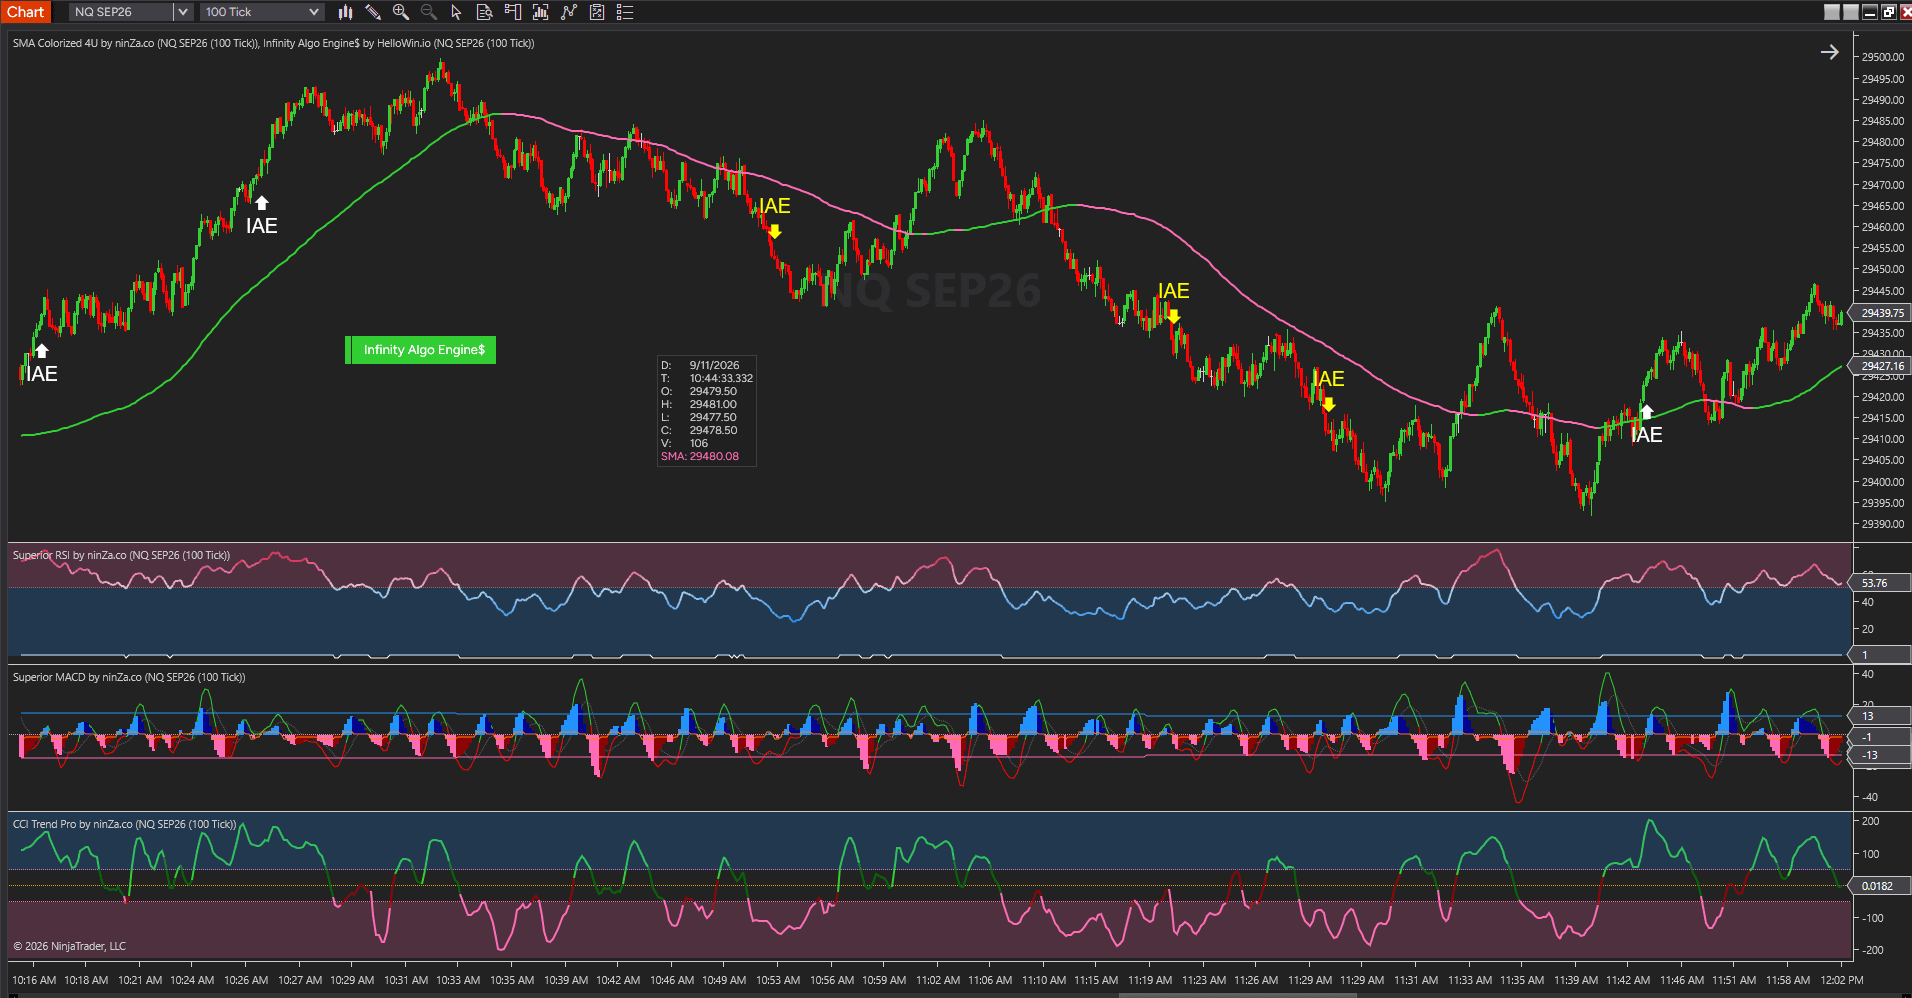
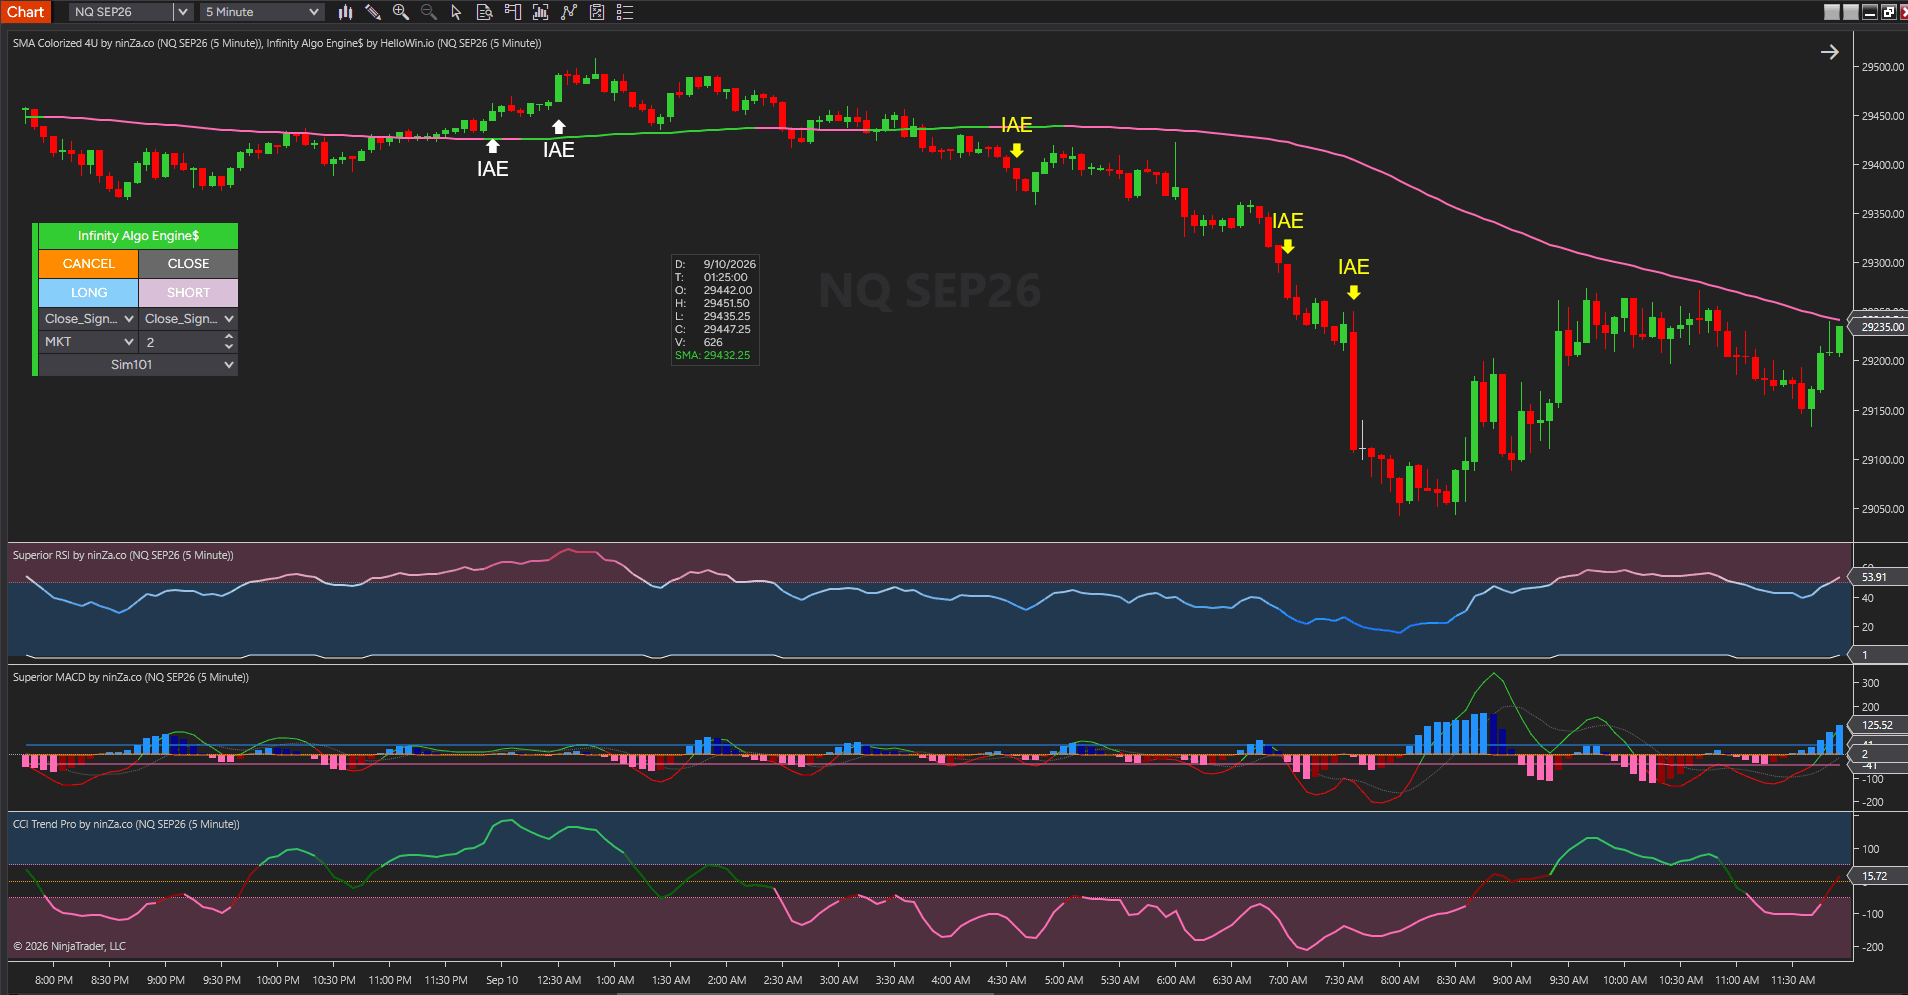
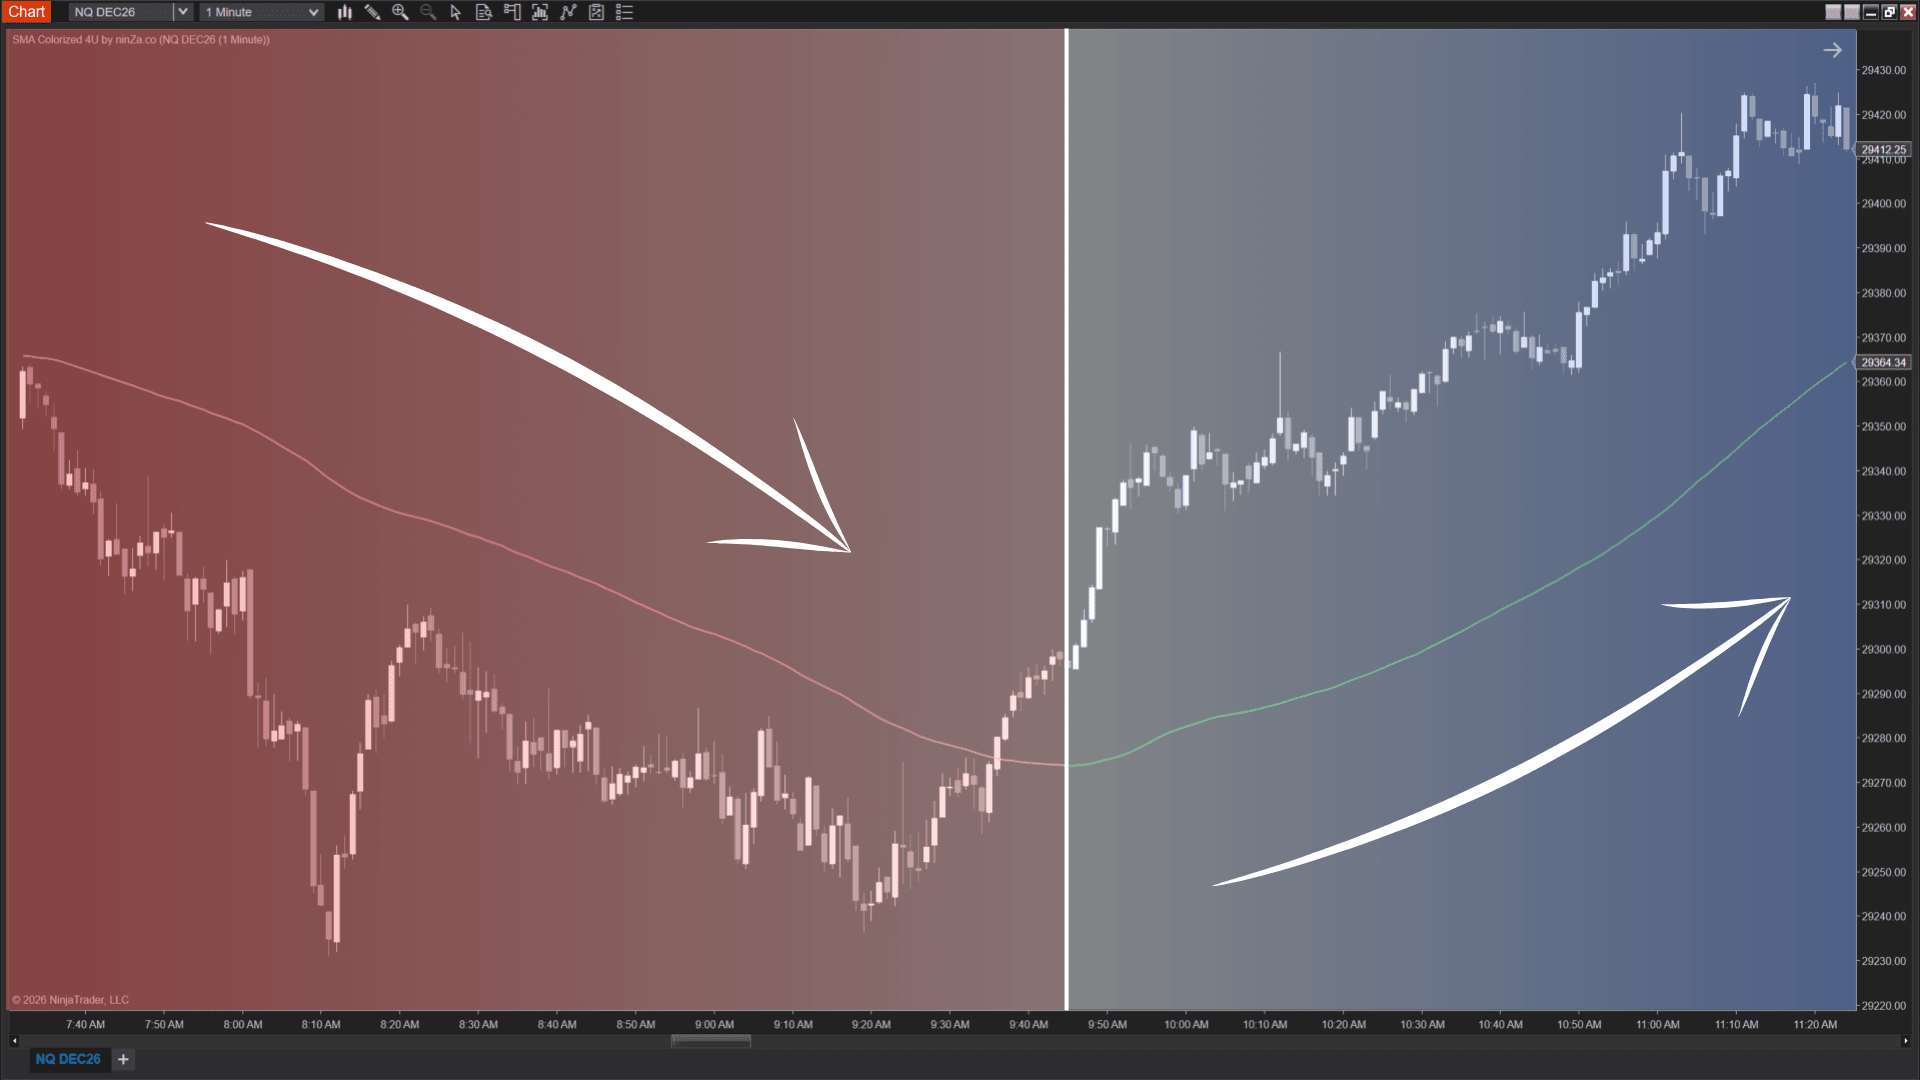
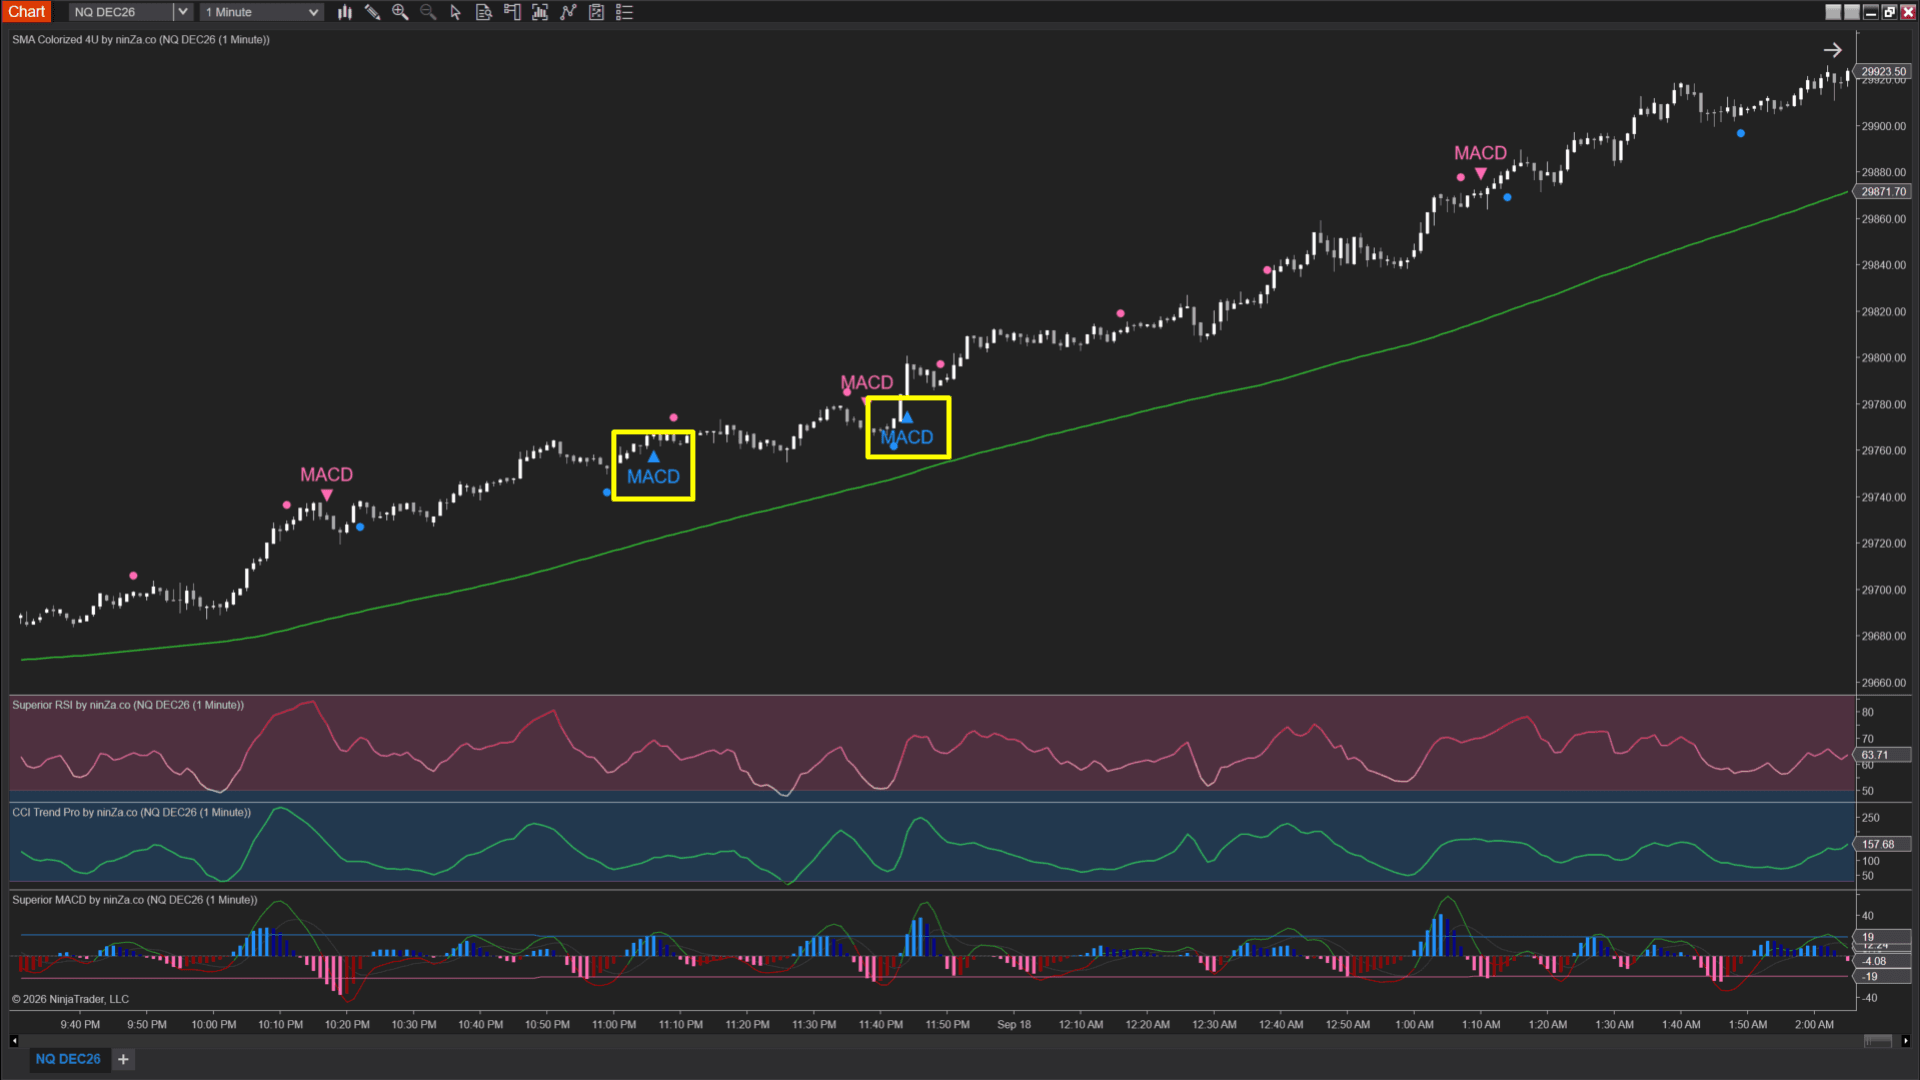
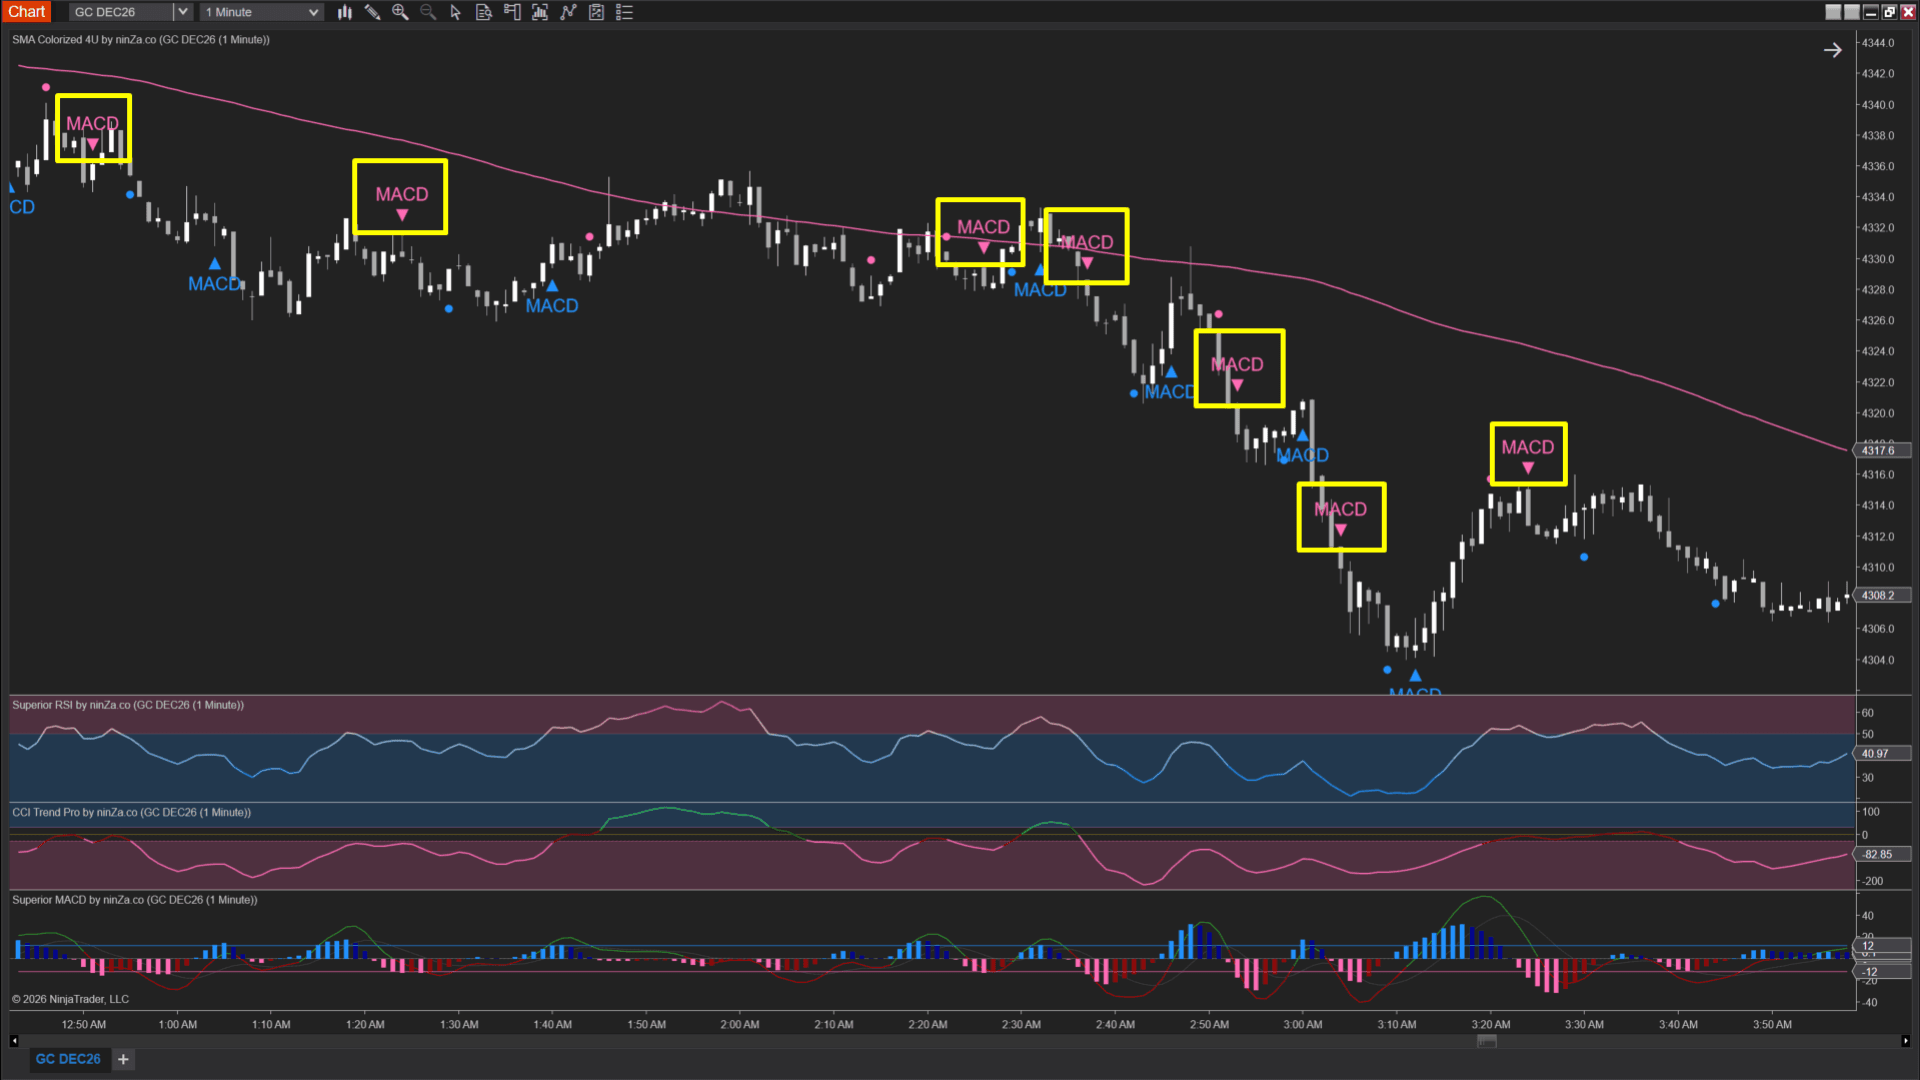
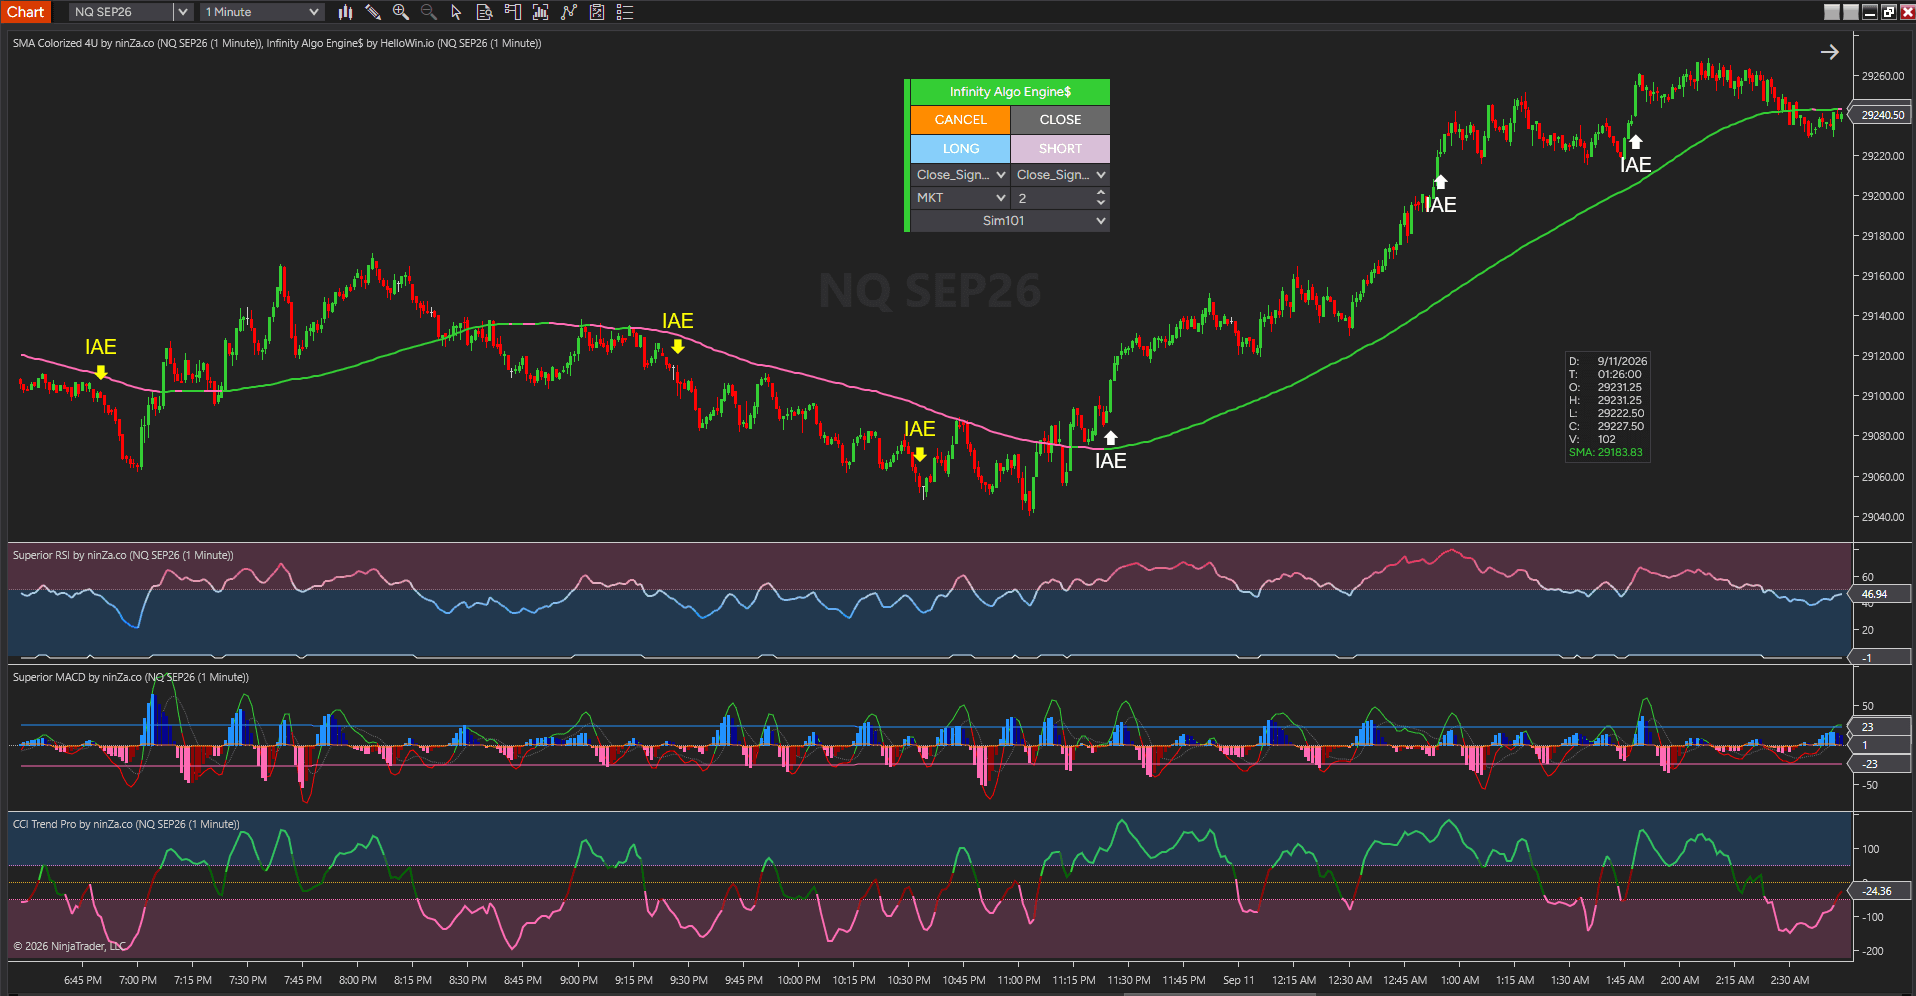
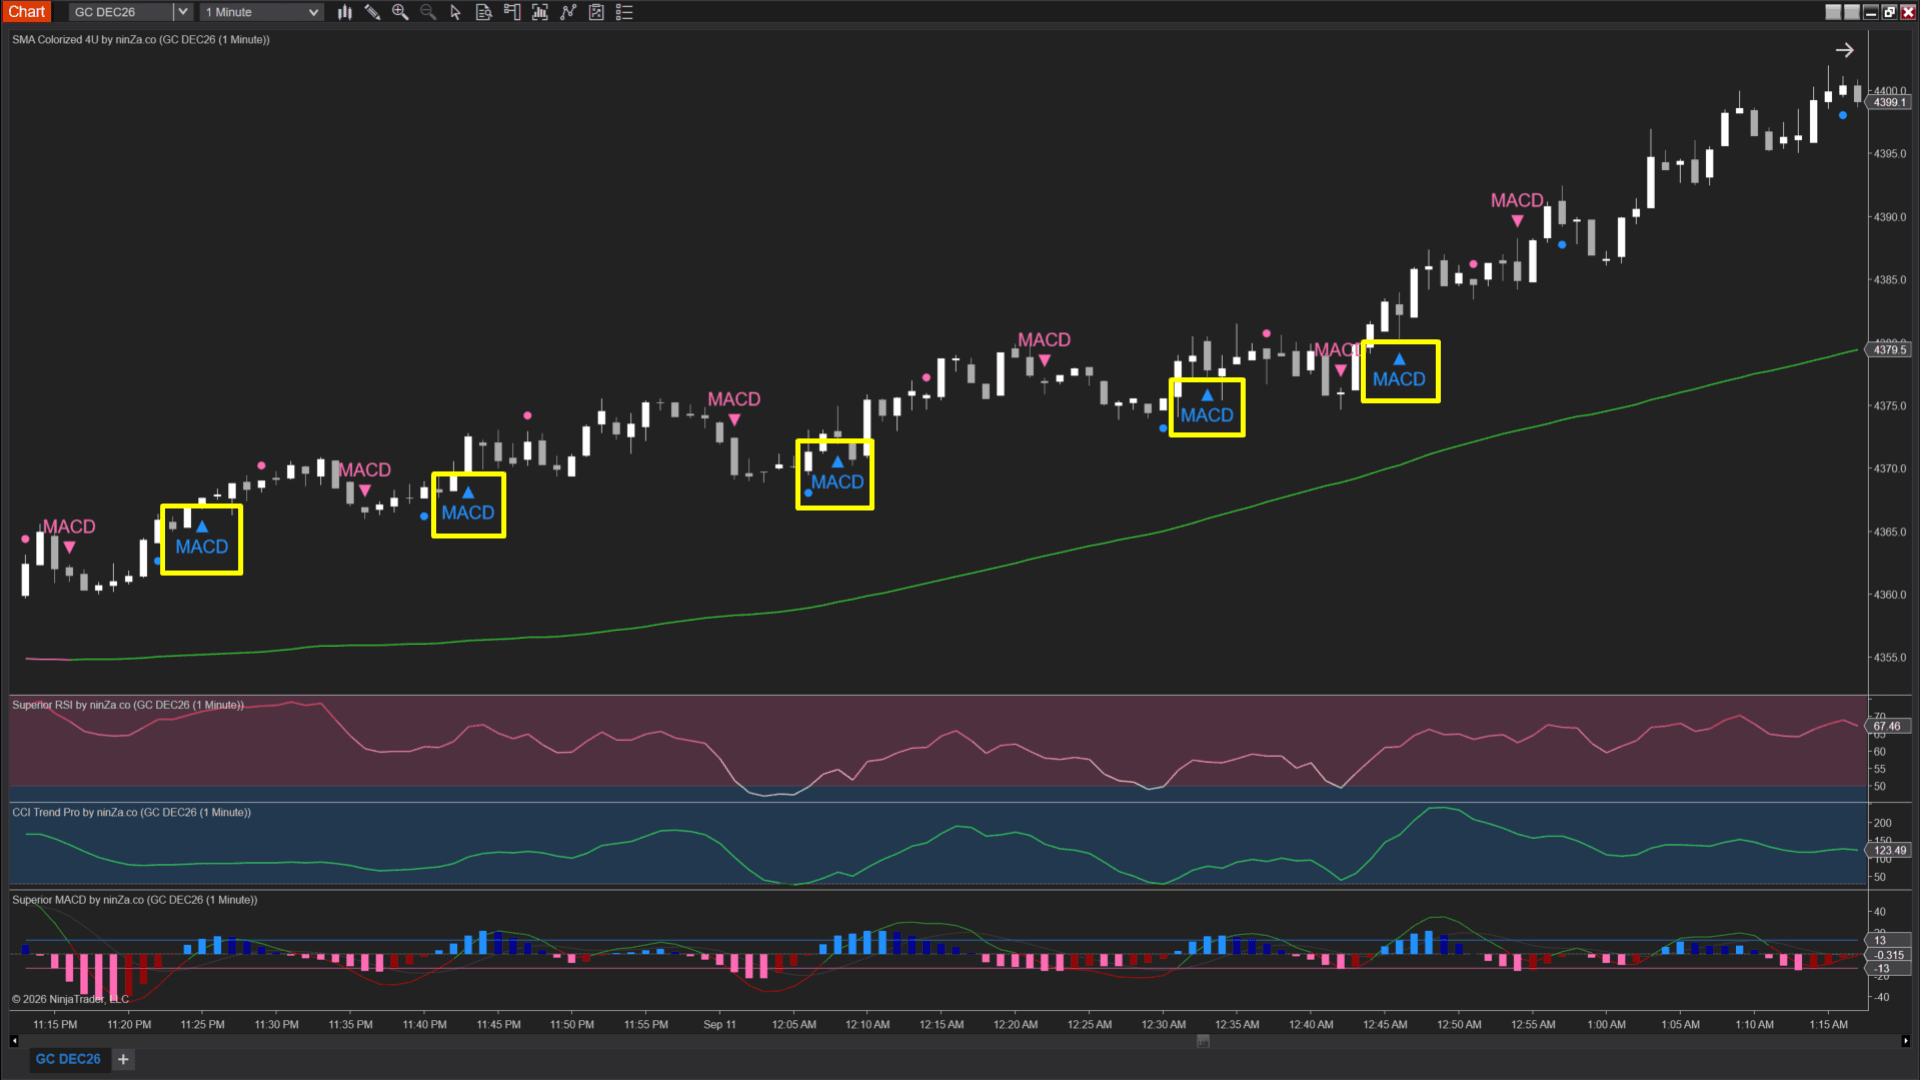
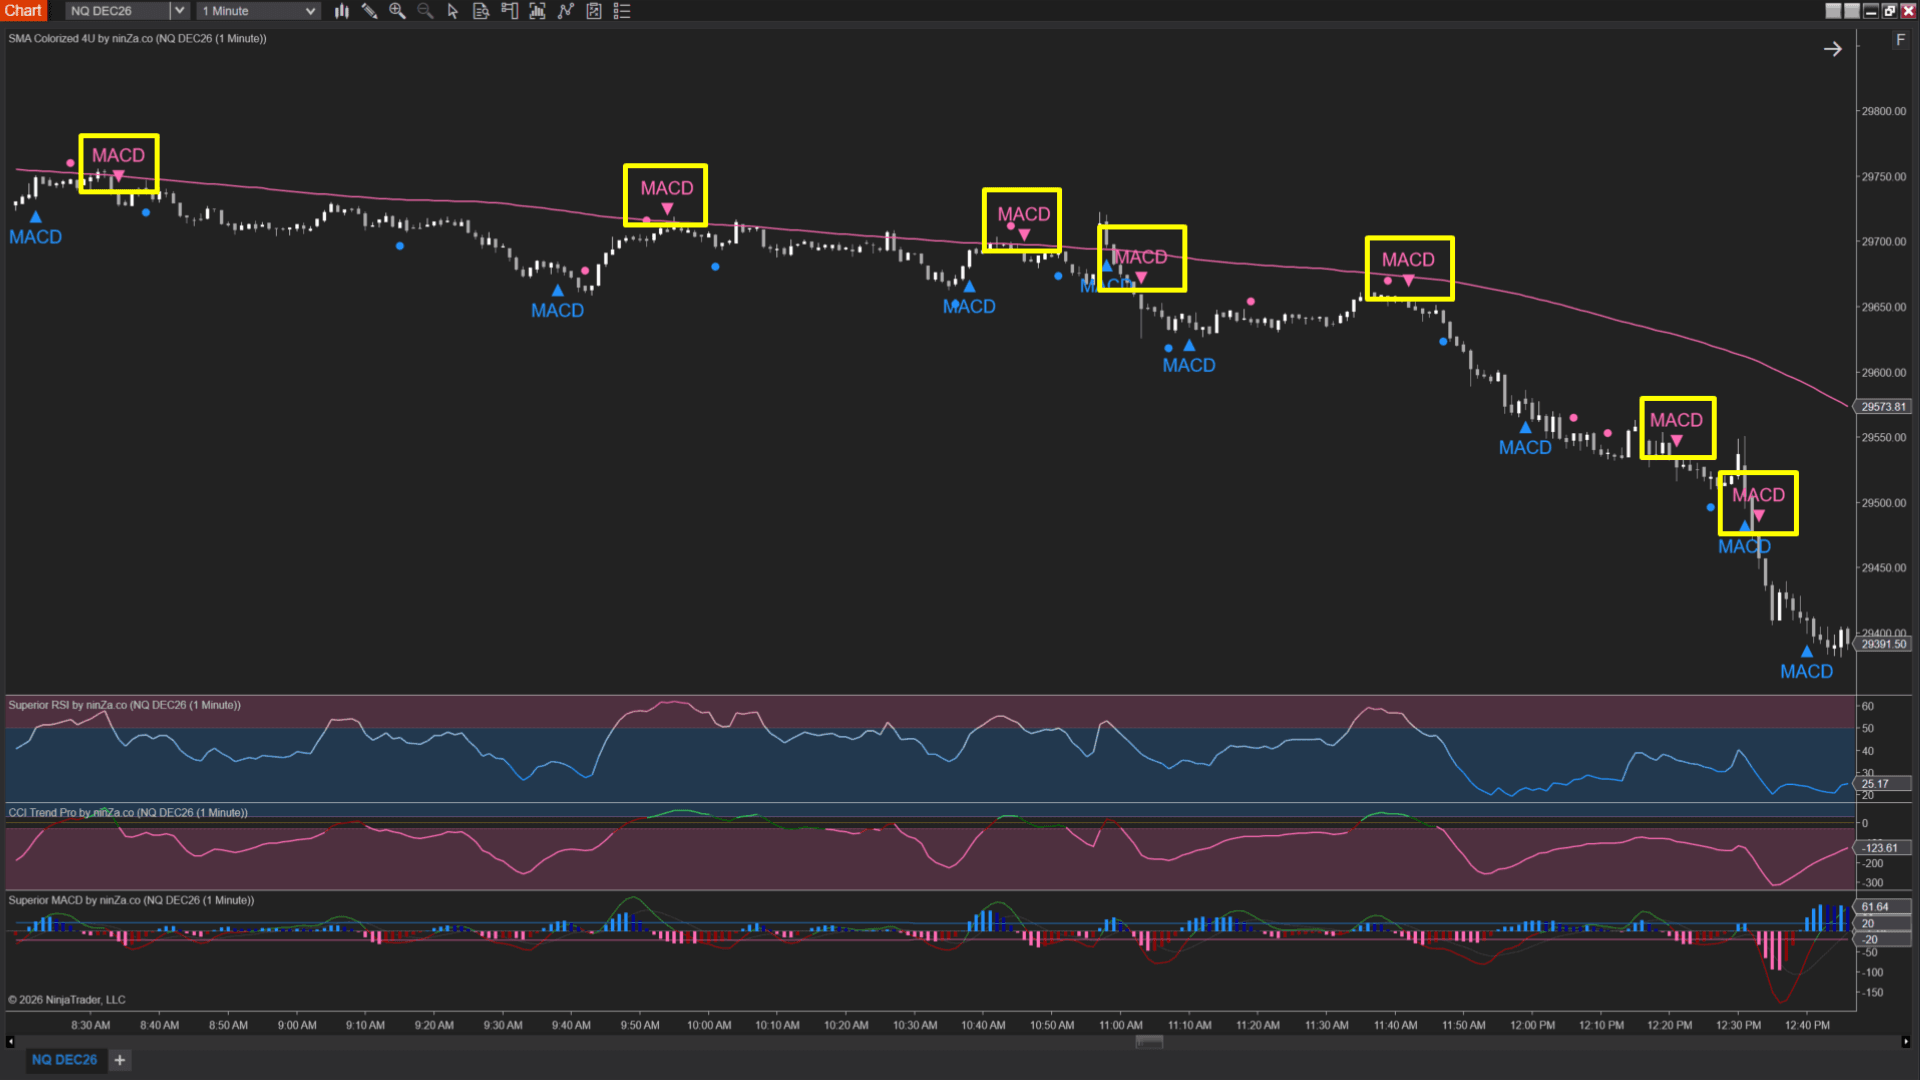
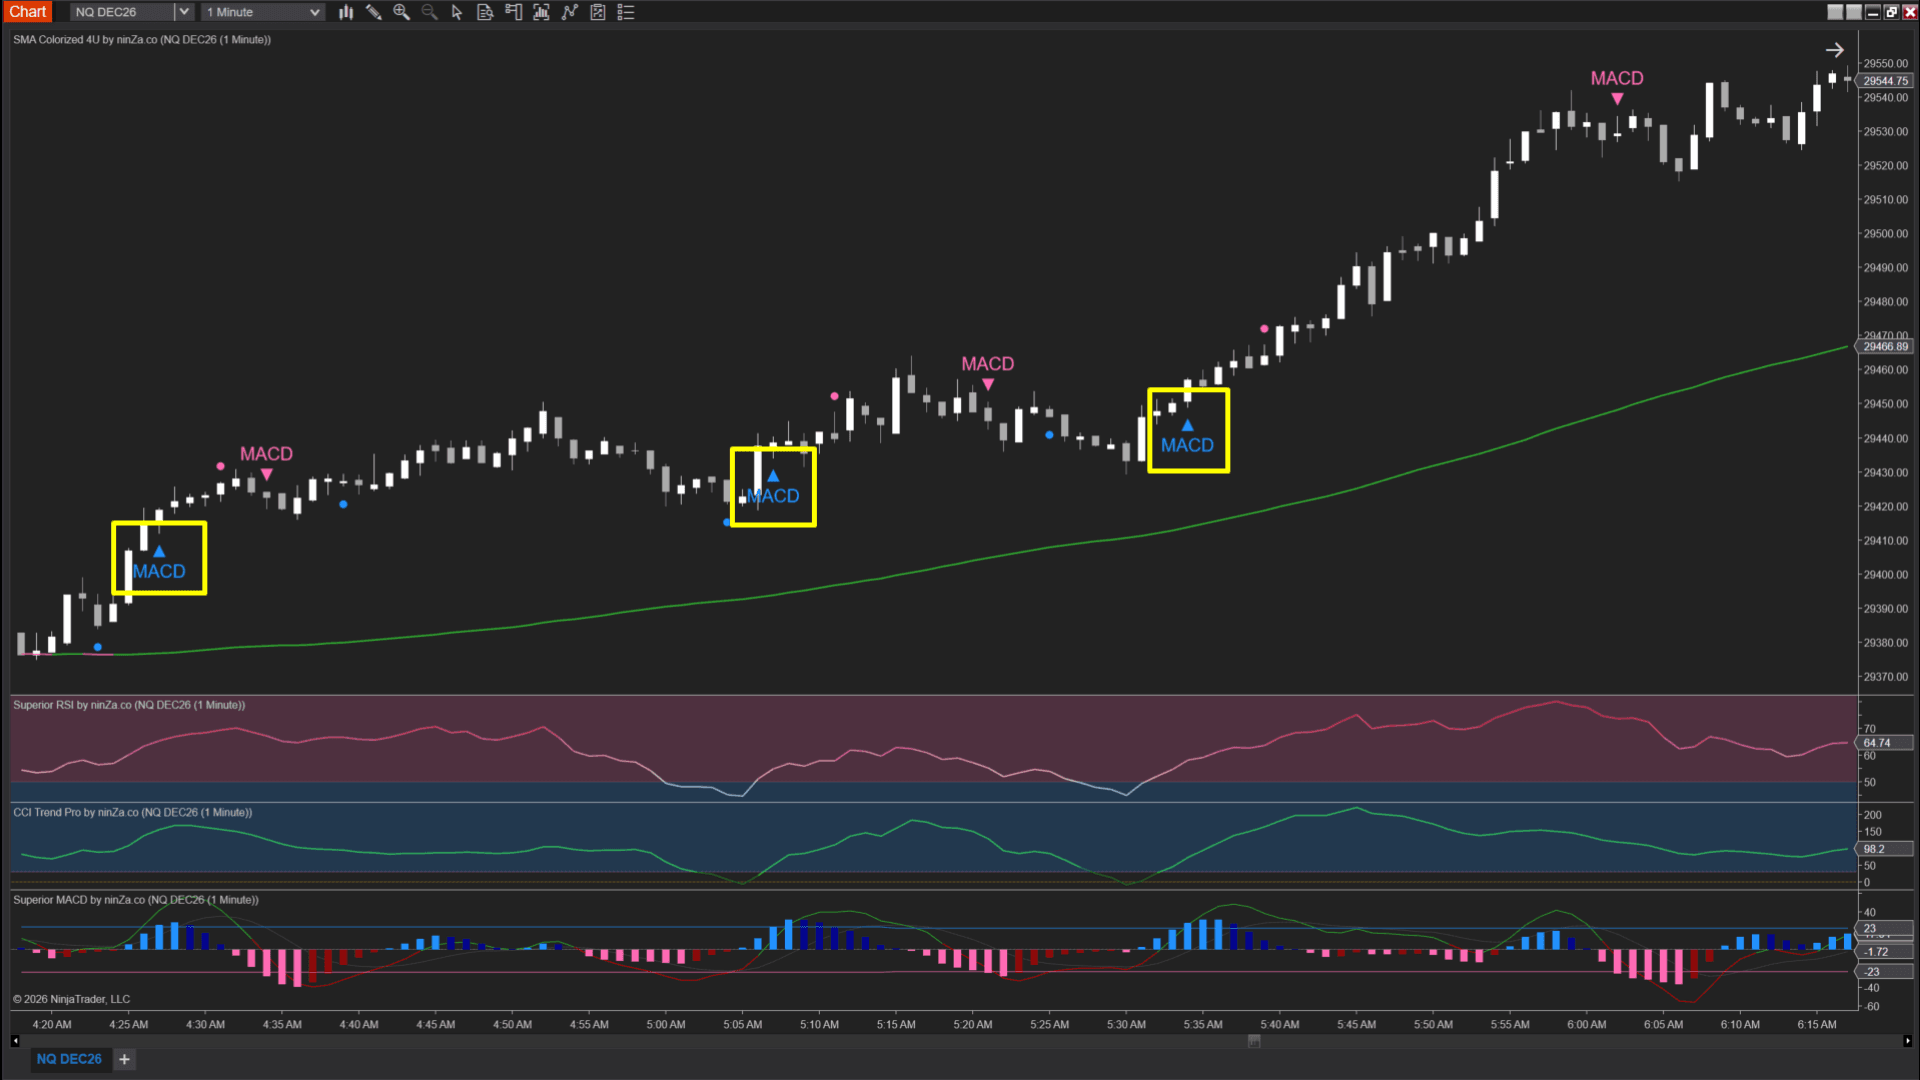
Trend direction illustration
What is the primary trend?
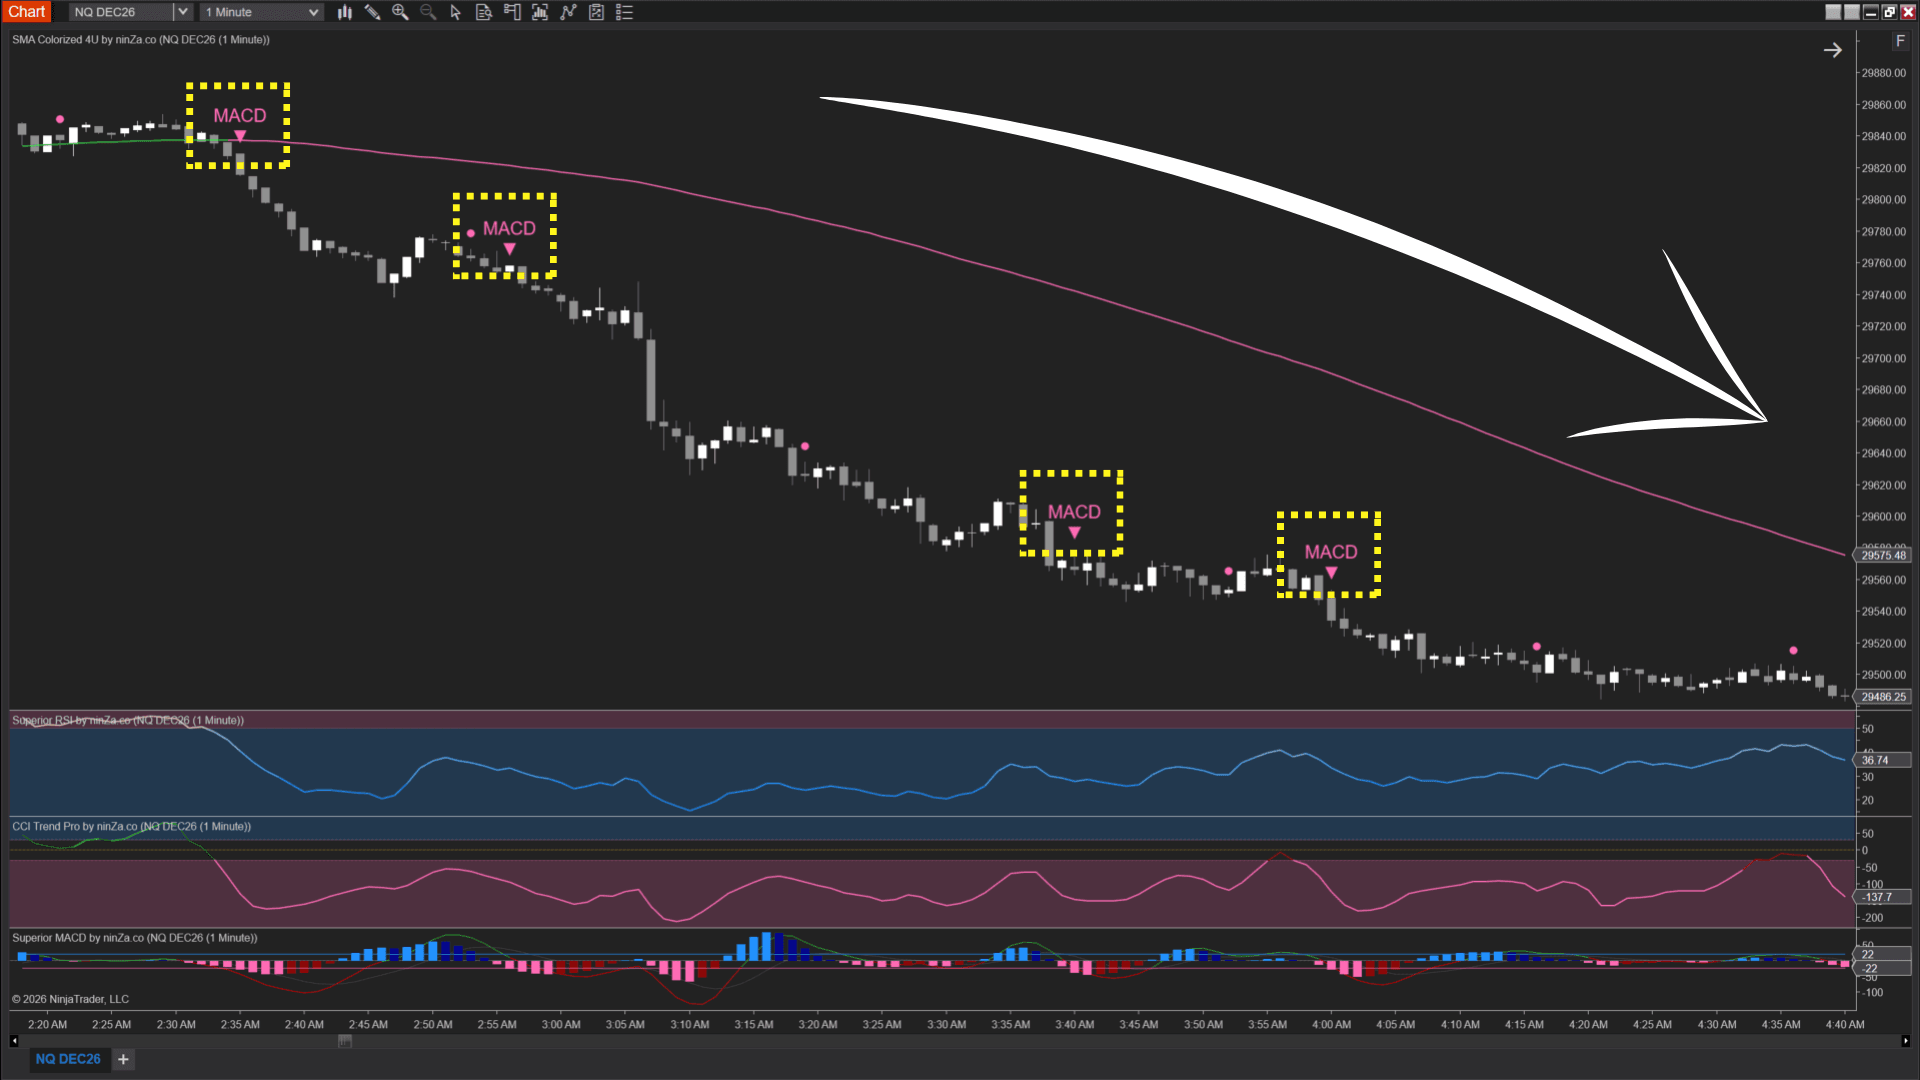
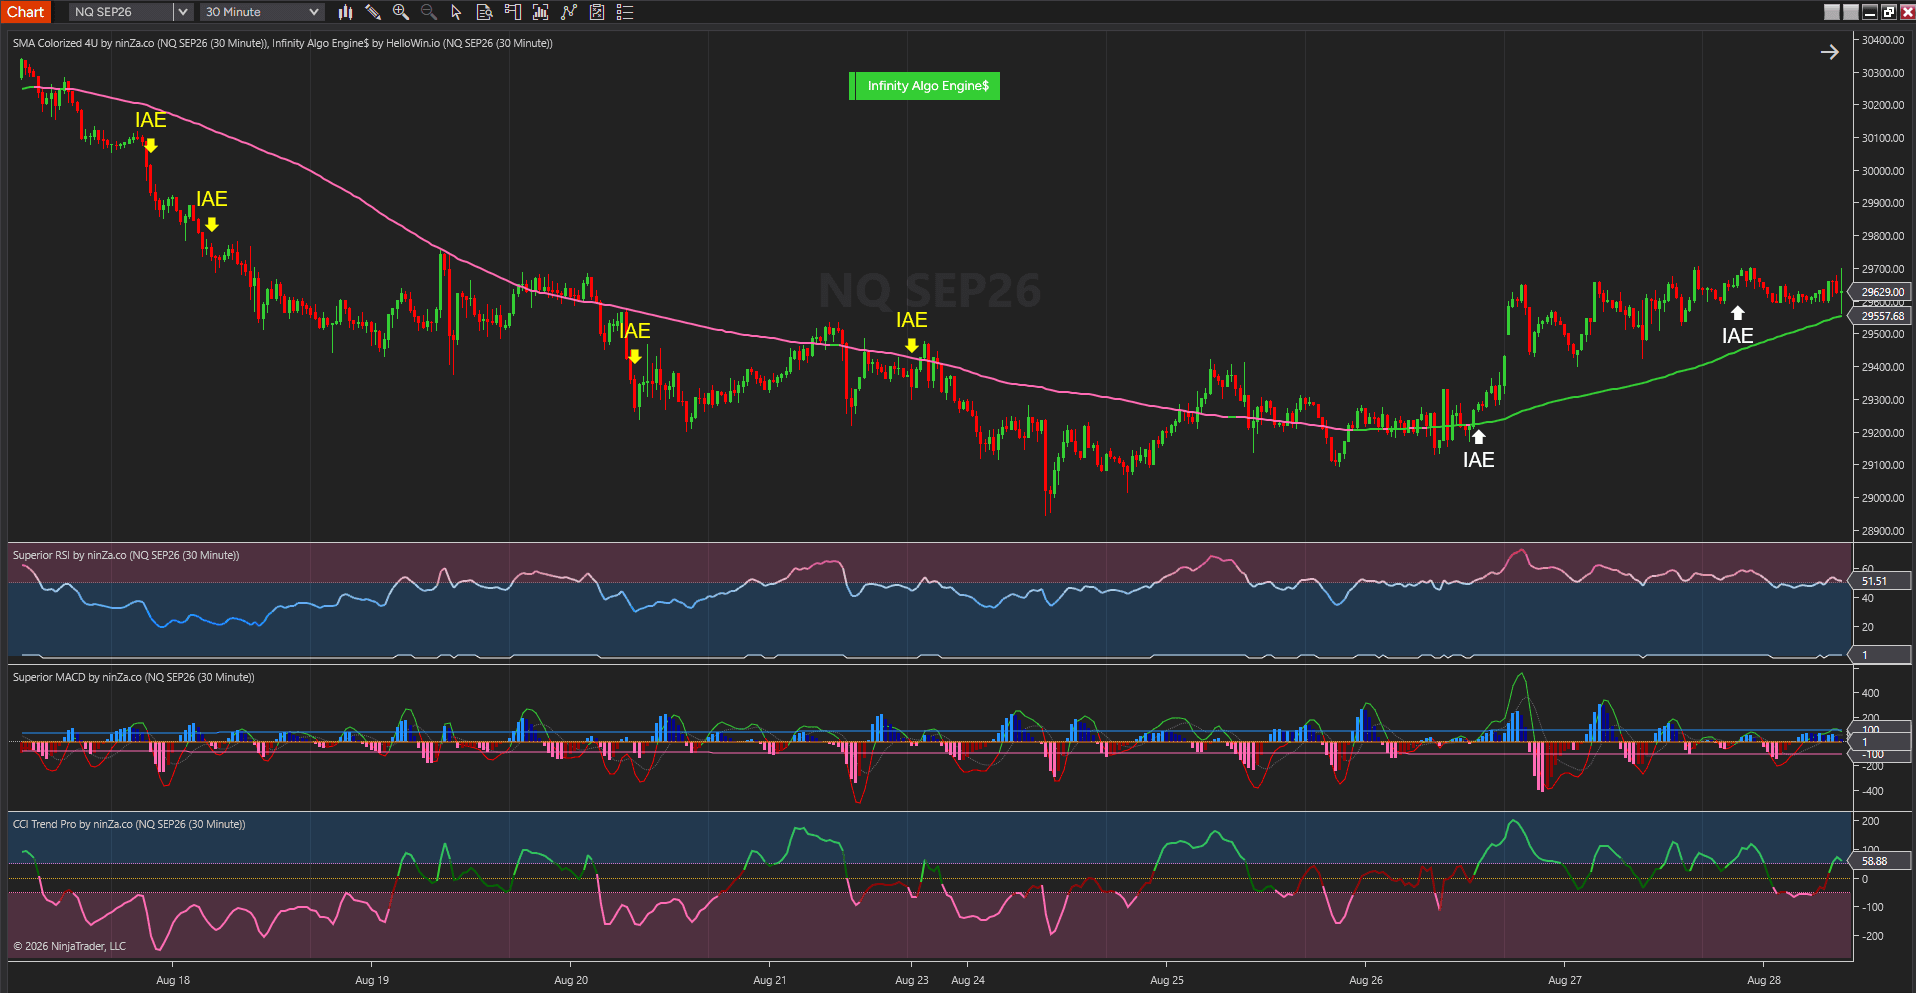
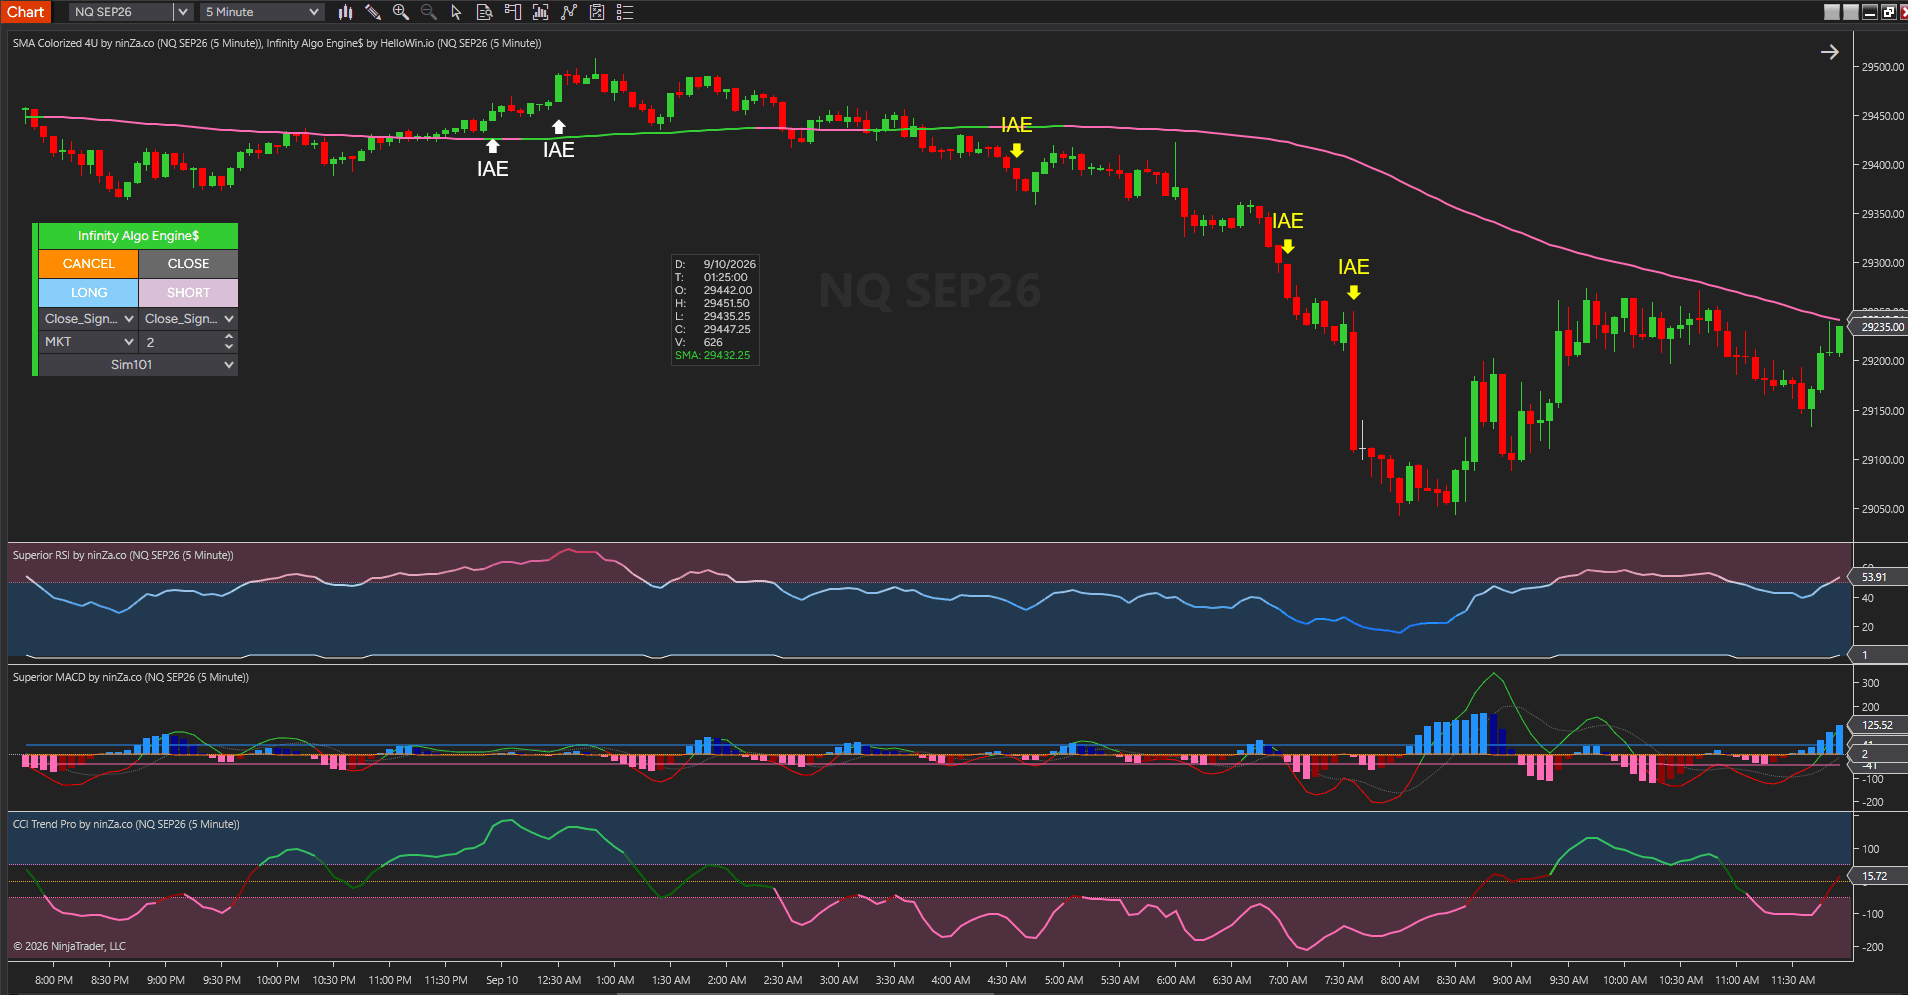
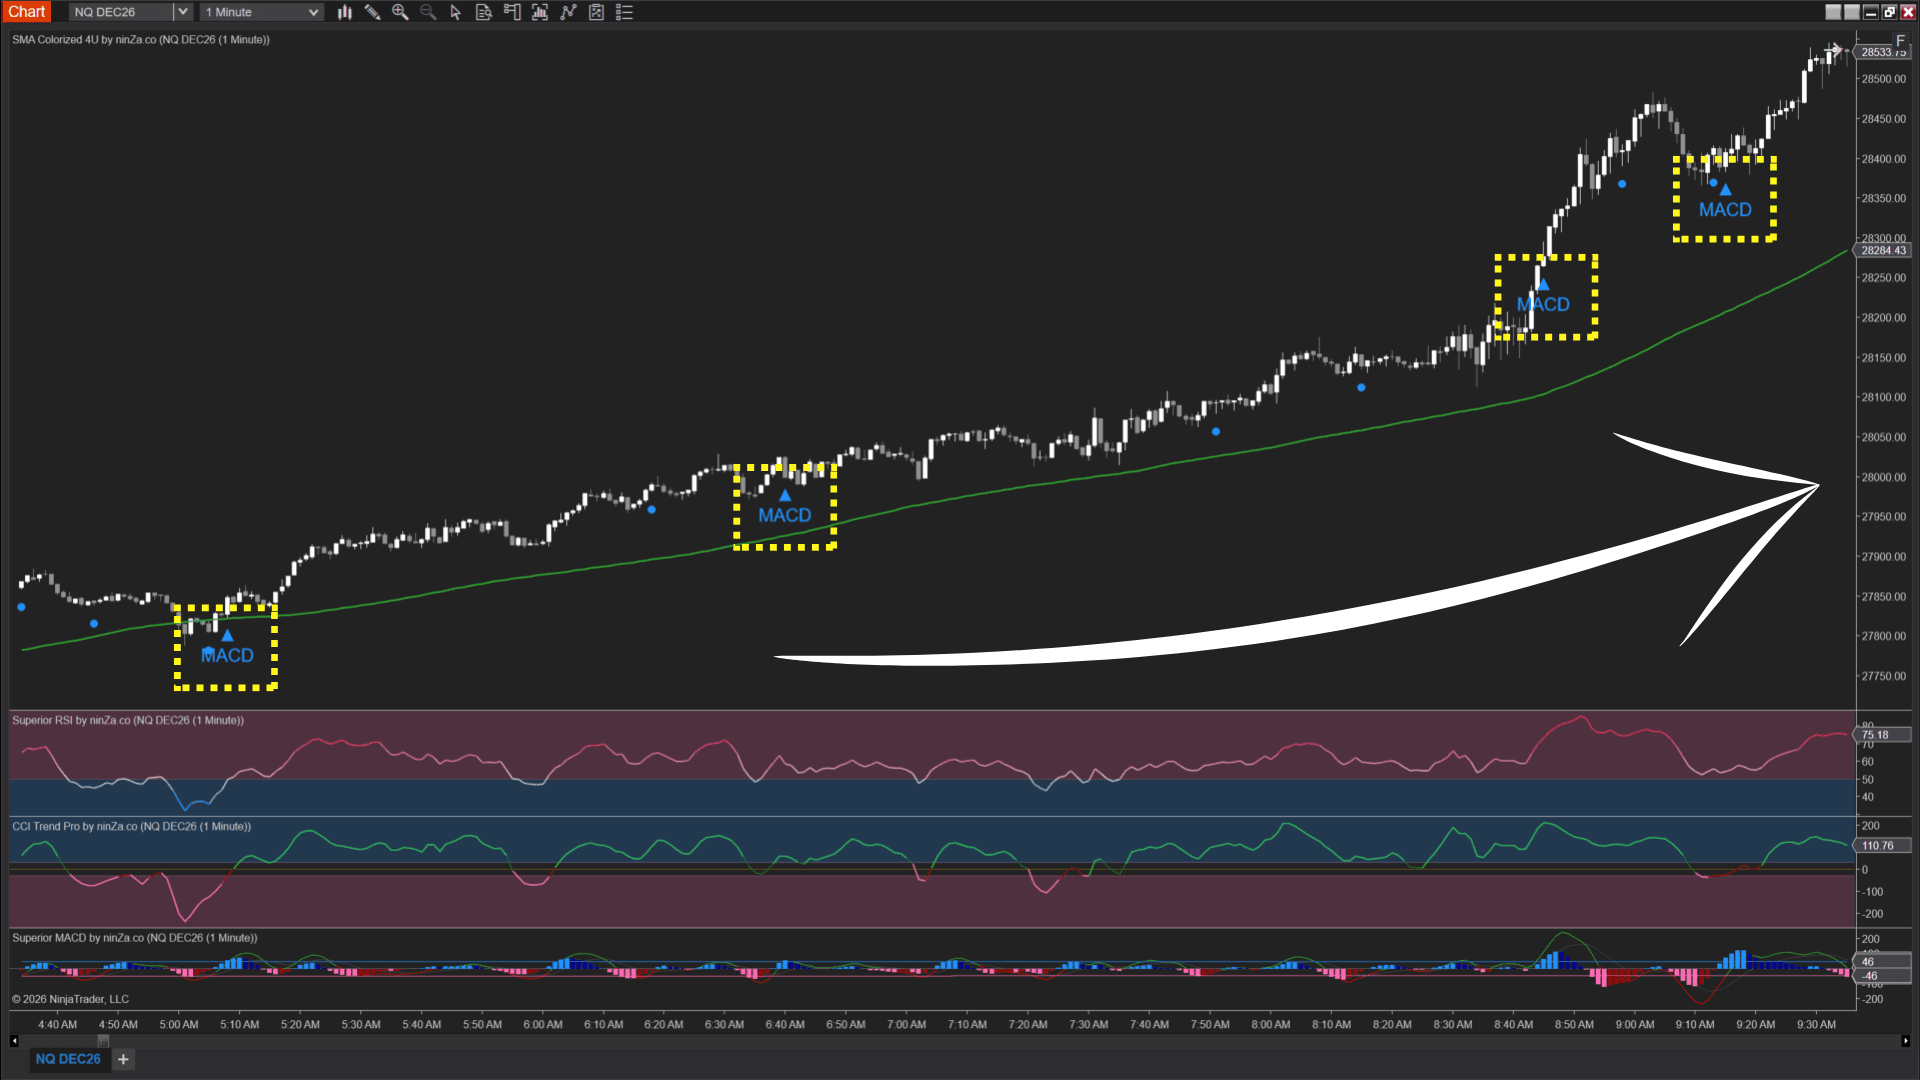
Momentum support illustration
Does momentum support that direction?
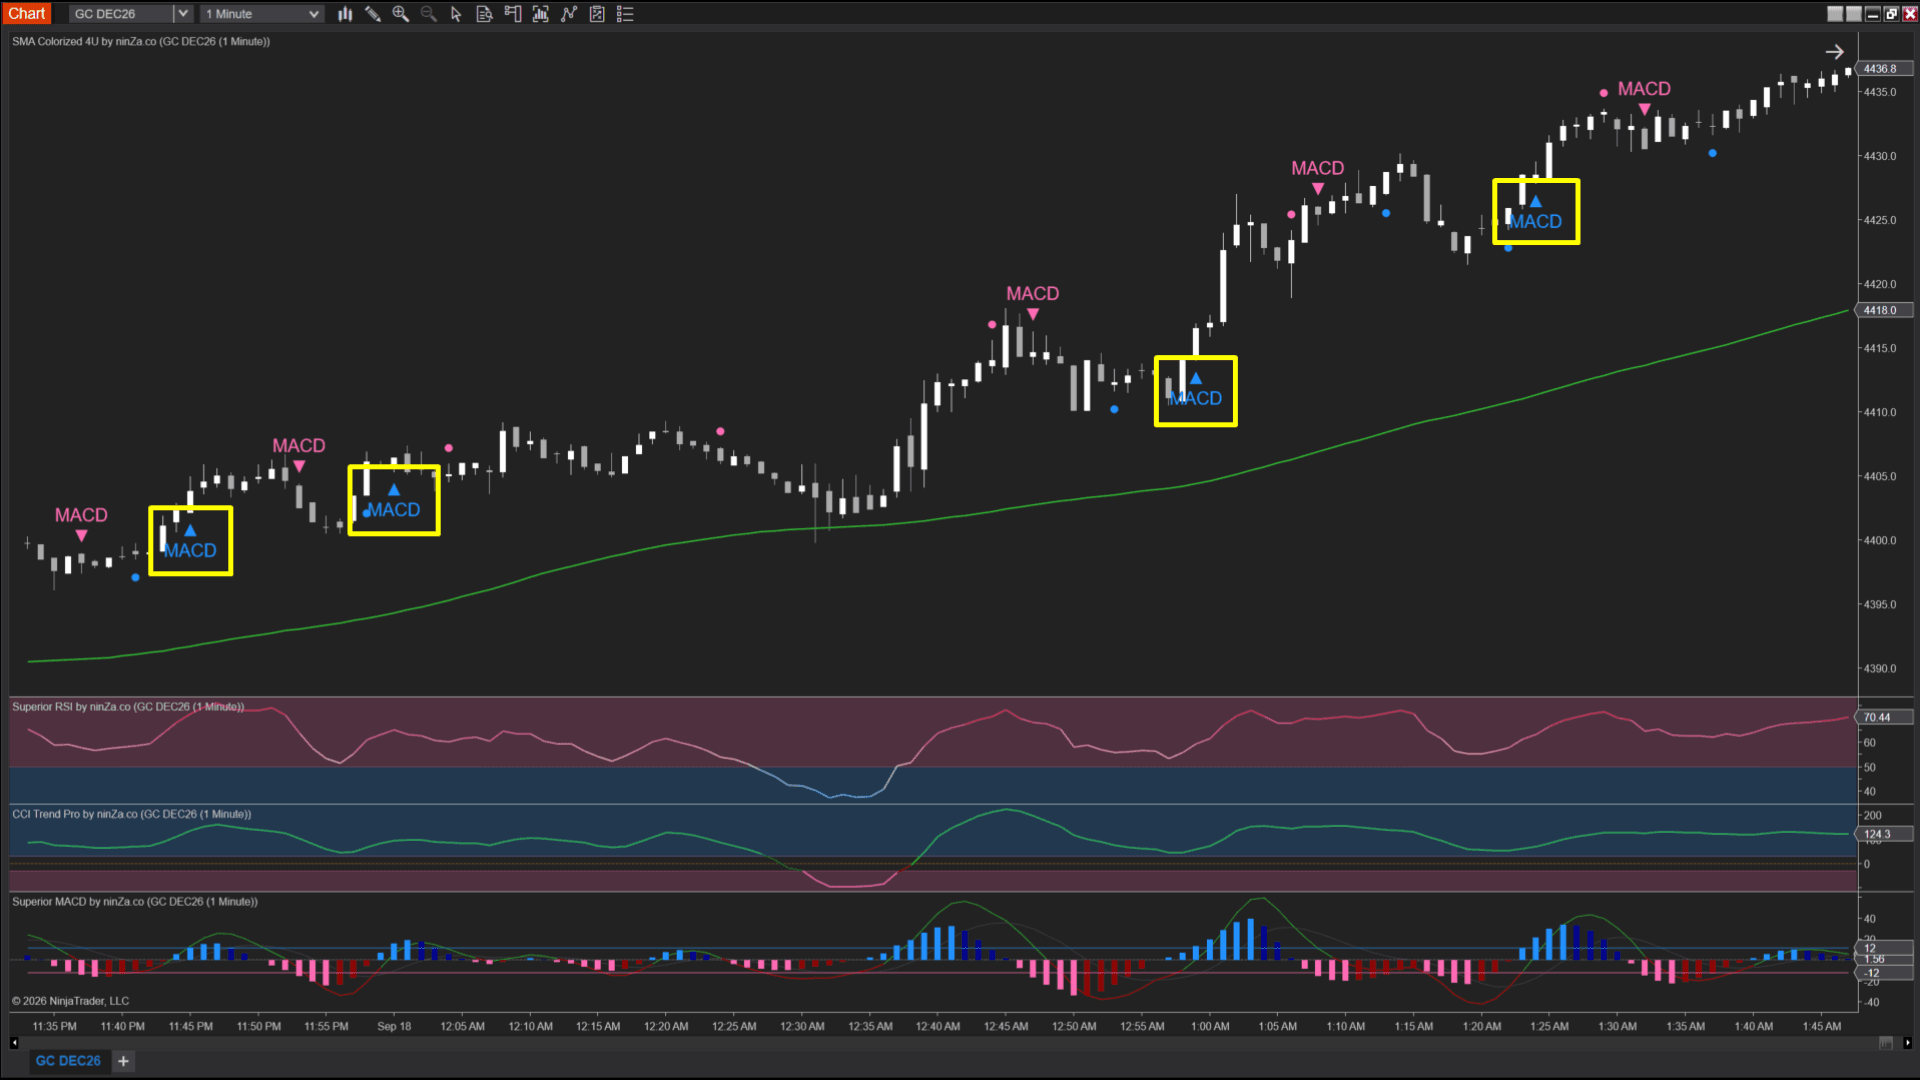
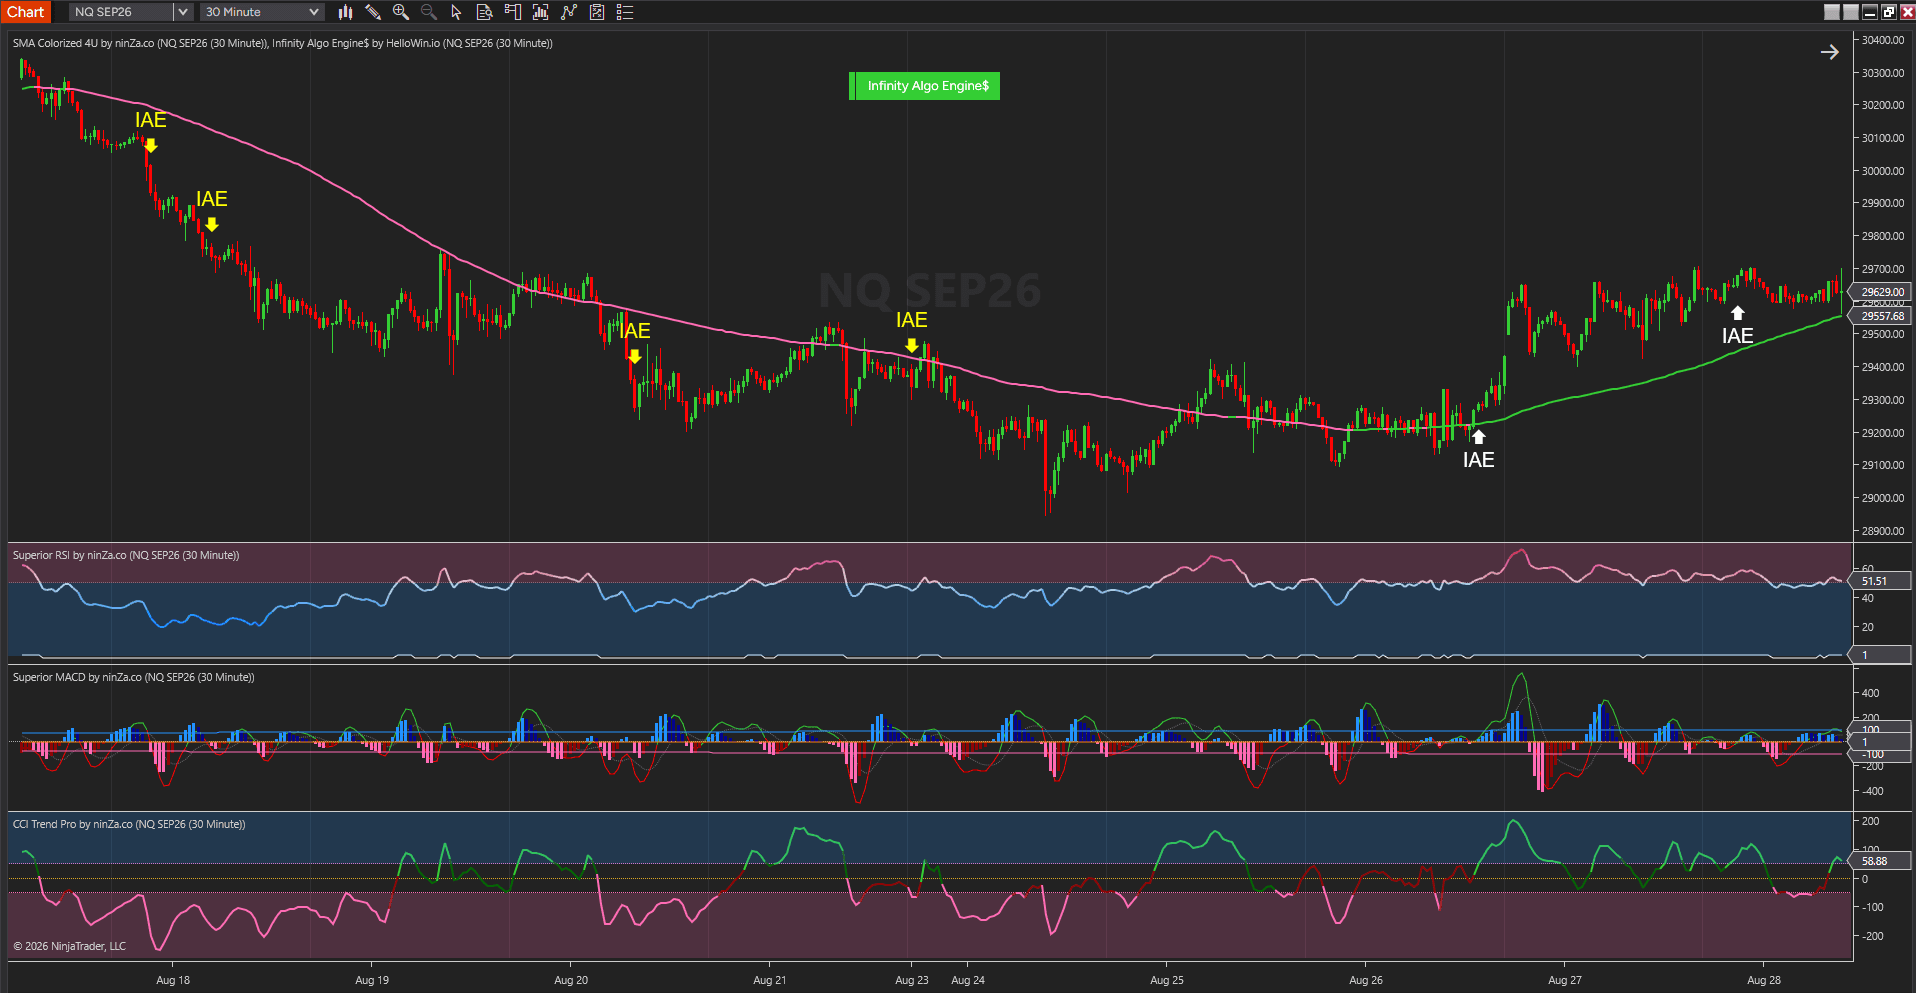
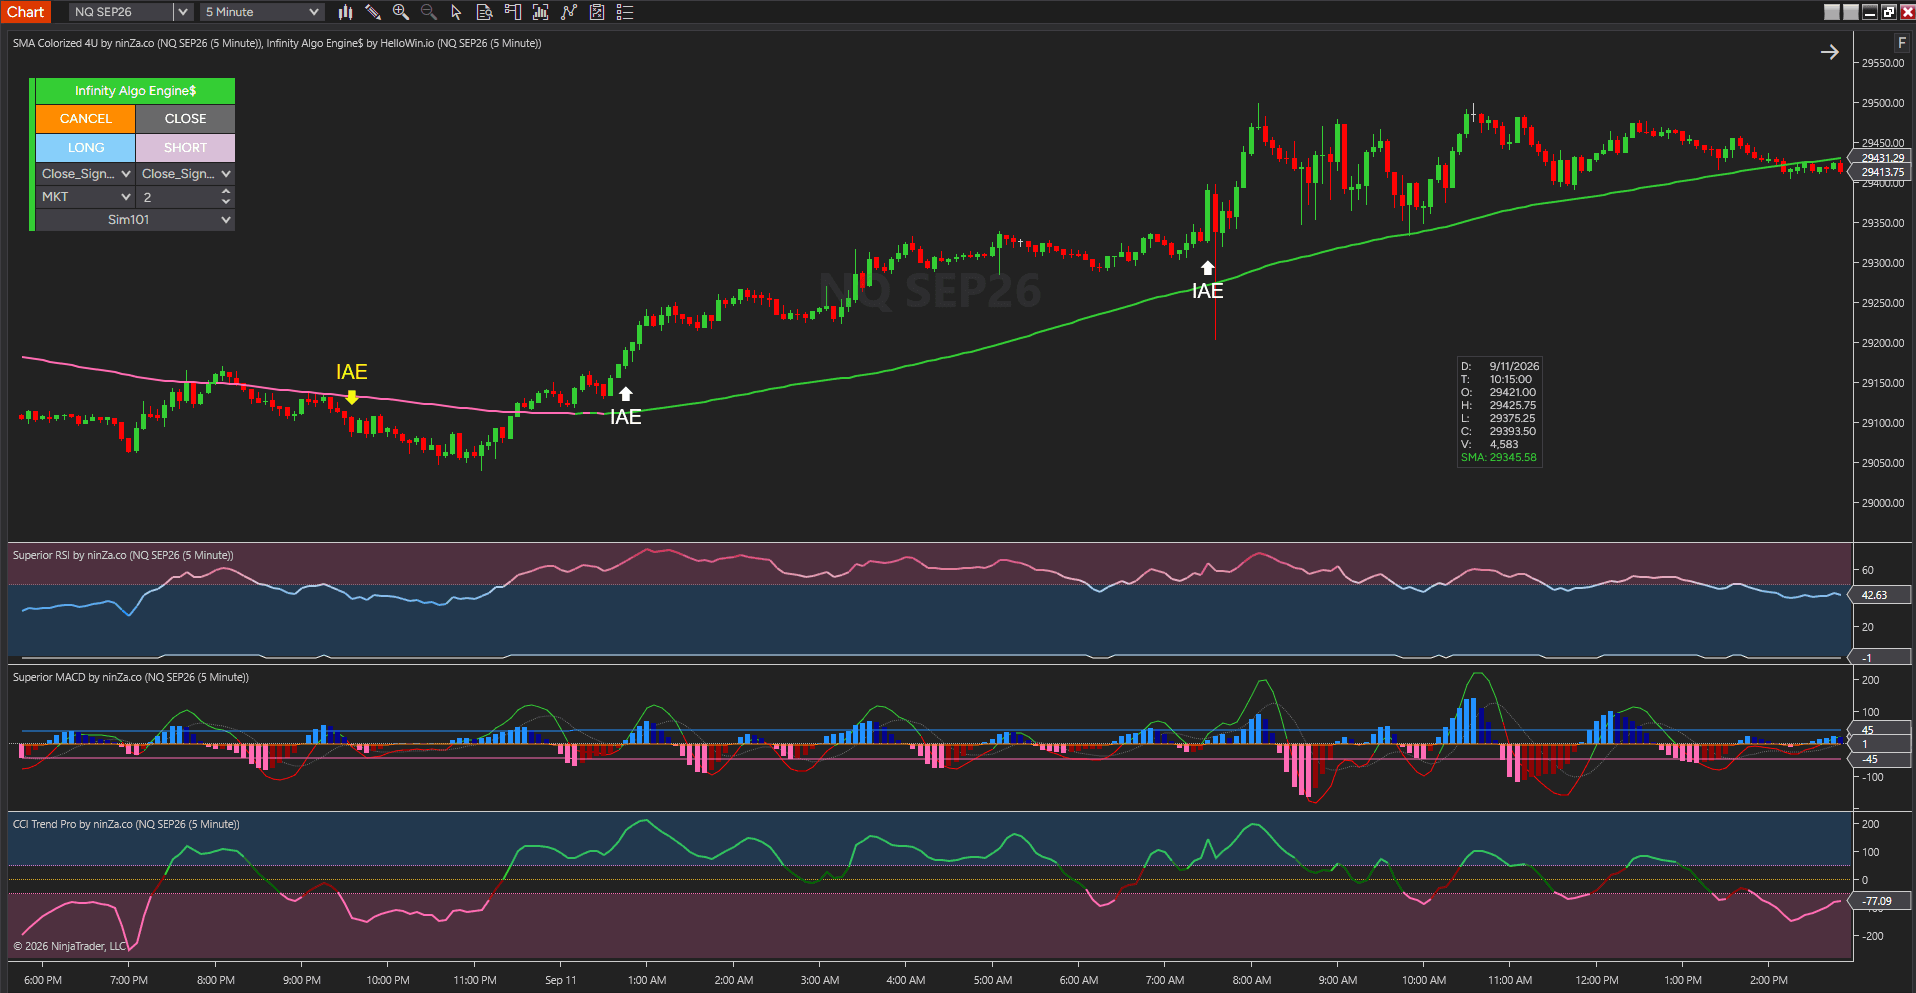
Momentum direction illustration
Is momentum moving with the trend?
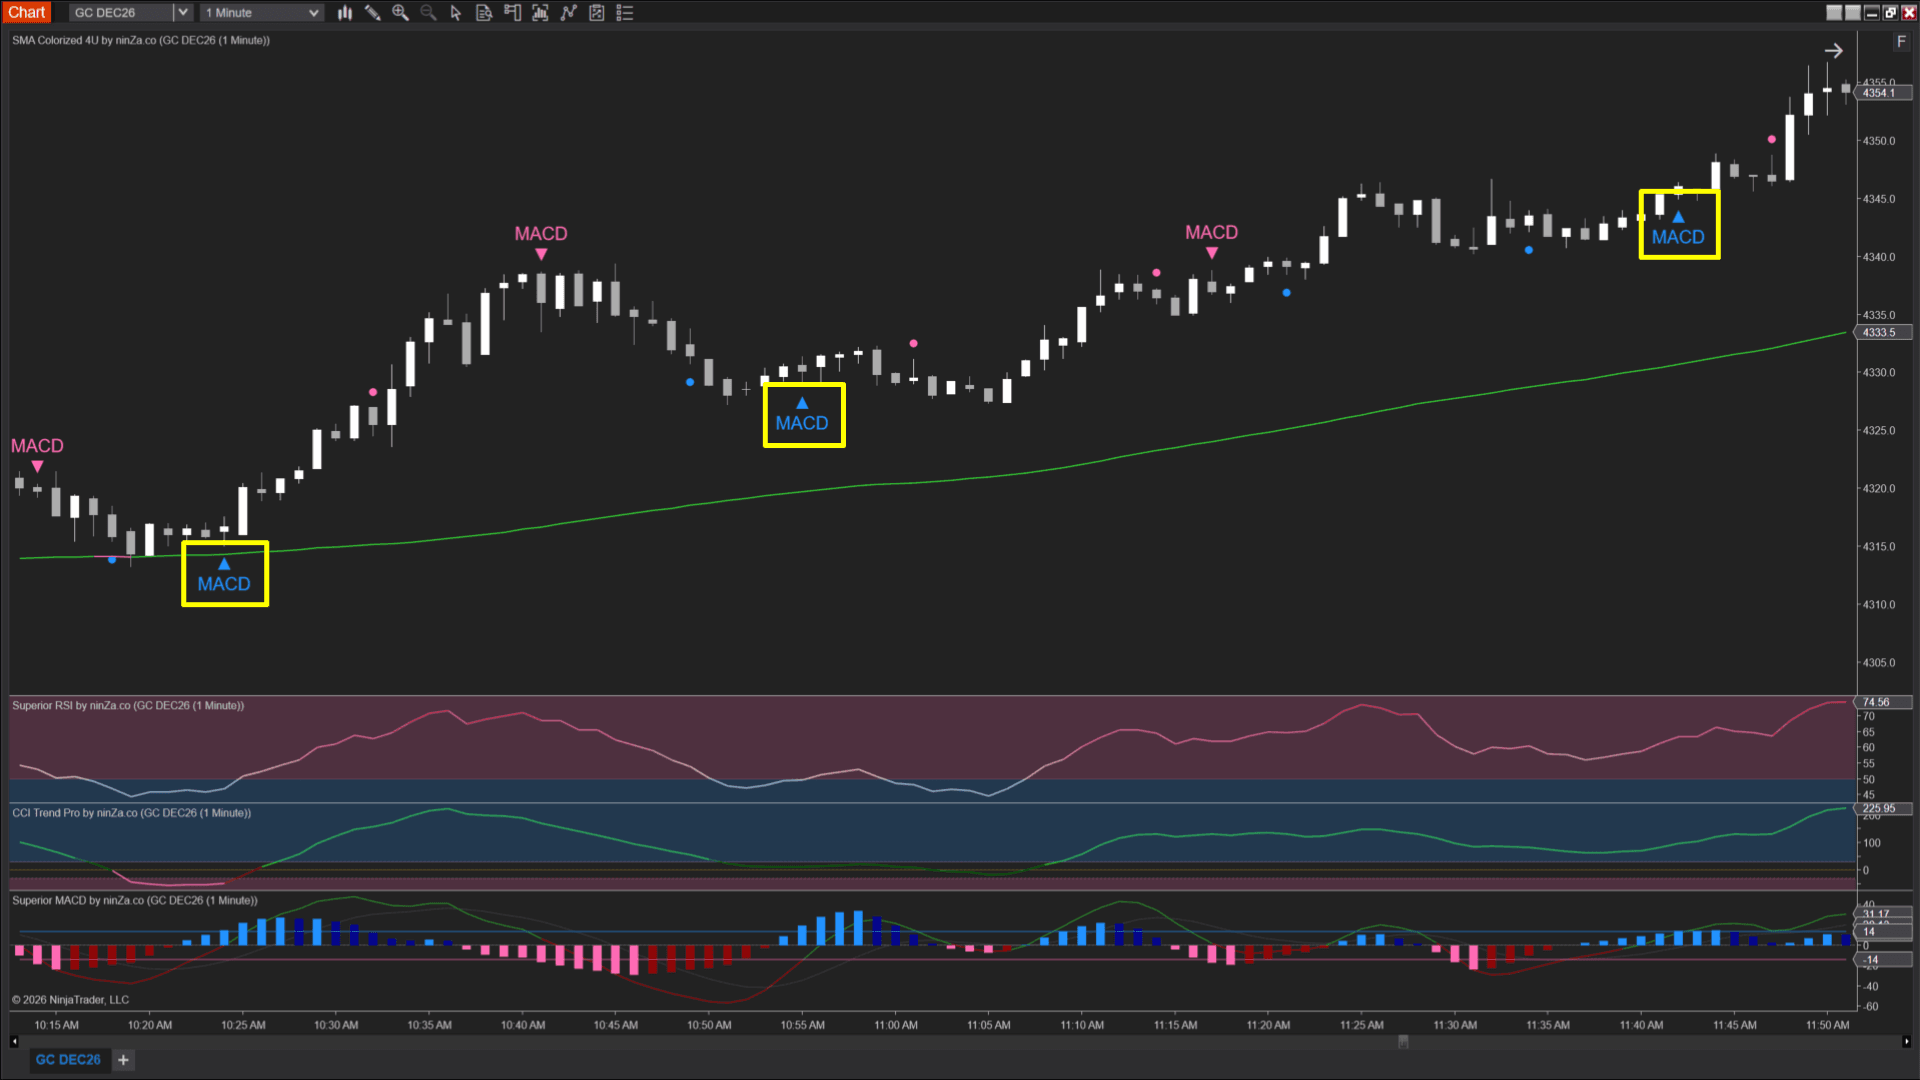
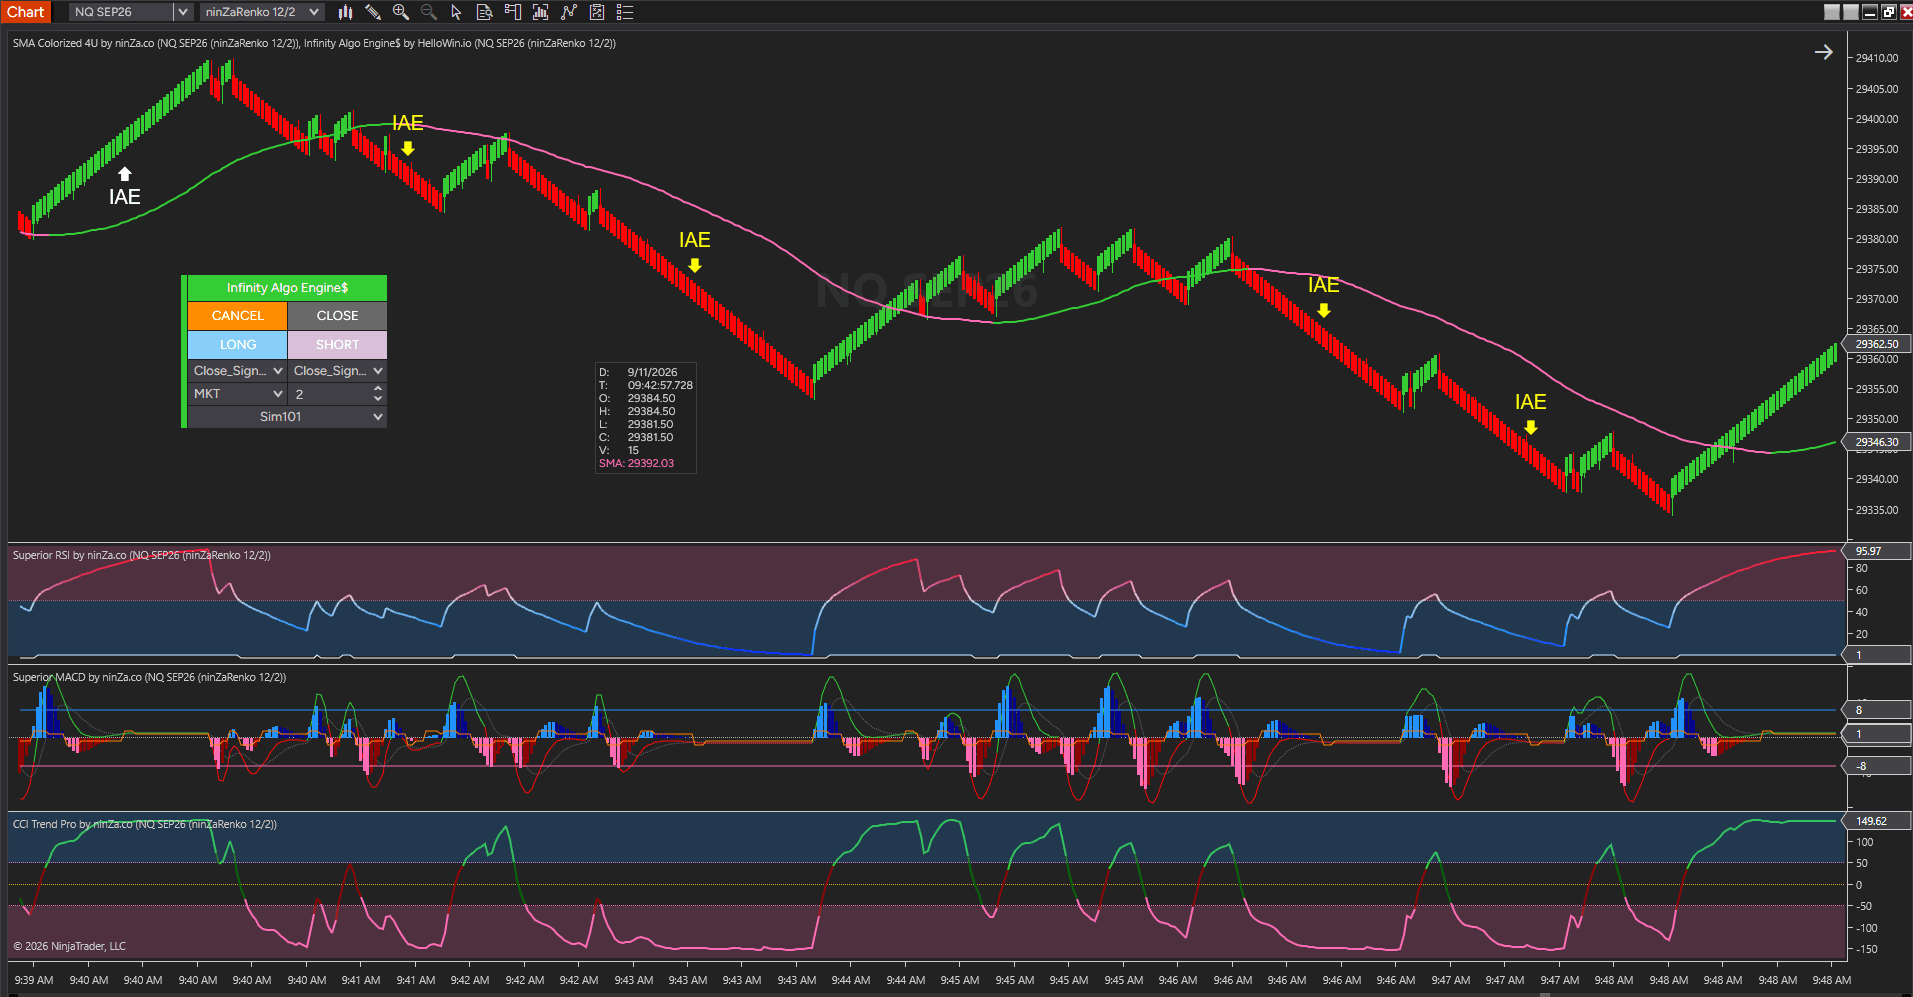
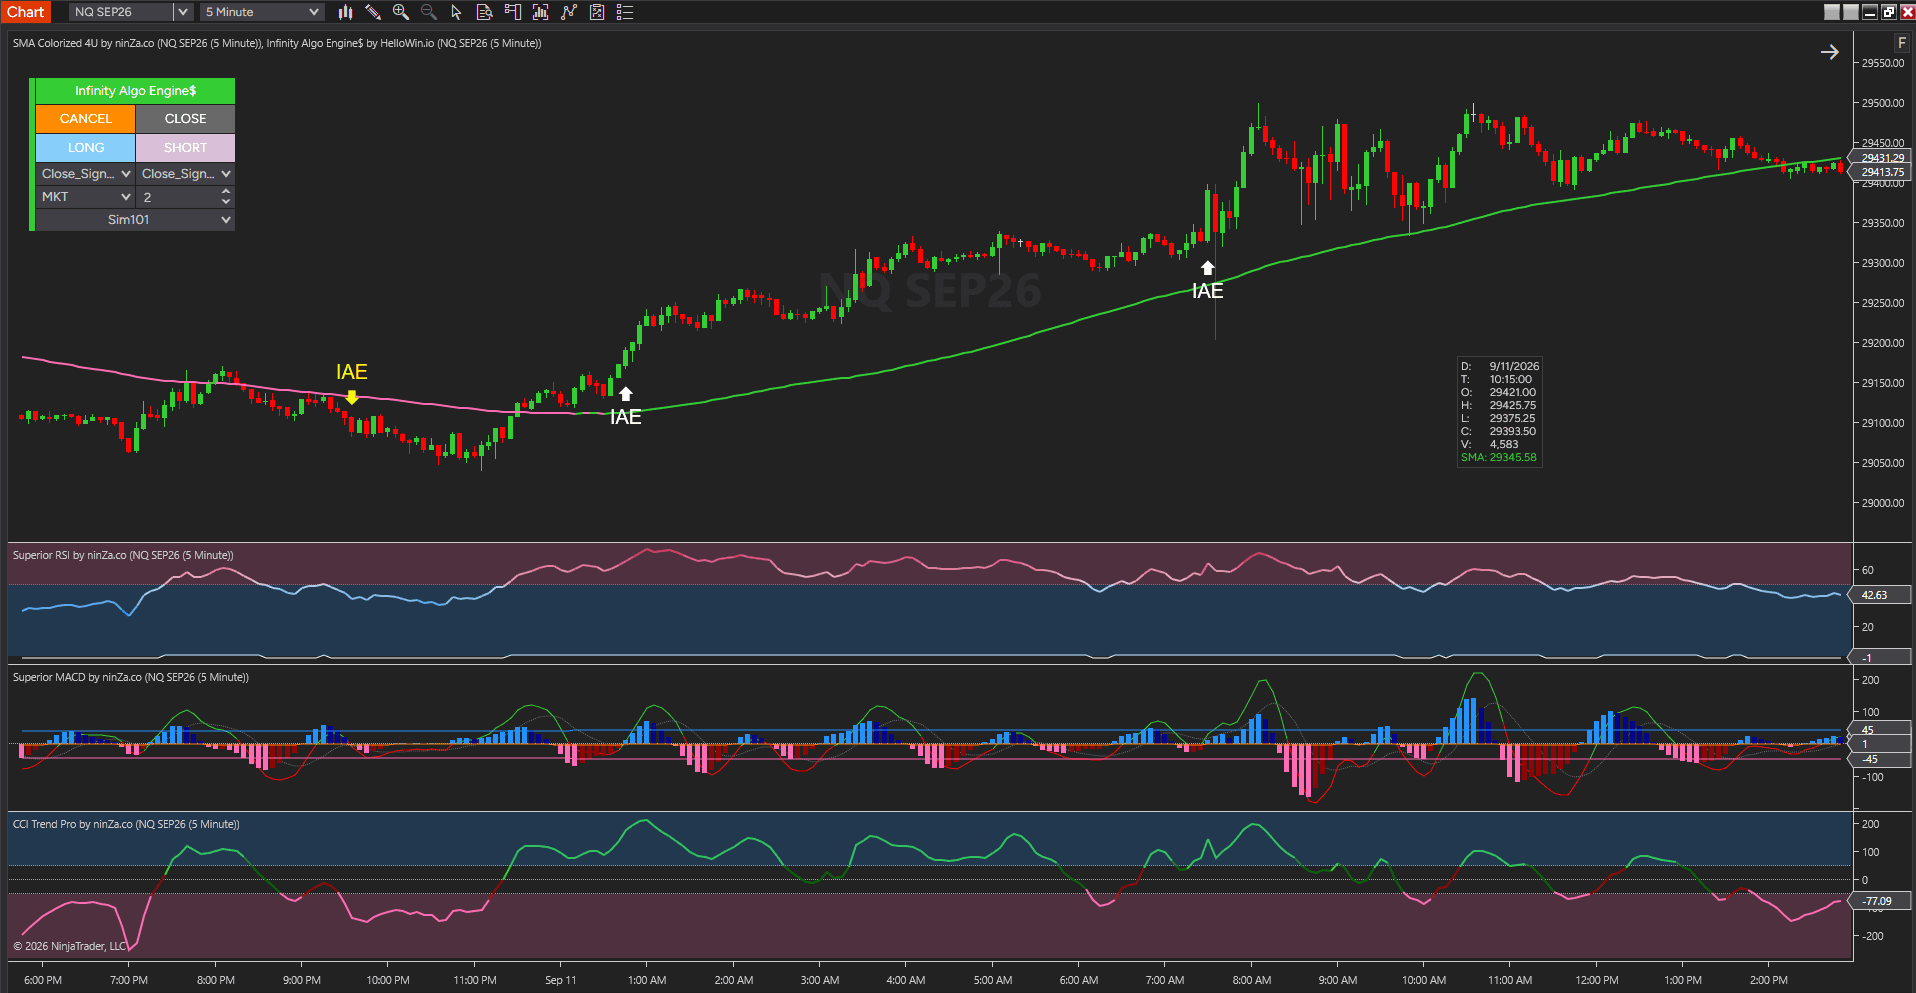
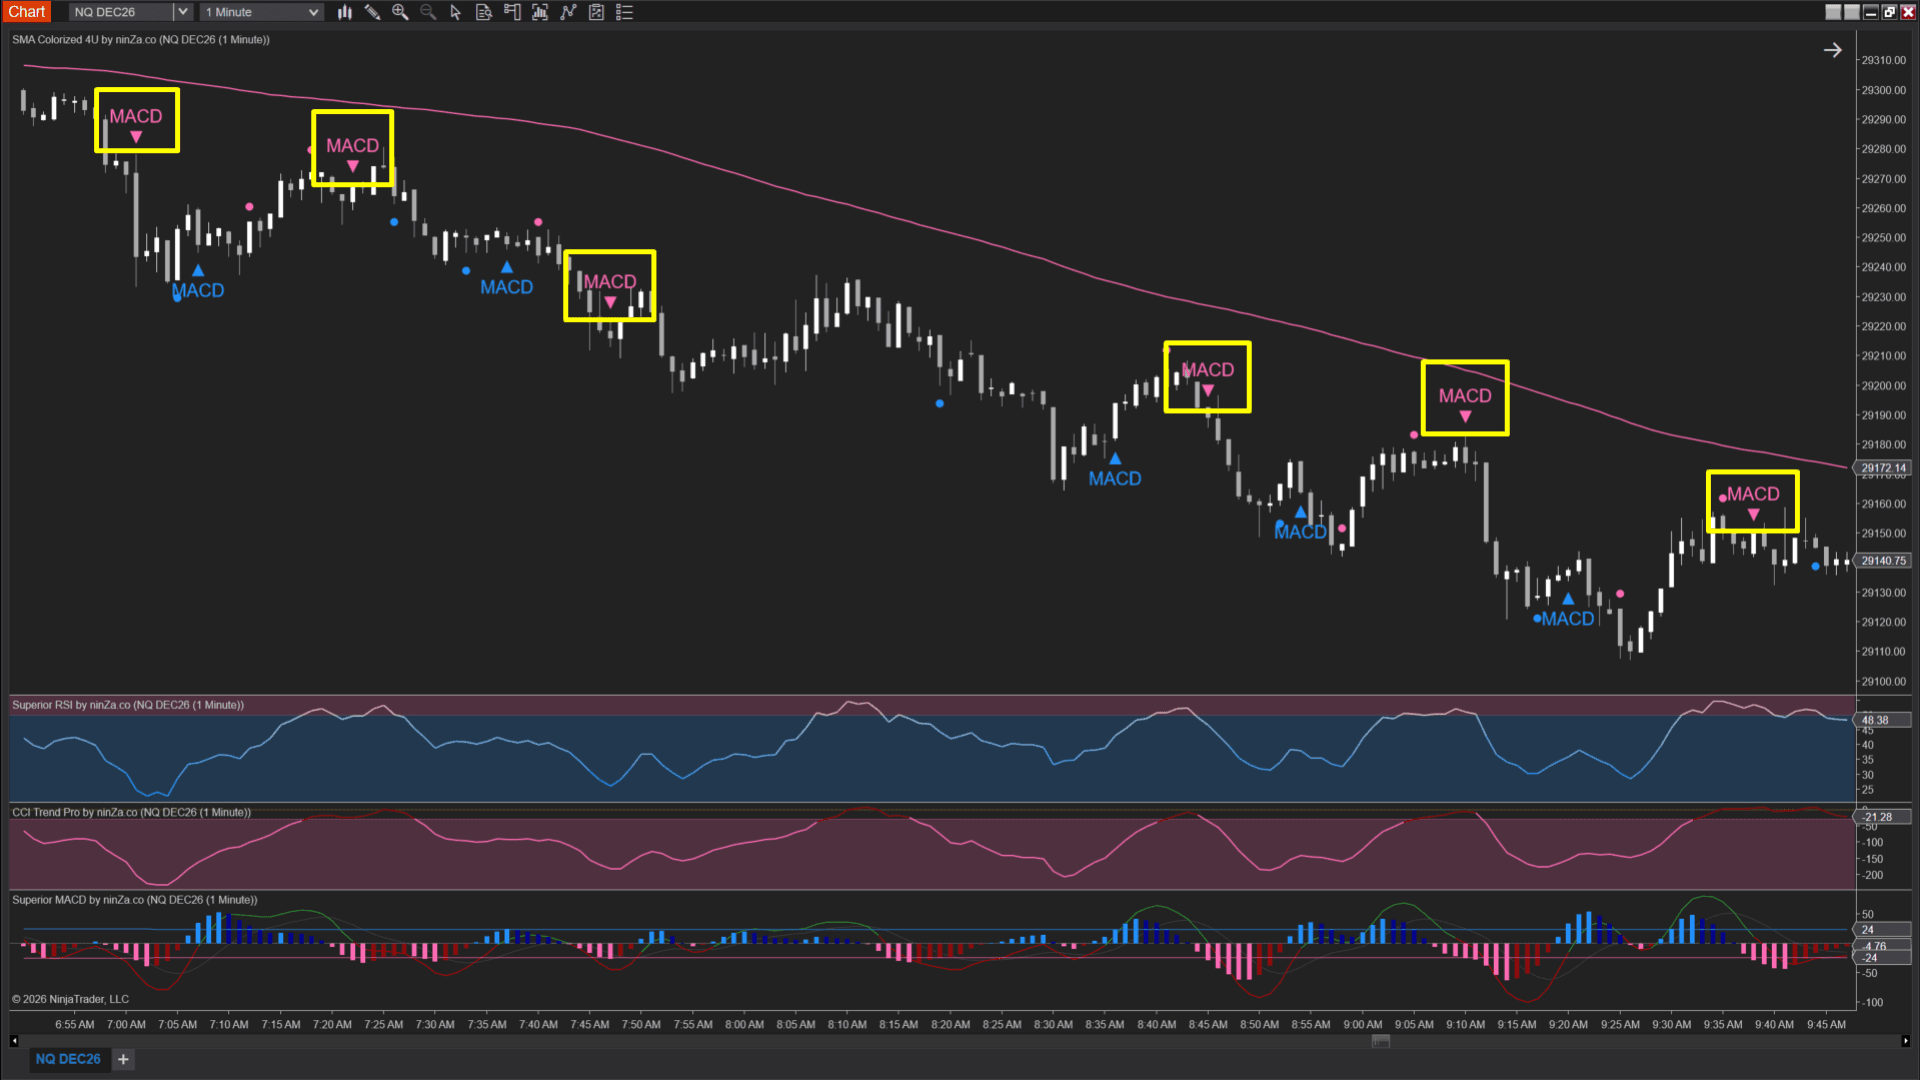
Entry trigger illustration
Has the entry trigger actually fired?

The FELIX2 process

A 4-part trend-following framework

Each stage answers a different question before the framework moves to the next.

01

Establish trend direction

A moving-average-based trend filter establishes the primary directional bias before an entry is considered.

Direction comes first. Shorter-term momentum changes are evaluated within that broader context.

02

Assess momentum strength

RSI provides a separate read of momentum strength.

This helps determine whether current momentum supports the direction already established by the trend filter.

03

Confirm momentum direction

CCI adds another layer of directional momentum analysis.

Rather than relying on 1 momentum measure, FELIX2 looks for additional alignment before moving to the entry stage.

04

Wait for the entry trigger

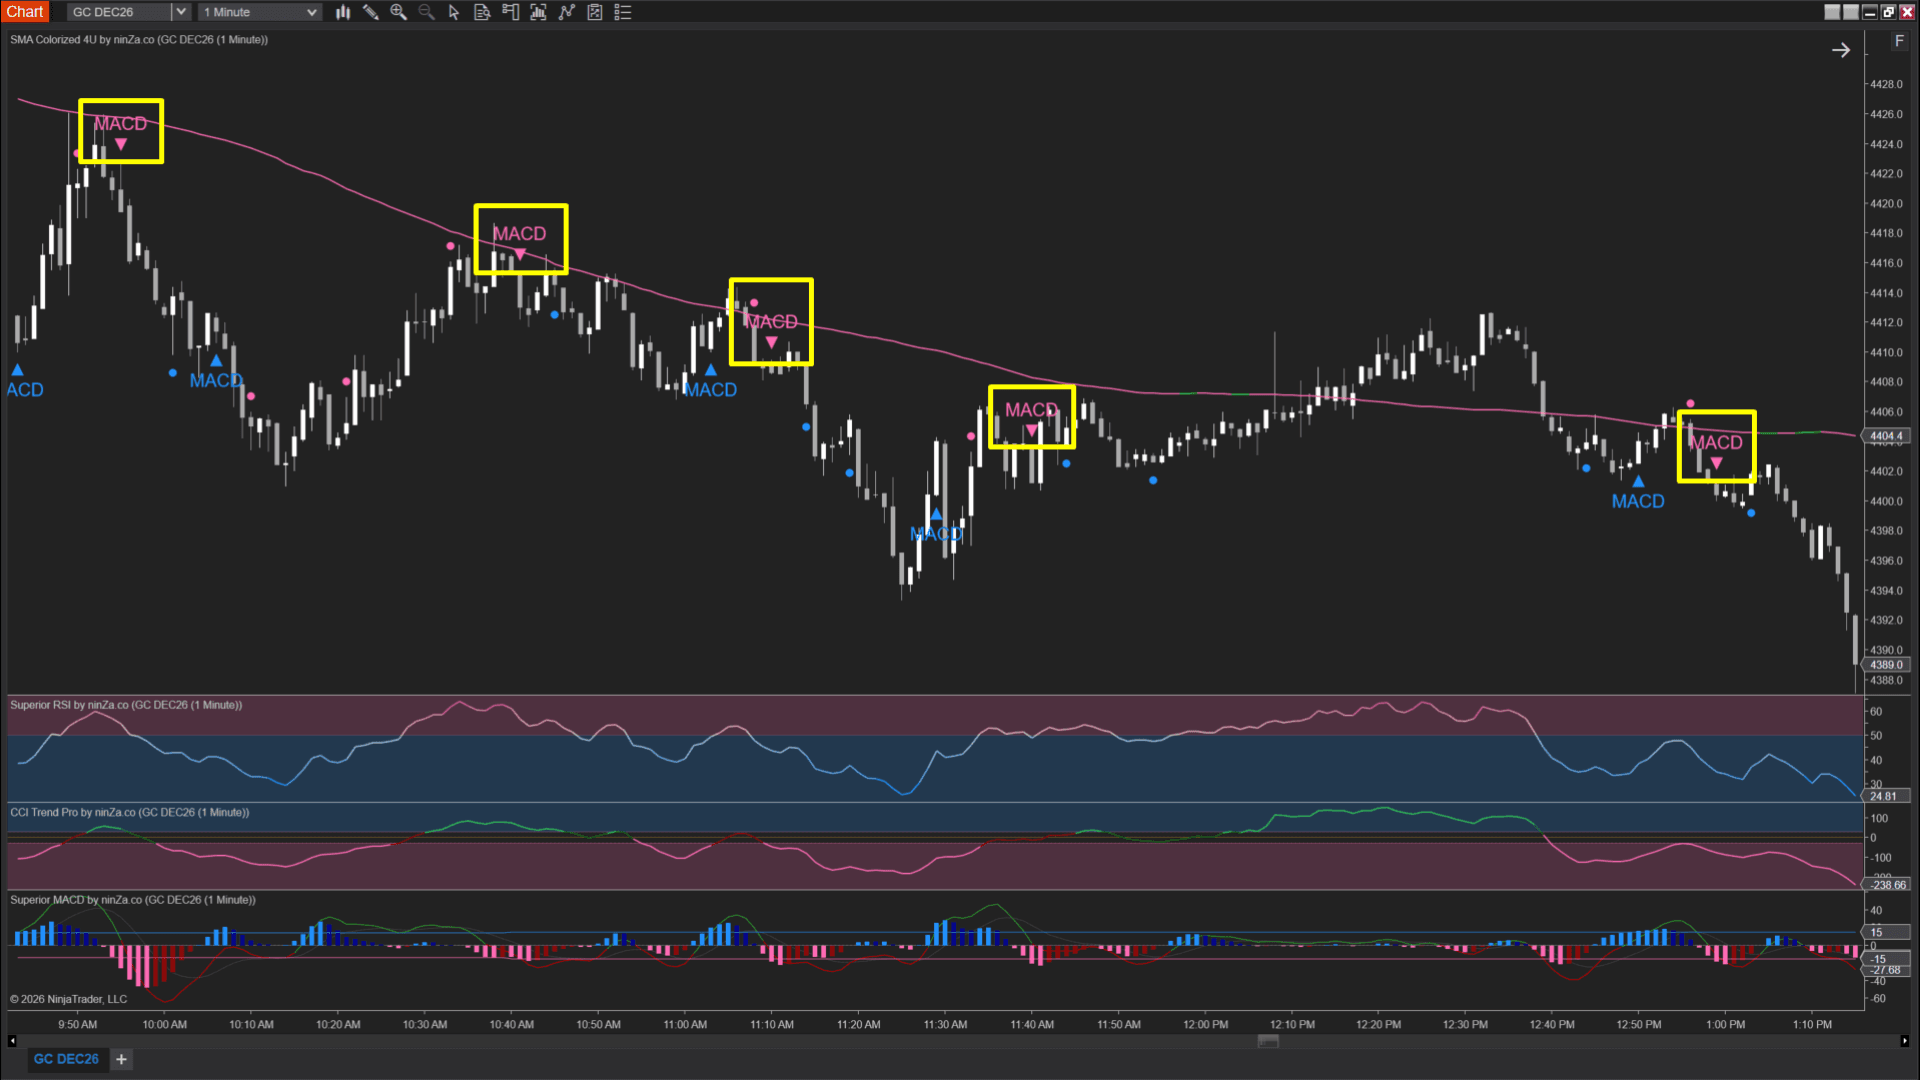
MACD handles the final step: timing.

Only after the preceding conditions are aligned does the framework look for the trigger that allows an entry.

No single indicator creates the trade. Each component answers a different question within the same process.

The components

The 4 indicators behind FELIX2

The value of the bundle is not simply having 4 indicators on the same chart. Each one contributes a different type of market information to the framework.

Trend direction 

SMA Colorized 4U

A colorized SMA that makes changes in moving-average direction easier to recognize at a glance.

Within FELIX2, it supports the trend-direction layer of the framework.

banner-image
banner-image
banner-image
banner-image
banner-image
banner-image

Momentum strength 

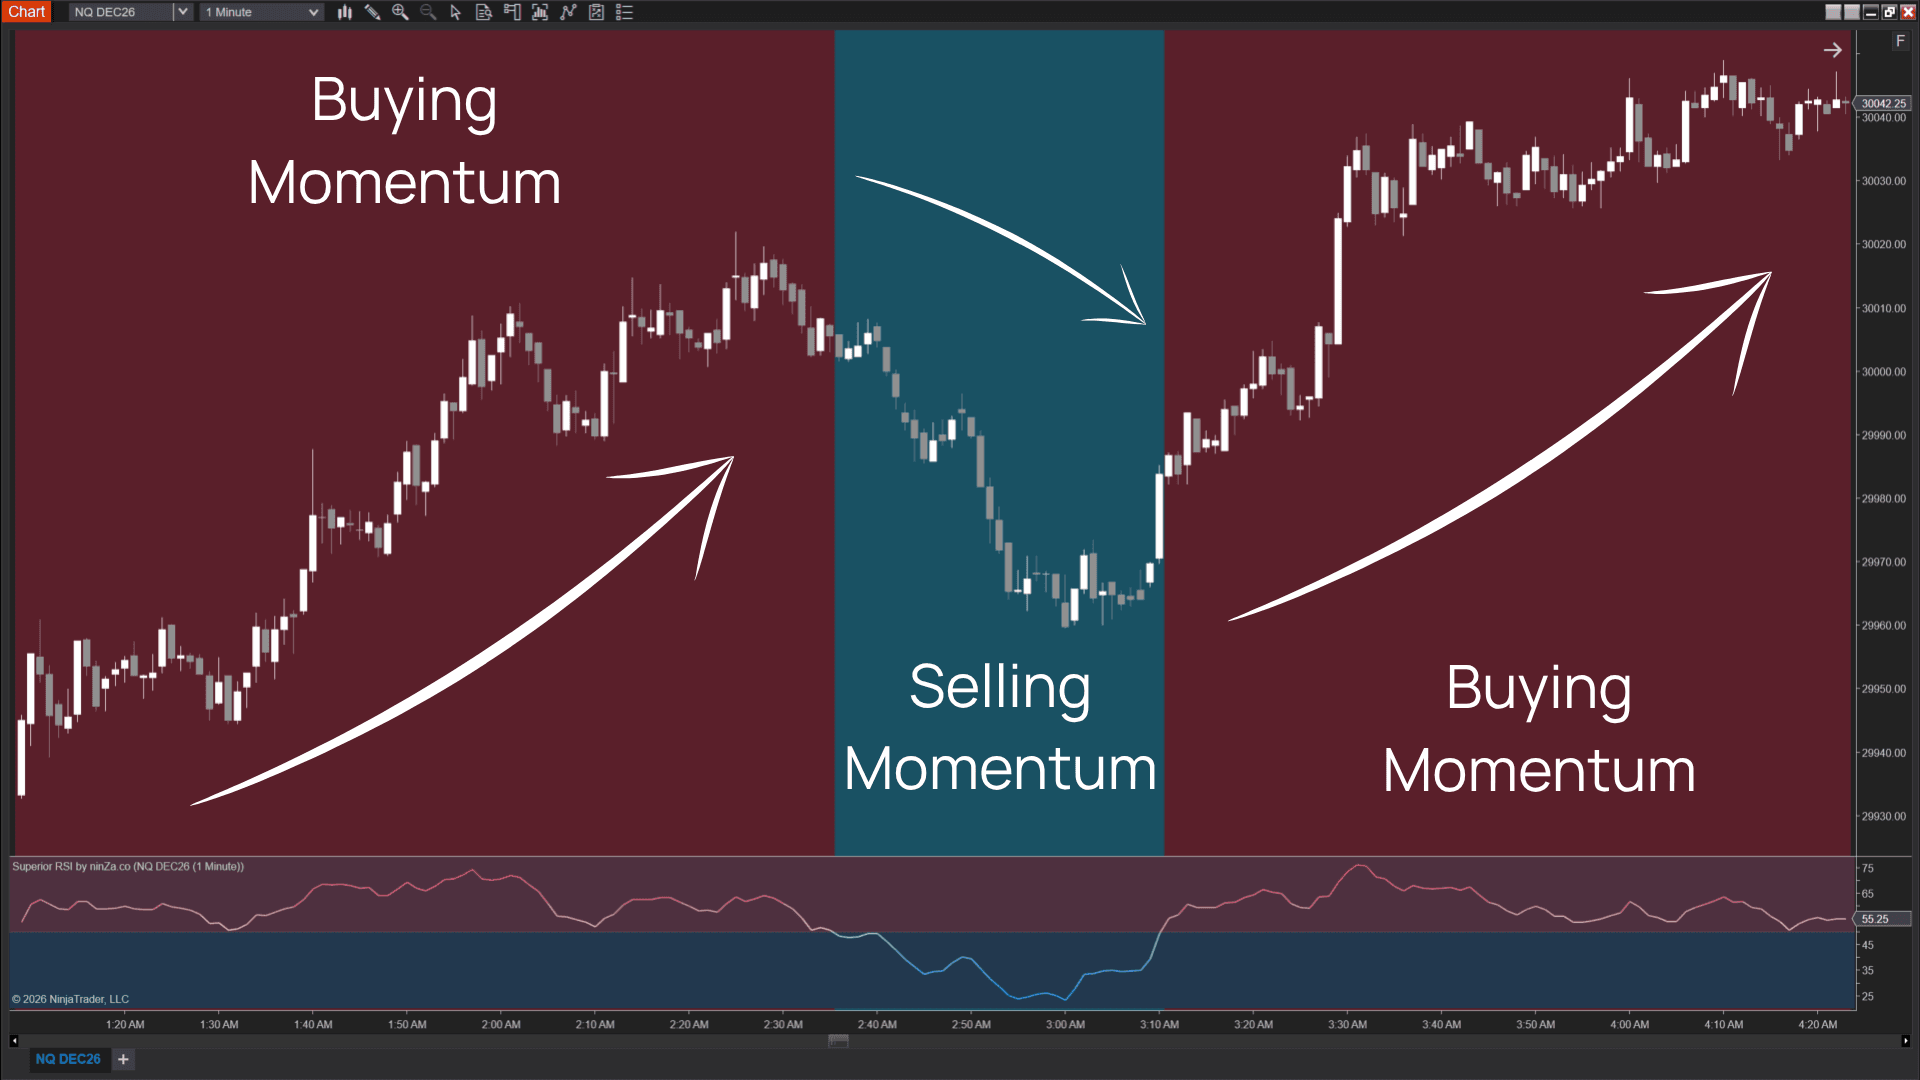
Superior RSI

An enhanced version of the classic RSI for NinjaTrader 8, with smoothing through 11 moving-average options.

The additional smoothing options can help reduce short-term noise while preserving RSI's role as a momentum measure.

Within FELIX2, it supports momentum-strength analysis.

banner-image
banner-image
banner-image
banner-image
banner-image
banner-image
banner-image

Momentum direction 

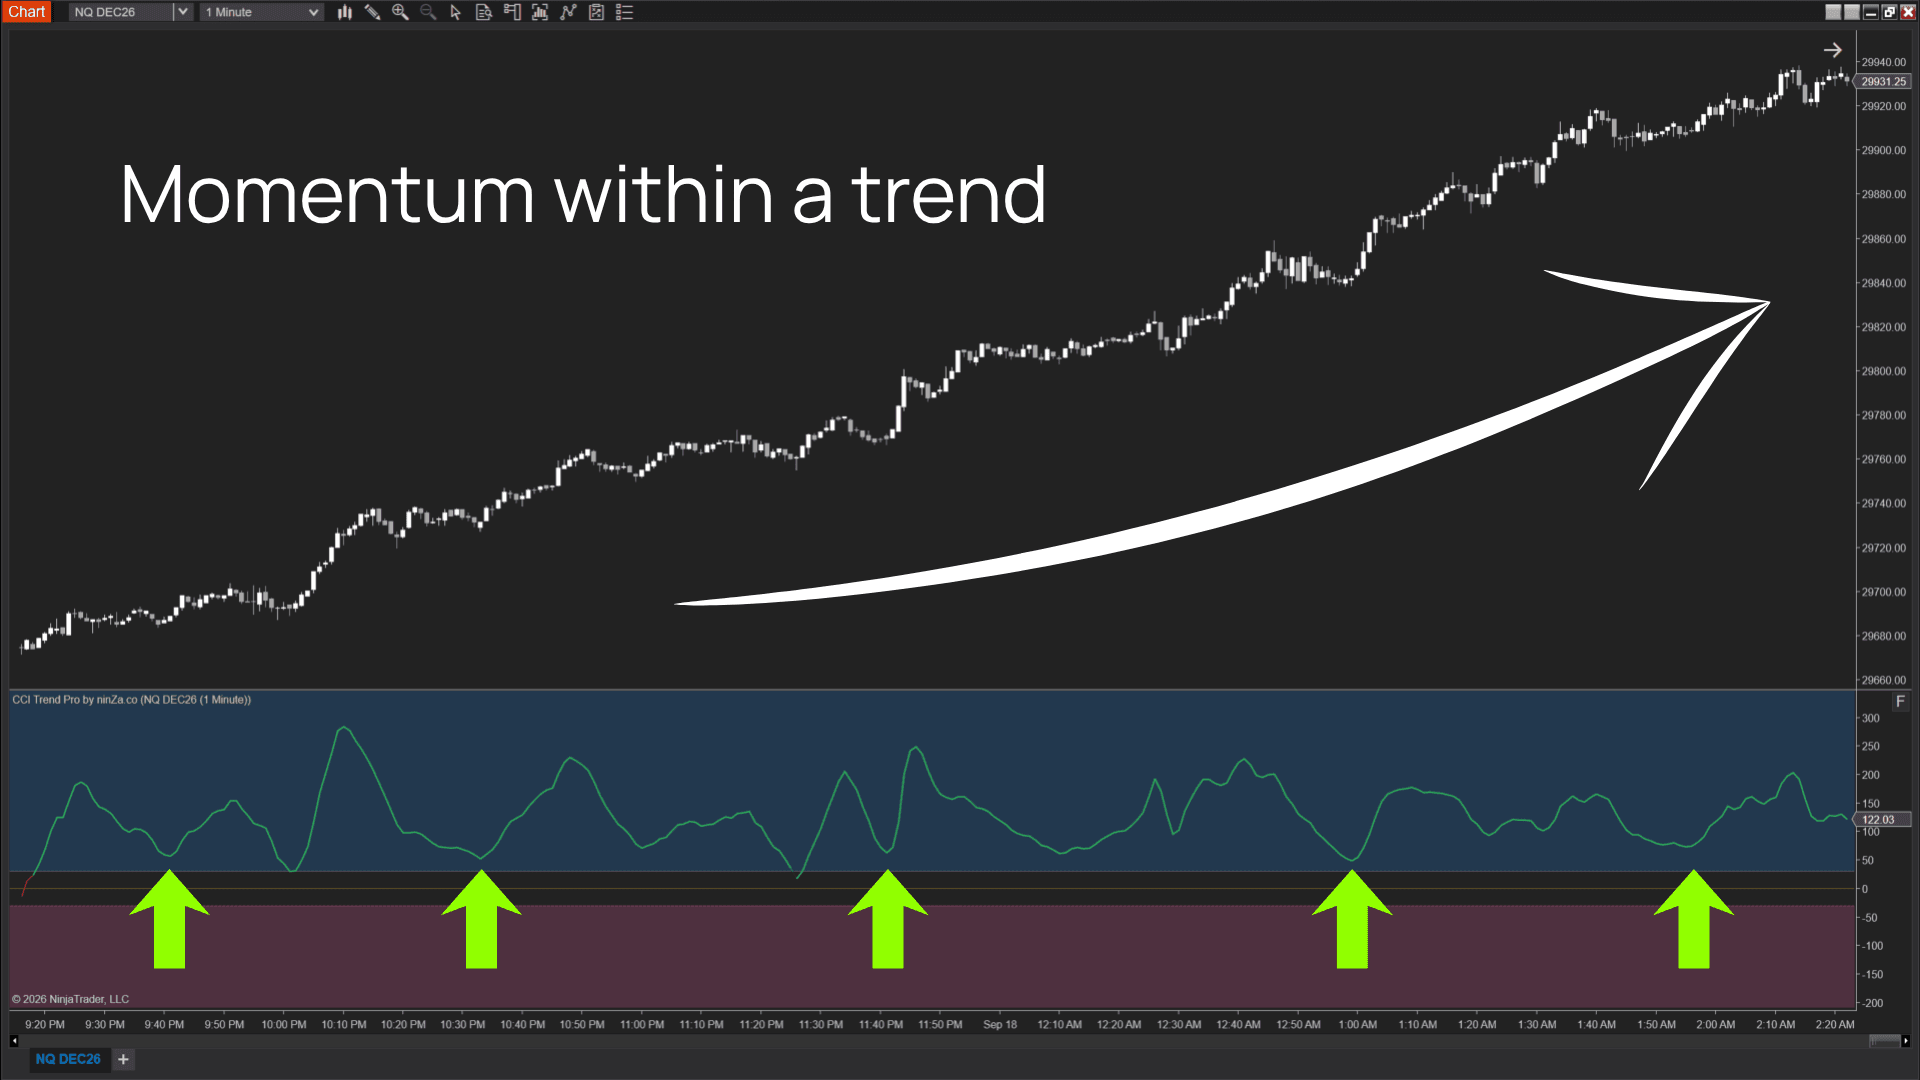
CCI Trend Pro

CCI Trend Pro extends classic CCI analysis by identifying directional trend phases and distinguishing between stronger and weaker conditions.

It also supports configurable MA type, multiplier, and CCI smoothing.

Within FELIX2, it provides a separate read of momentum direction.

banner-image
banner-image
banner-image
banner-image
banner-image
banner-image

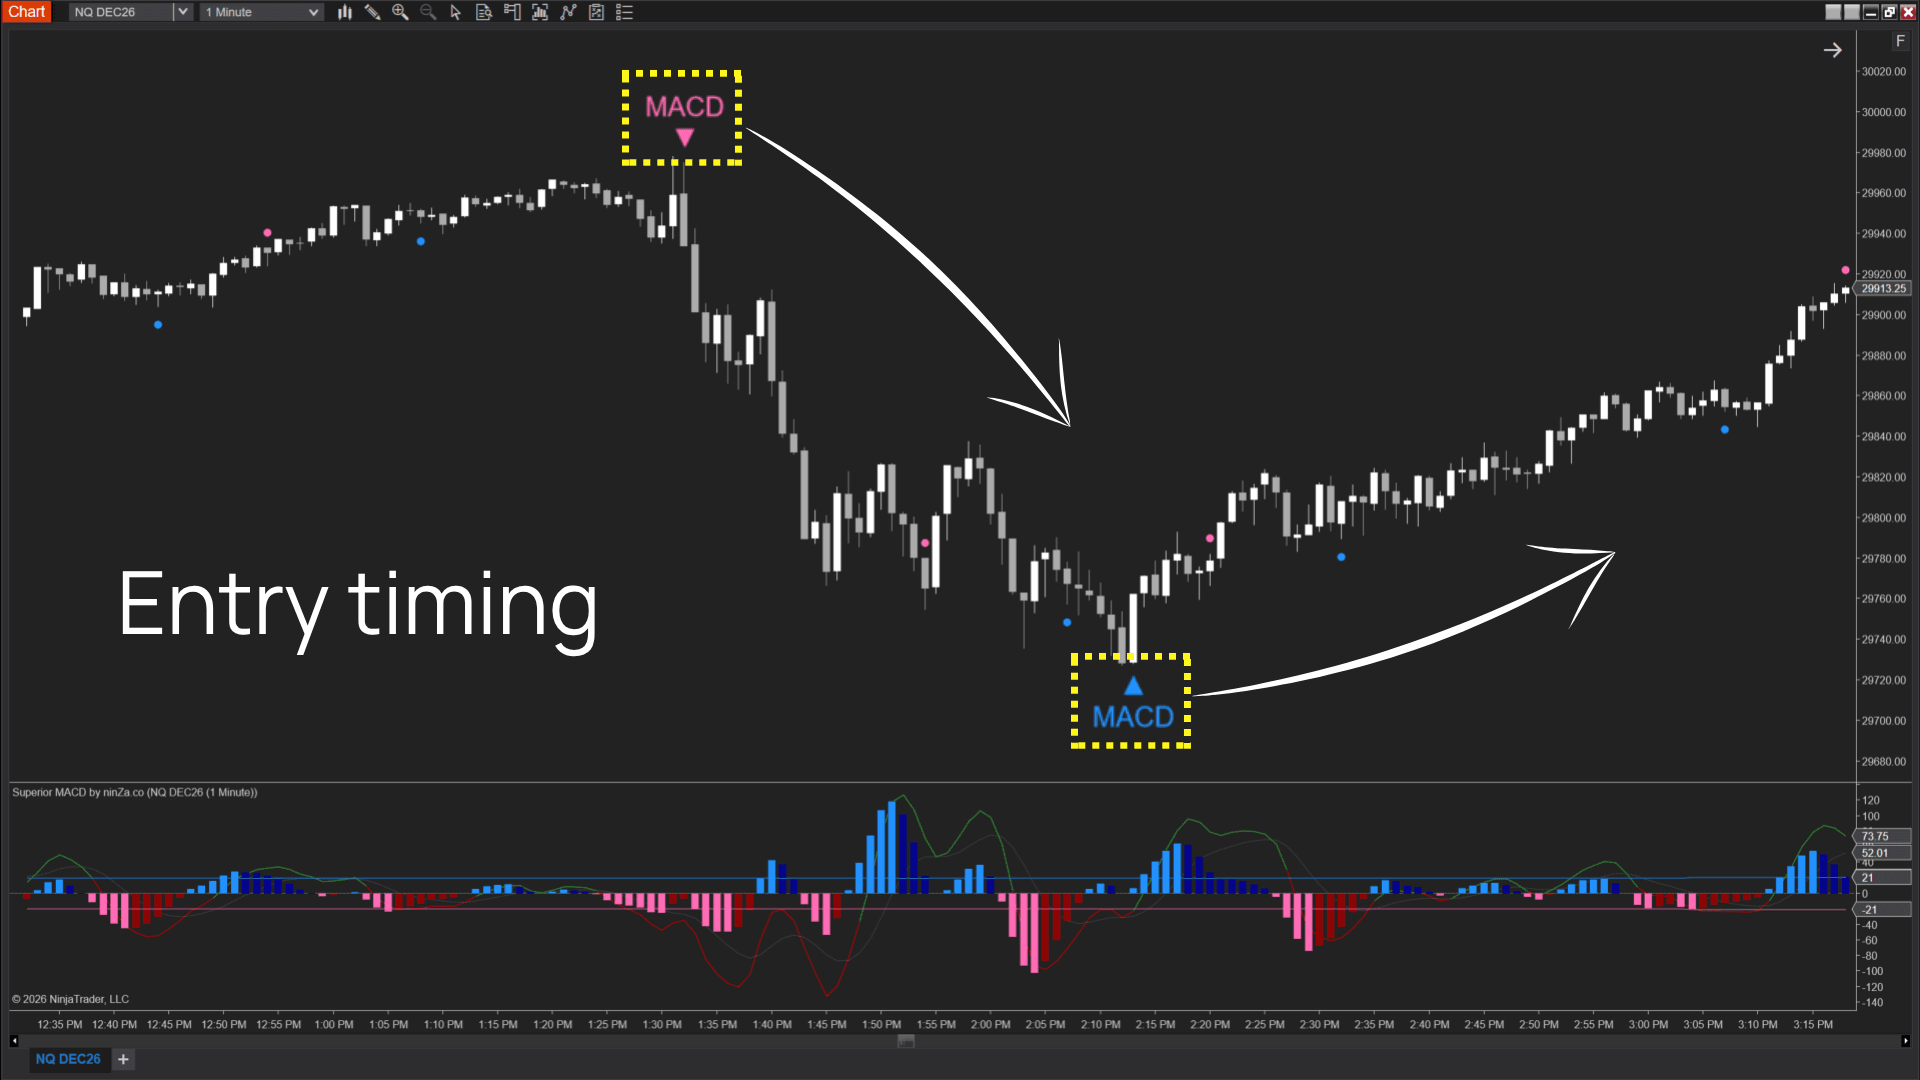
Entry timing 

Superior MACD

Superior MACD expands the classic MACD framework with configurable moving averages, smoothing, ATR-based histogram thresholds, slowdown detection, and visual crossover markers.

Within FELIX2, its role is precise: entry timing after the broader conditions are already in place.

banner-image
banner-image
banner-image
banner-image
banner-image
banner-image

Why the structure matters

Separate the questions before you combine the answers

FELIX2 does not ask every indicator to answer the same question.

It separates the decision process into distinct layers.

A broader trend can remain intact while short-term momentum weakens. Momentum can also improve before the full entry condition is in place.

For traders who prefer rules over interpretation, this creates a process that is easier to define, review, and test.

Understand why a setup qualifies
Understand why a setup does not qualify
See which condition is still missing
Know which part of the framework is being changed during testing

Exact tested setup

Antonino Venuto's tested FELIX2 configuration

The framework above describes the broader logic.

For his own validation, Antonino defined a specific FELIX2 configuration and tested it on NQ futures using a 2-minute chart.

The historical results shown on this page come from this configuration.

Exact entry rules

A position is opened only when all 4 conditions align.

RoleIndicatorLongShort
Trend directionSMA Colorized 4U, period 105Trend Signal = 1Trend Signal = -1
Momentum strengthSuperior RSI, 14 with Smooth 3RSI > 50RSI < 50
Momentum directionCCI Trend Pro, period 14CCI > 0CCI < 0
Entry triggerSuperior MACD, 12 / 26 / 9MACD above 0 + Difference line crosses above 0MACD below 0 + Difference line crosses below 0

CCI mathematical constant: 0.015

01

Trend direction

SMA Colorized 4U, period 105

The primary directional trend must already be established.

Long: Trend Signal = 1

Short: Trend Signal = -1

02

Momentum strength

Superior RSI, 14 with Smooth 3

Momentum must support the established direction.

Long: Superior RSI > 50

Short: Superior RSI < 50

03

Momentum direction

CCI Trend Pro, period 14

CCI must also point in the appropriate direction.

Long: CCI Trend Pro > 0

Short: CCI Trend Pro < 0

04

Entry trigger

Superior MACD, 12 / 26 / 9

Superior MACD provides the final entry trigger.

For a long entry, the MACD line must be above 0 and the Difference line must cross above 0.

For a short entry, the MACD line must be below 0 and the Difference line must cross below 0.

The strategy starts after the initial Globex-open volatility, pauses during the European morning and US pre-market period identified in testing, then resumes after the US open volatility begins to settle.

These are Antonino's tested FELIX2 settings.

Changing the market, timeframe, parameters, filters, stop, or target creates a different configuration and should be validated accordingly.

Validation process

Validation went beyond a single equity curve

An attractive backtest is useful, but it does not answer every question about a strategy.

Antonino took FELIX2 through several additional stages of testing to examine the strategy from different angles.

01

High-resolution historical testing

The initial 8-month test used:

  • NQ futures
  • 2-minute chart
  • Tick-by-tick historical processing
  • 2 ticks of slippage per trade

The primary configuration generated more than $100,000 in historical net profit during the tested period.

02

Time-of-day analysis

Performance was reviewed by time of day to identify periods where the strategy experienced a greater concentration of choppy, losing trades.

Those findings were then incorporated into Antonino's operating and pause windows.

03

Walk-forward testing

FELIX2 was also tested using:

60 days in-sample → 10 days out-of-sample

According to Antonino's validation, monthly out-of-sample net profit remained stable through the test.

The purpose was to evaluate the strategy on data outside the preceding optimization window rather than relying only on the original sample.

04

Monte Carlo testing

More than 1,600 trades were reshuffled 10,000 times to examine how different trade sequences could affect drawdown and account performance.

  • None of the 10,000 simulated sequences resulted in account ruin
  • The Monte Carlo median drawdown remained broadly aligned with the historical results
  • Antonino uses approximately $10,000 to $13,000 of drawdown capacity as a practical capital-planning reference for this configuration
These tests provide additional context around the historical results. They do not remove market risk or guarantee future performance.

Historical validation

Backtest results from Antonino's NQ configuration

Primary configuration: 130-tick stop / 120-tick target

Jan 1 to Sep 4, 2026 NQ futures 2-minute 1,745 trades
Total net profit$101,618.80
Profit factor1.21
Max drawdown$8,950.52
Win rate56.79%
Average trade$58.23
Net profit / max drawdown≈ 11.4x

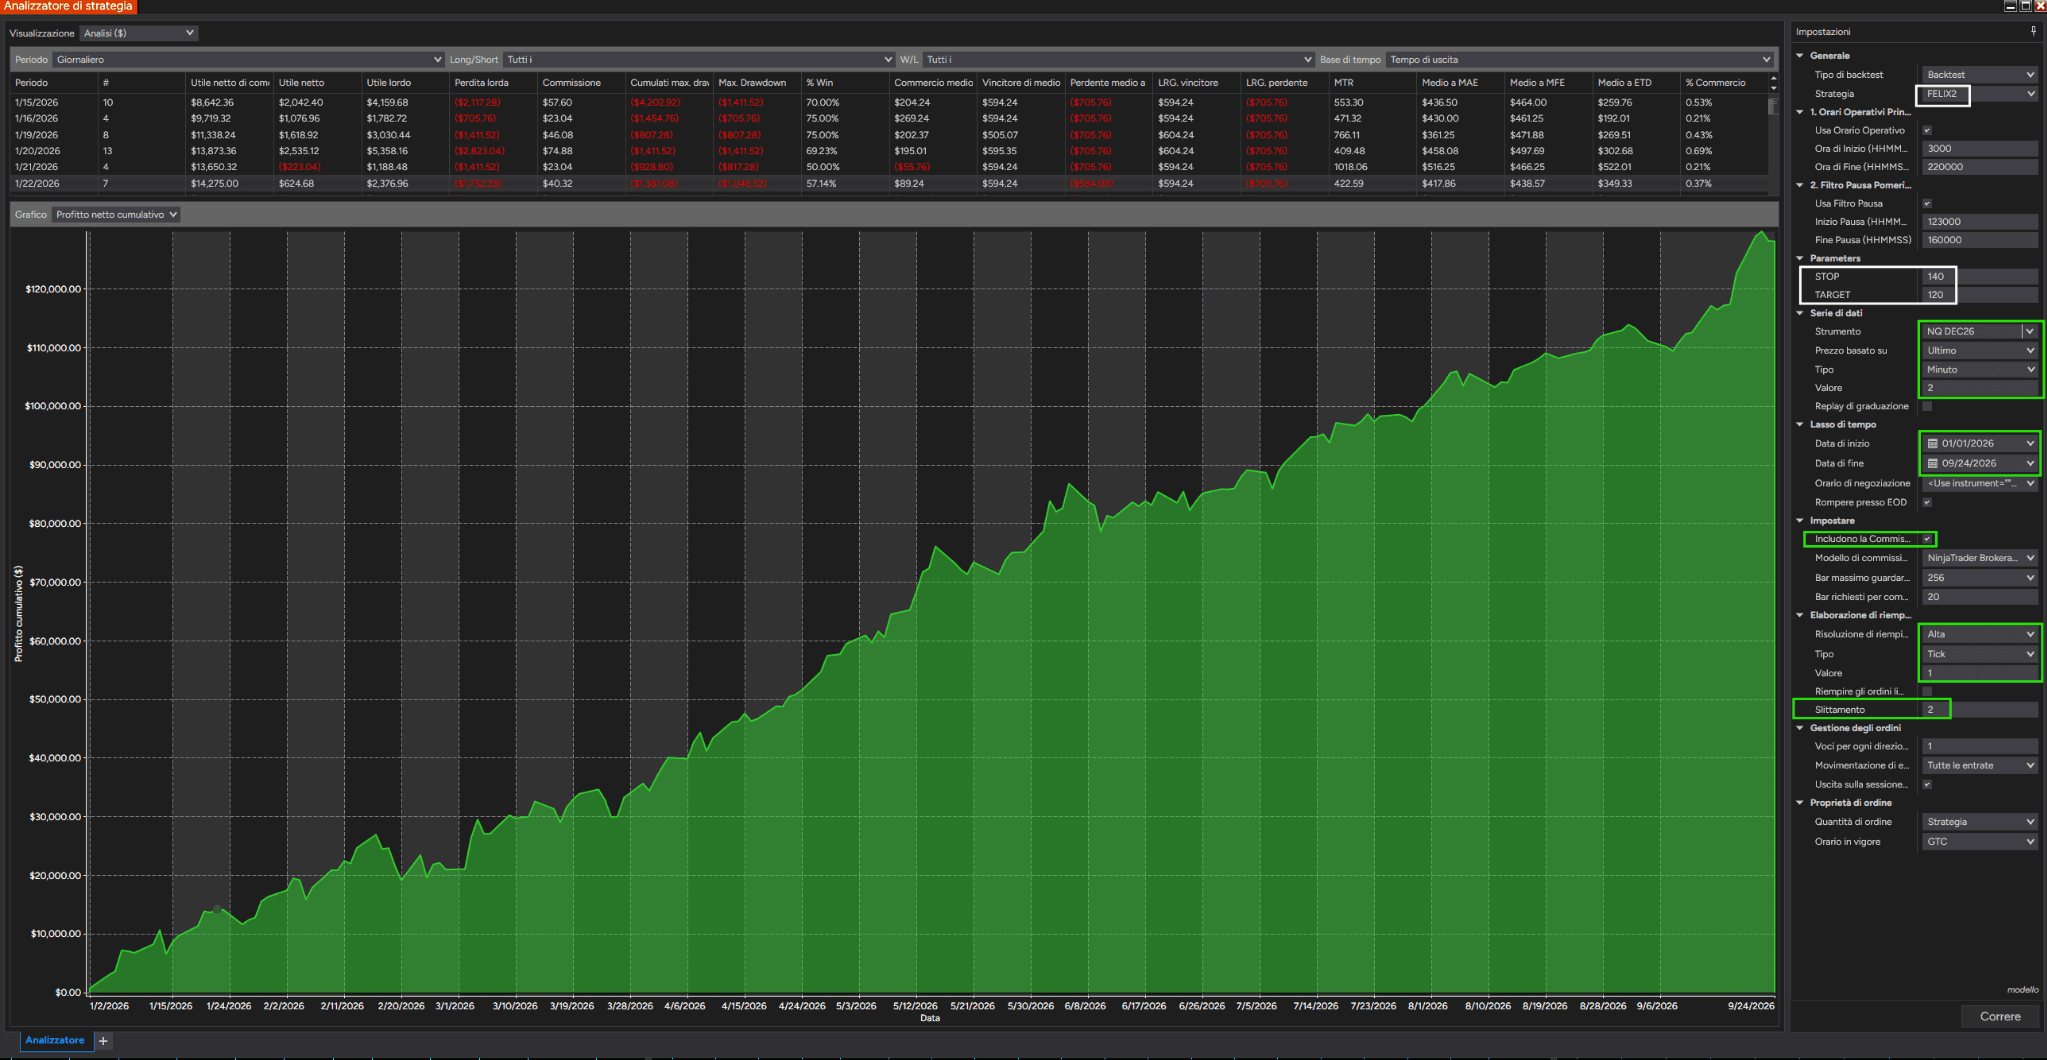
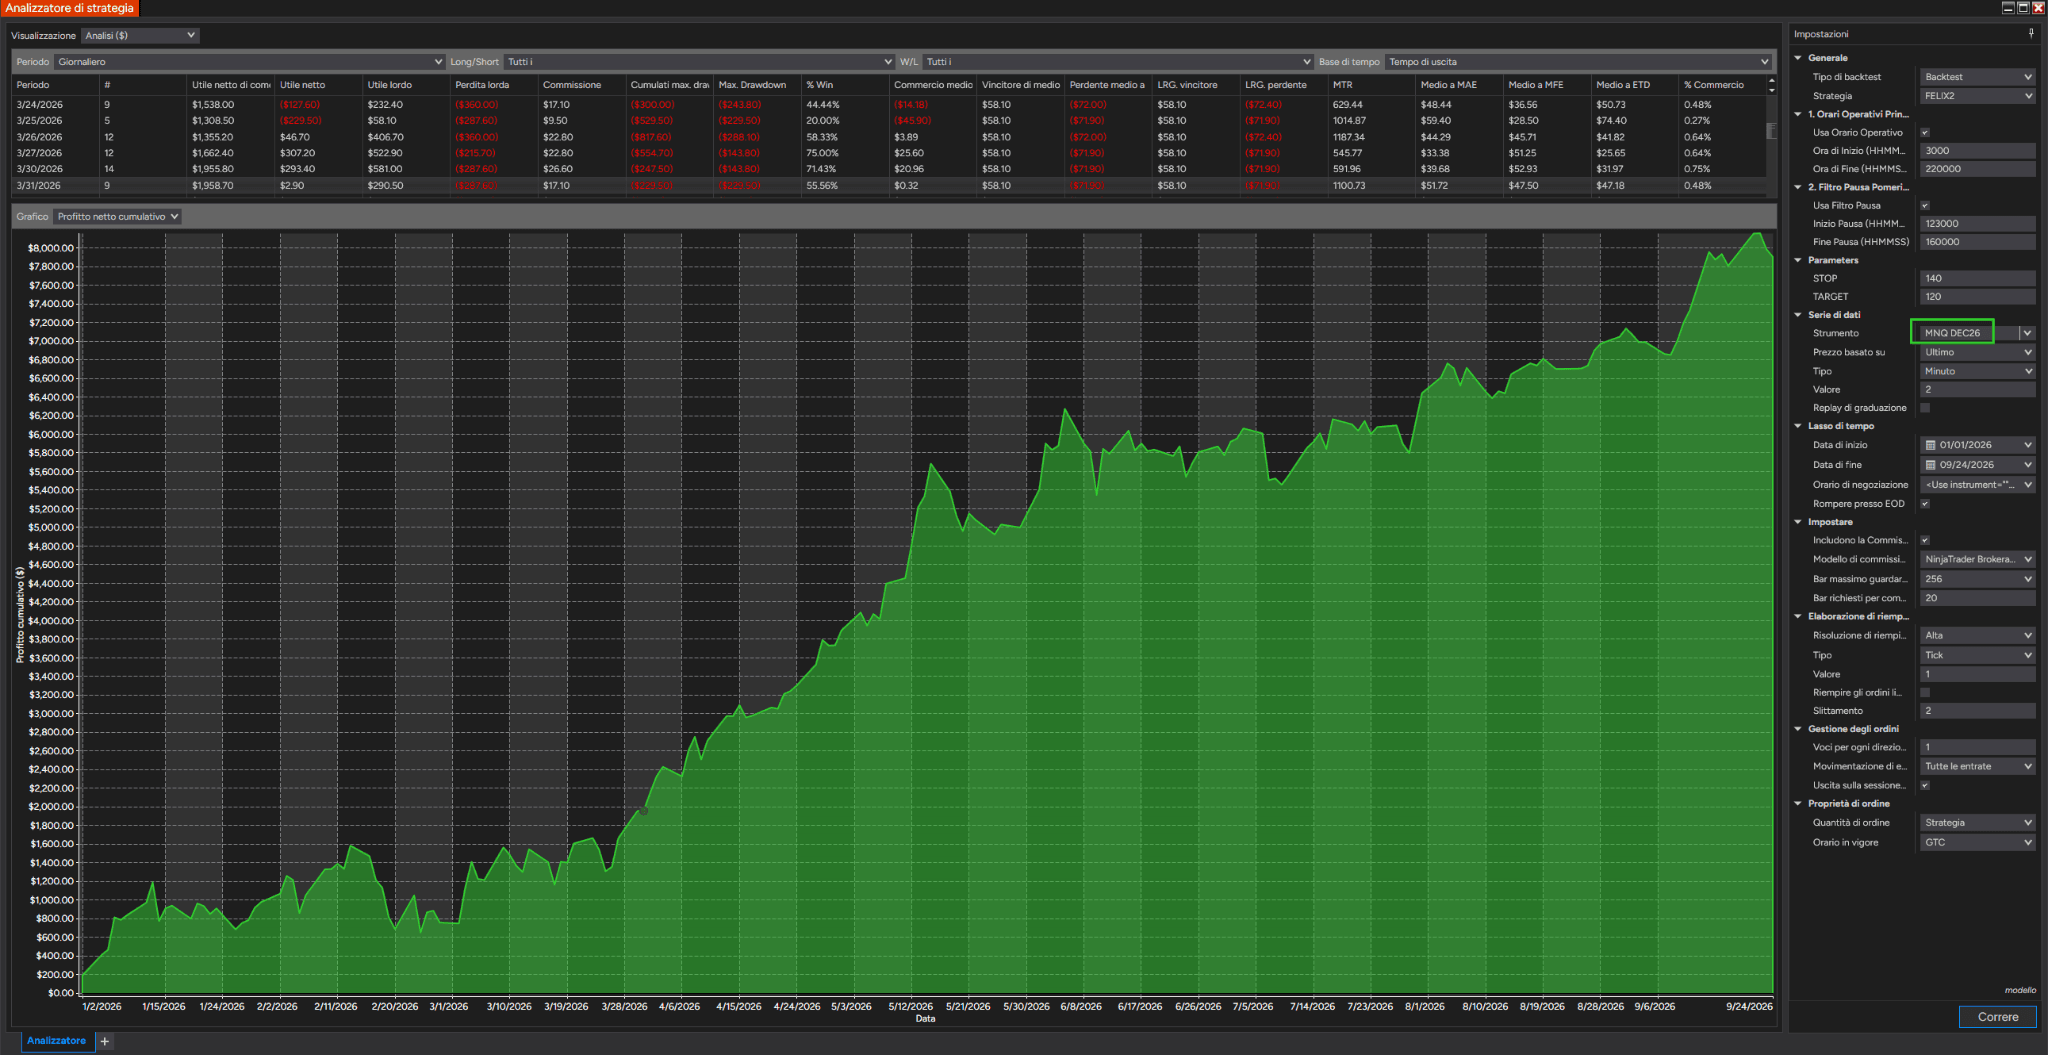
130 / 120 backtest equity curve

130 / 120 Backtest Cumulative Net Profit Equity Curve

130 / 120 Strategy Performance Metrics

NinjaTrader Strategy Analyzer Summary (130 SL / 120 TP)
Historical net profit was approximately 11.4x the maximum drawdown recorded in the test.

Alternative configuration: 170-tick stop / 120-tick target

Antonino also tested a wider stop for traders who can accommodate larger equity swings in exchange for higher historical absolute profit.

NQ futures 2-minute 1,670 trades
Total net profit$111,275.80
Profit factor1.22
Max drawdown$12,288.88
Win rate62.75%
Average trade$66.63
Net profit / max drawdown≈ 9.1x

170 / 120 backtest equity curve

170 / 120 Alternative Cumulative Net Profit Equity Curve

170 / 120 Strategy Performance Metrics

NinjaTrader Strategy Analyzer Summary (170 SL / 120 TP)
Historical net profit was approximately 9.1x the maximum drawdown recorded in the test.
The wider stop produced a higher historical win rate and higher net profit in this test.

It also increased maximum drawdown from approximately $8,951 to $12,289.

That tradeoff matters.

The 170 / 120 configuration is not automatically the better choice. It requires greater tolerance for drawdown and different capital planning.

In practice

What changes when the process is defined

FELIX2 does not remove uncertainty from trading.

It gives that uncertainty a clearer structure.

Instead of asking whether several indicators simply "look bullish" or "look bearish," the framework gives you a defined sequence:

Trend direction
Momentum strength
Momentum direction
Entry trigger

That makes it easier to understand why a setup qualifies, why it does not, and which condition is missing.

It also makes testing more deliberate.

If you change a filter, parameter, timeframe, market, or exit rule, you know which part of the process you changed rather than altering an undefined collection of signals.

For traders who prefer a rules-based workflow, that is the practical value of FELIX2:

A trading idea that can be defined, tested, reviewed, and refined.

Before you decide

Questions worth answering first

Is a 4-indicator framework too complicated?

It can be if all 4 indicators are doing the same job.

That is not how FELIX2 is structured.

Each one answers a different question: Trend → Momentum strength → Momentum direction → Trigger.

Once those roles are clear, the framework becomes easier to follow than simply watching several indicators and trying to interpret them together.

You also receive personalized support for each indicator in the bundle.

Is FELIX2 limited to NQ on a 2-minute chart?

The validation shown on this page is specifically for NQ on a 2-minute chart.

That is the configuration Antonino tested and the source of the performance results presented here.

If you use a different market, timeframe, or parameter set, those historical results should not be assumed to carry over. The new configuration should be tested independently.

Do I need to use Antonino's exact settings?

No, but changing them means you are testing a different configuration.

The published settings matter because they are the settings behind the validation and historical performance shown on this page.

Any alternative setup should be evaluated on its own data rather than assumed to reproduce Antonino's results.

What happens when market conditions change?

No strategy can guarantee that historical performance will continue unchanged.

That is one reason Antonino went beyond the original historical backtest.

Walk-forward testing evaluated the strategy on out-of-sample data, while Monte Carlo testing examined how different trade sequences could affect drawdown.

These tests provide stronger historical evidence for Antonino's configuration, but they remain validation, not a promise of future returns.

What if the indicators do not fit the way I trade?

You have 30 days to use them in real market conditions and evaluate how they fit your workflow.

If the bundle is not right for you, Zuture Exchange lets you switch to another eligible indicator with little to no additional investment, depending on the replacement selected.

That gives you room to evaluate the tools before deciding what belongs in your longer-term setup.

Investment

Get the 4 indicators behind FELIX2

The bundle brings together the complete indicator set used in Antonino's FELIX2 framework.

IncludedValue
Superior MACD$300
CCI Trend Pro$250
Superior RSI$300
SMA Colorized 4UIncluded
Combined product value$850
Personalized support for all 4 indicators$400 value
Total included value$1,250

One-time investment: $300

You receive all 4 indicators behind the FELIX2 framework, together with personalized support for each one.

If you'd rather purchase the indicators separately or build your own combination, tell us which ones you're interested in →. Our team will get in touch with you.

Purchase coverage

Your purchase is covered

30-day evaluation

Use the indicators in real market conditions for 30 days and see how they fit your trading process.

If the bundle is not the right fit, Zuture Exchange gives you the option to switch to another eligible indicator with little to no additional investment, depending on the replacement you choose.

You have time to evaluate the tools in your own workflow before deciding what belongs there long term.

FELIX2 access

Build from a framework you can actually test.

FELIX2 gives you the same 4 indicators Antonino Venuto used to build his trend-following framework, together with a clear view of the logic and the detailed NQ validation behind his own configuration.

You can see the framework.

You can see Antonino's exact rules.

You can see how the strategy was tested.

And you can decide how the tools fit your own trading process.

One-time investment with ZACCESS: $240

ZACCESS is already applied at checkout.

Download ~ 40 FREE indicators & reach more useful resources !!!

Your most-used email

Choose the NINZA indicator you want to see live on a NinjaTrader chart.

Share my preferences ↓


Join server
discord-avatar

ninZa.co Indicators

0 online