![[NEW] Why most ICT traders keep falling short](https://forestcms.nyc3.digitaloceanspaces.com/media/small_ICT PhantomTrace banner (ninZaco)(76x549)_1781317050194.jpg)
[NEW] Why most ICT traders keep falling short
- Is order flow truly shifting?
- Where is liquidity being targeted next?
![June Exclusive: [AbsP] Summer Wave Bundle](https://forestcms.nyc3.digitaloceanspaces.com/media/small_Summer Wave bundle banner (1280x720)_1780571380106.jpg)
June Exclusive: [AbsP] Summer Wave Bundle
Access our newest Smart Money indicators at peak pricing.
Available only through June.
Alpha Trader Alliance
The market is challenging. You don't have to explore it alone.
_1780570996067.jpg)
New Horizon: Your Most Common Questions Answered
Get answers to the most frequently asked questions about New Horizon.
![[Webinar replay] BigTrade Sweep](https://forestcms.nyc3.digitaloceanspaces.com/media/small_Thumbnail webinar (Ông James) BigTrade Sweep_1781494294545.jpg)
[Webinar replay] BigTrade Sweep
See how BigTrade Sweep reads Smart Money activity
![[New trading strategy] Trend following + Order Flow](https://forestcms.nyc3.digitaloceanspaces.com/media/small_Thumbnail ThunderZilla + Apex Flow Zignal_1781494257219.jpg)
[New trading strategy] Trend following + Order Flow
How to simplify Order Flow analysis for automated trading

Absolute Price
Access selected trading solutions under our most favorable release conditions.
BigTrade Sweep NT8
See where big trades step in. Trade with more context
BigTrade Sweep helps identify potential liquidity sweeps and large participant activity around key market areas, allowing traders to better understand who may be driving the move before making a trading decision.
Not every Volume Spike is an opportunity
A massive volume candle appears. Price suddenly accelerates. And in just a few seconds, traders are forced into a difficult decision.
The decision you're forced to make
The problem is that large institutions rarely reveal their true intention directly.
- Orders can be split into smaller executions.
- Algorithms can hide accumulation and distribution.
- Iceberg Orders can absorb liquidity without exposing the real position size.

But when truly aggressive money enters the market, traces of that activity still appear through abnormal volume and execution behavior.
That's where many traders struggle:
Enter too early and get trapped in a fake breakout.
Stay out and miss a powerful continuation move.
Wait for confirmation and lose the best part of the entry.
And in fast-moving markets, those decisions often need to be made within seconds.
What BigTrade Sweep actually reveals behind volume
BigTrade Sweep is designed to detect when large institutional money enters the market at the tick level, helping you determine whether the move leads to continuation or a trap.
Rather than forcing traders to manually read complex Footprint data during fast-moving conditions, BigTrade Sweep transforms hidden Smart Money activity into:
Visual signals directly on the chart
Easy-to-read volume events
Actionable continuation or trap scenarios in real time
The result is a clearer and more actionable way to read Order Flow during fast-moving market conditions.
How Smart Money is detected at the tick level
01 / Tick-level Order Flow analysis
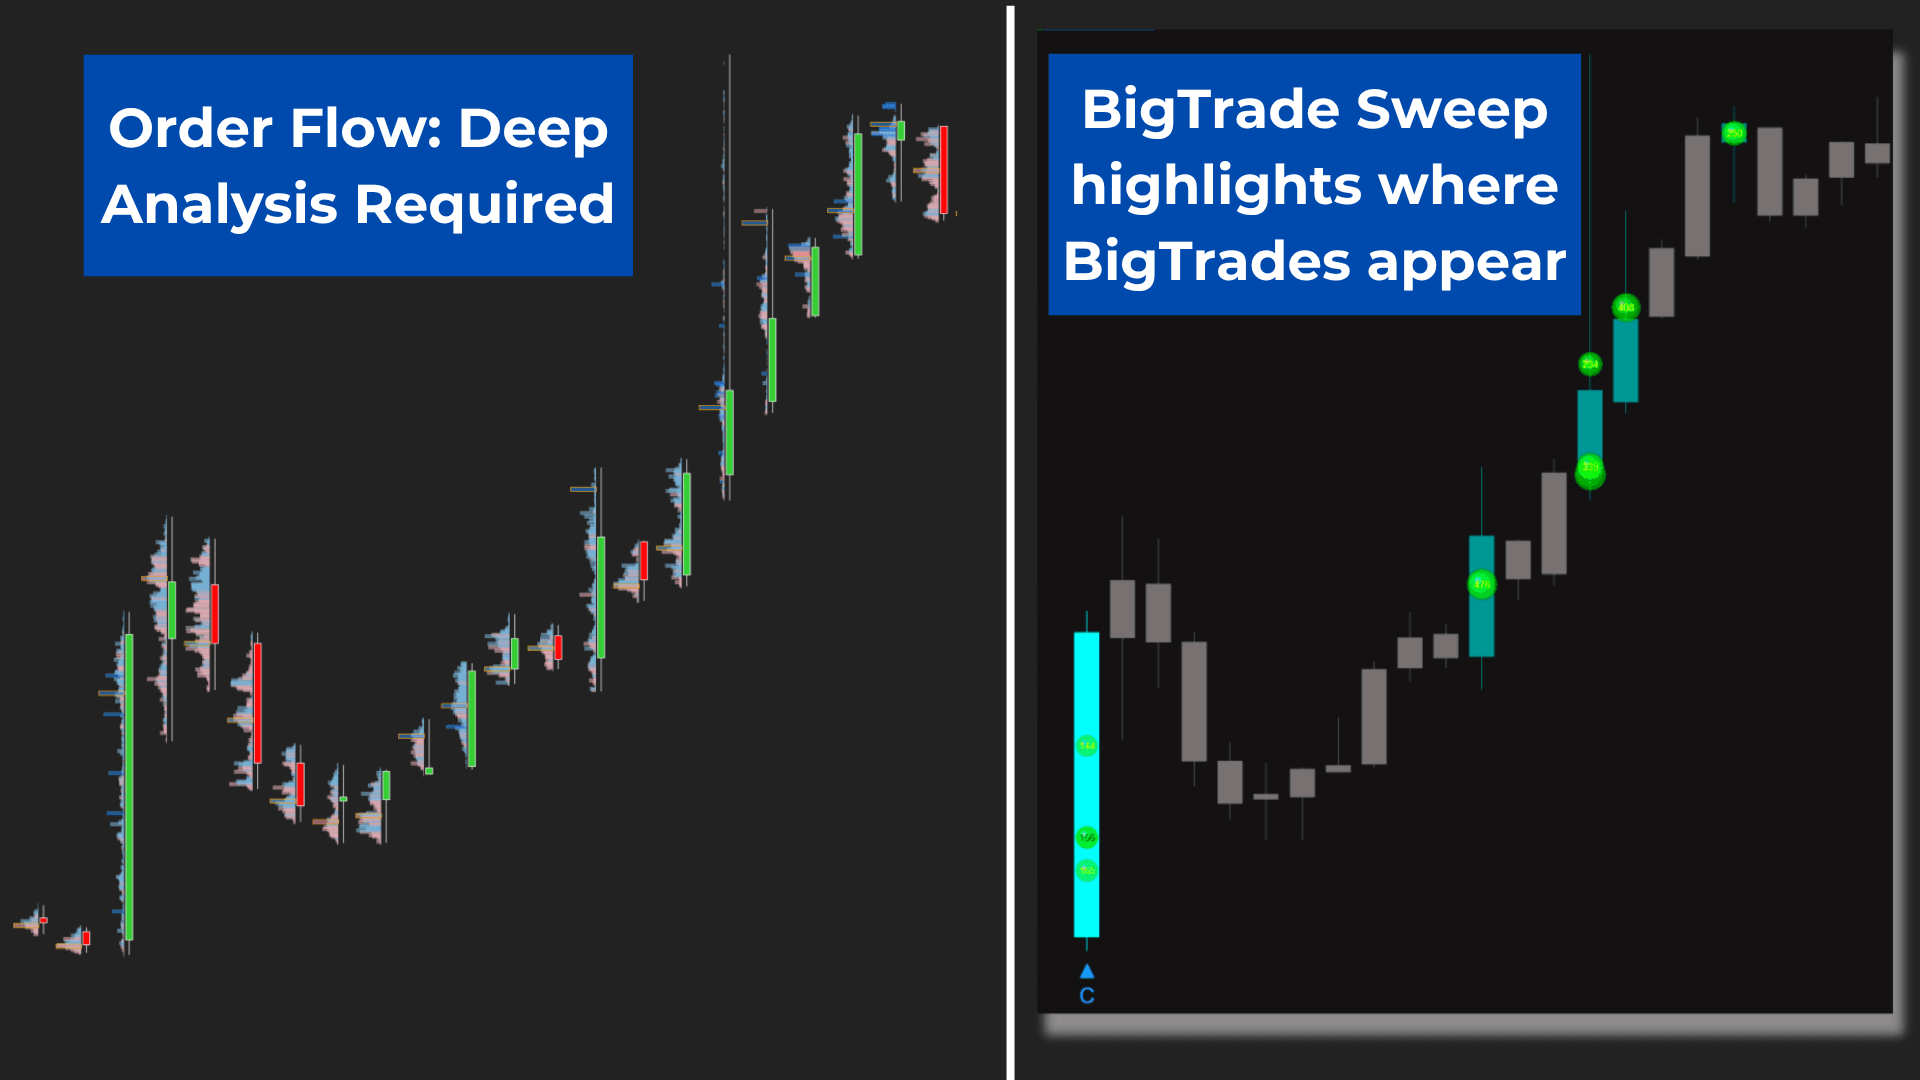
The blind spot of traditional volume indicators
Most traditional volume indicators combine institutional activity & retail noise into the same candle, making it difficult to distinguish meaningful participation from normal market activity.
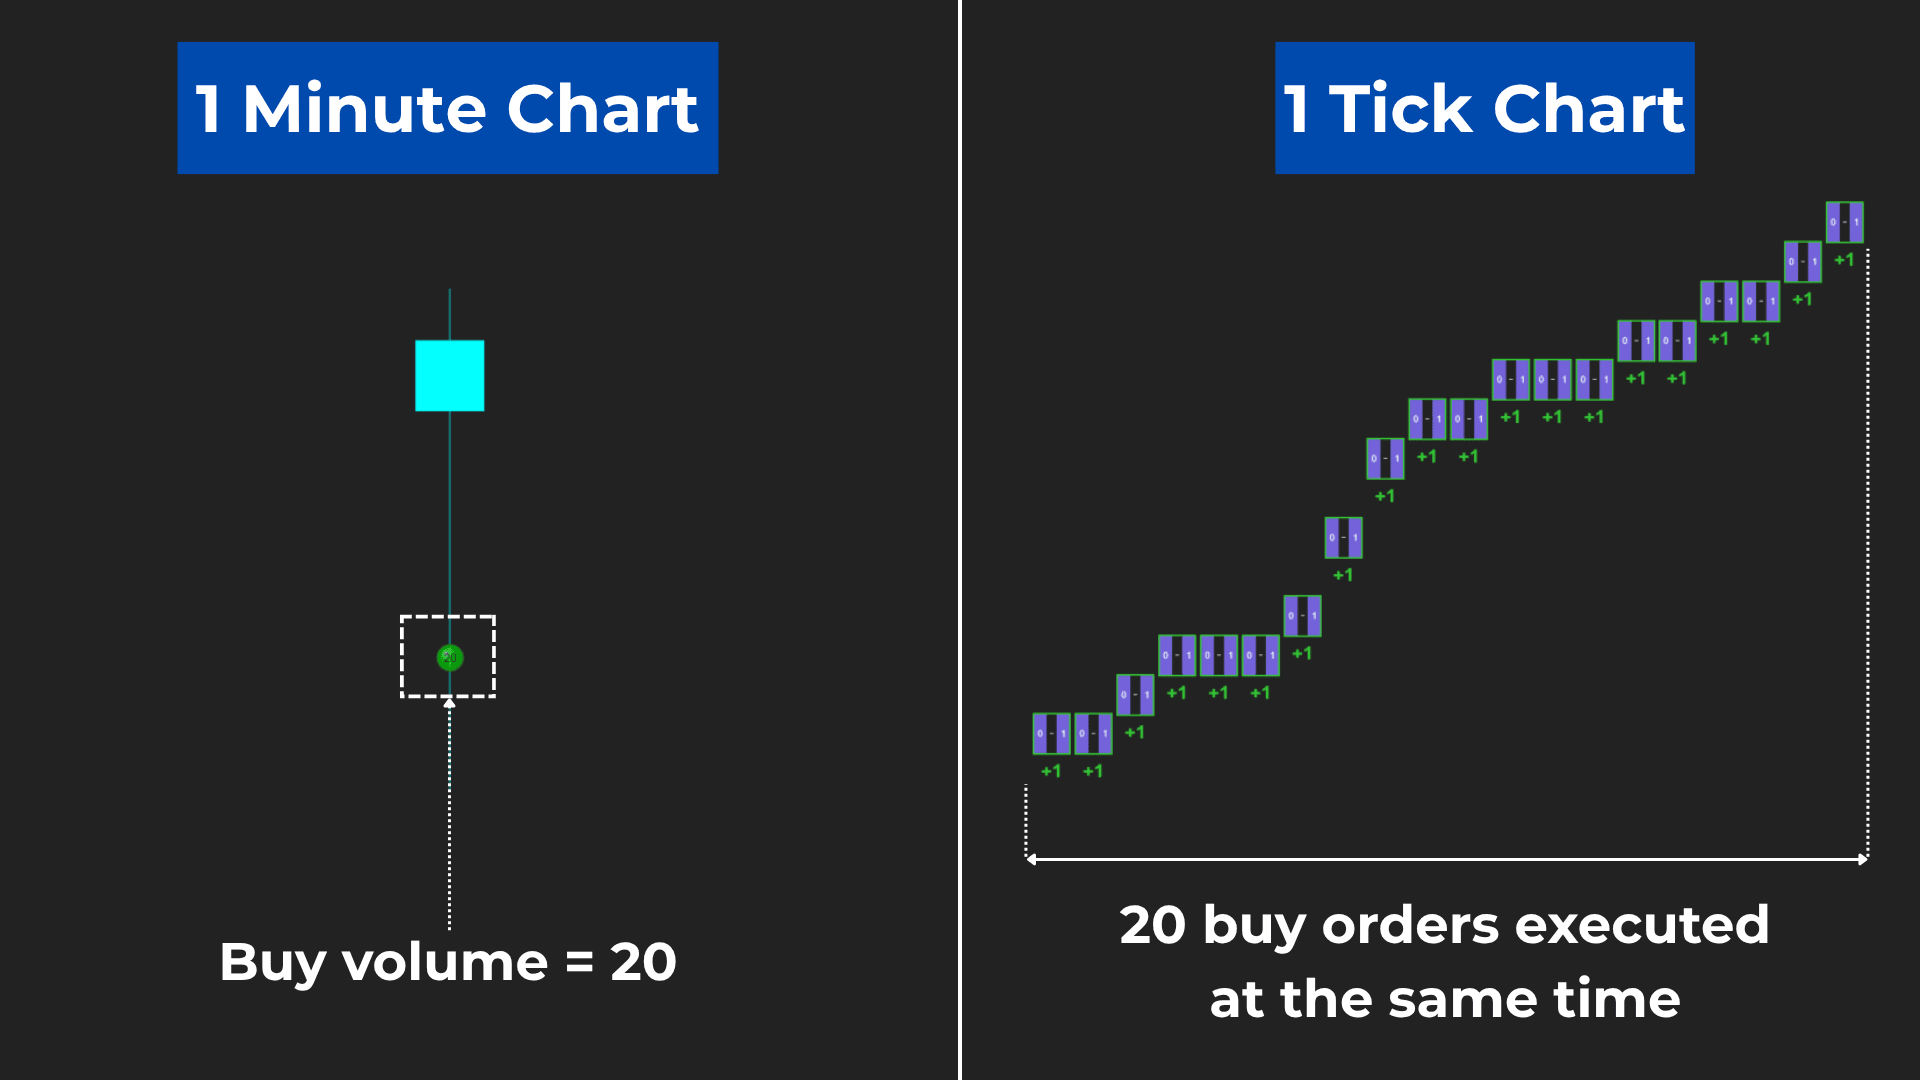
BigTrade Sweep does not analyze volume by candle
Instead of relying on aggregated candle volume, BigTrade Sweep analyzes real-time execution data directly at the tick level to identify:
- Aggressive institutional orders
- High-volume executions
- Unusual bursts of participation occurring at specific price levels
The indicator uses volume threshold filtering to automatically remove a large portion of smaller retail noise from the analysis.
This allows the indicator to separate meaningful institutional participation from the noise created by smaller retail transactions.
02 / Order excecution speed monitoring
Large institutions can hide size – but not execution behavior
Large institutions can split orders into smaller executions, hide size through iceberg-style behavior, or distribute liquidity across multiple transactions.
But when aggressive liquidity truly enters the market, footprints still become visible through:
- Execution speed
- Order flow imbalance signals
- Cumulative fills
- Sudden bursts of trading activity
That’s why BigTrade Sweep monitors execution speed & order flow imbalance within milliseconds.
When unusually large liquidity aggressively sweeps through multiple price levels, the indicator immediately detects the sudden expansion in execution activity.
This helps traders identify institutional participation even when larger orders are fragmented or partially hidden from the market.
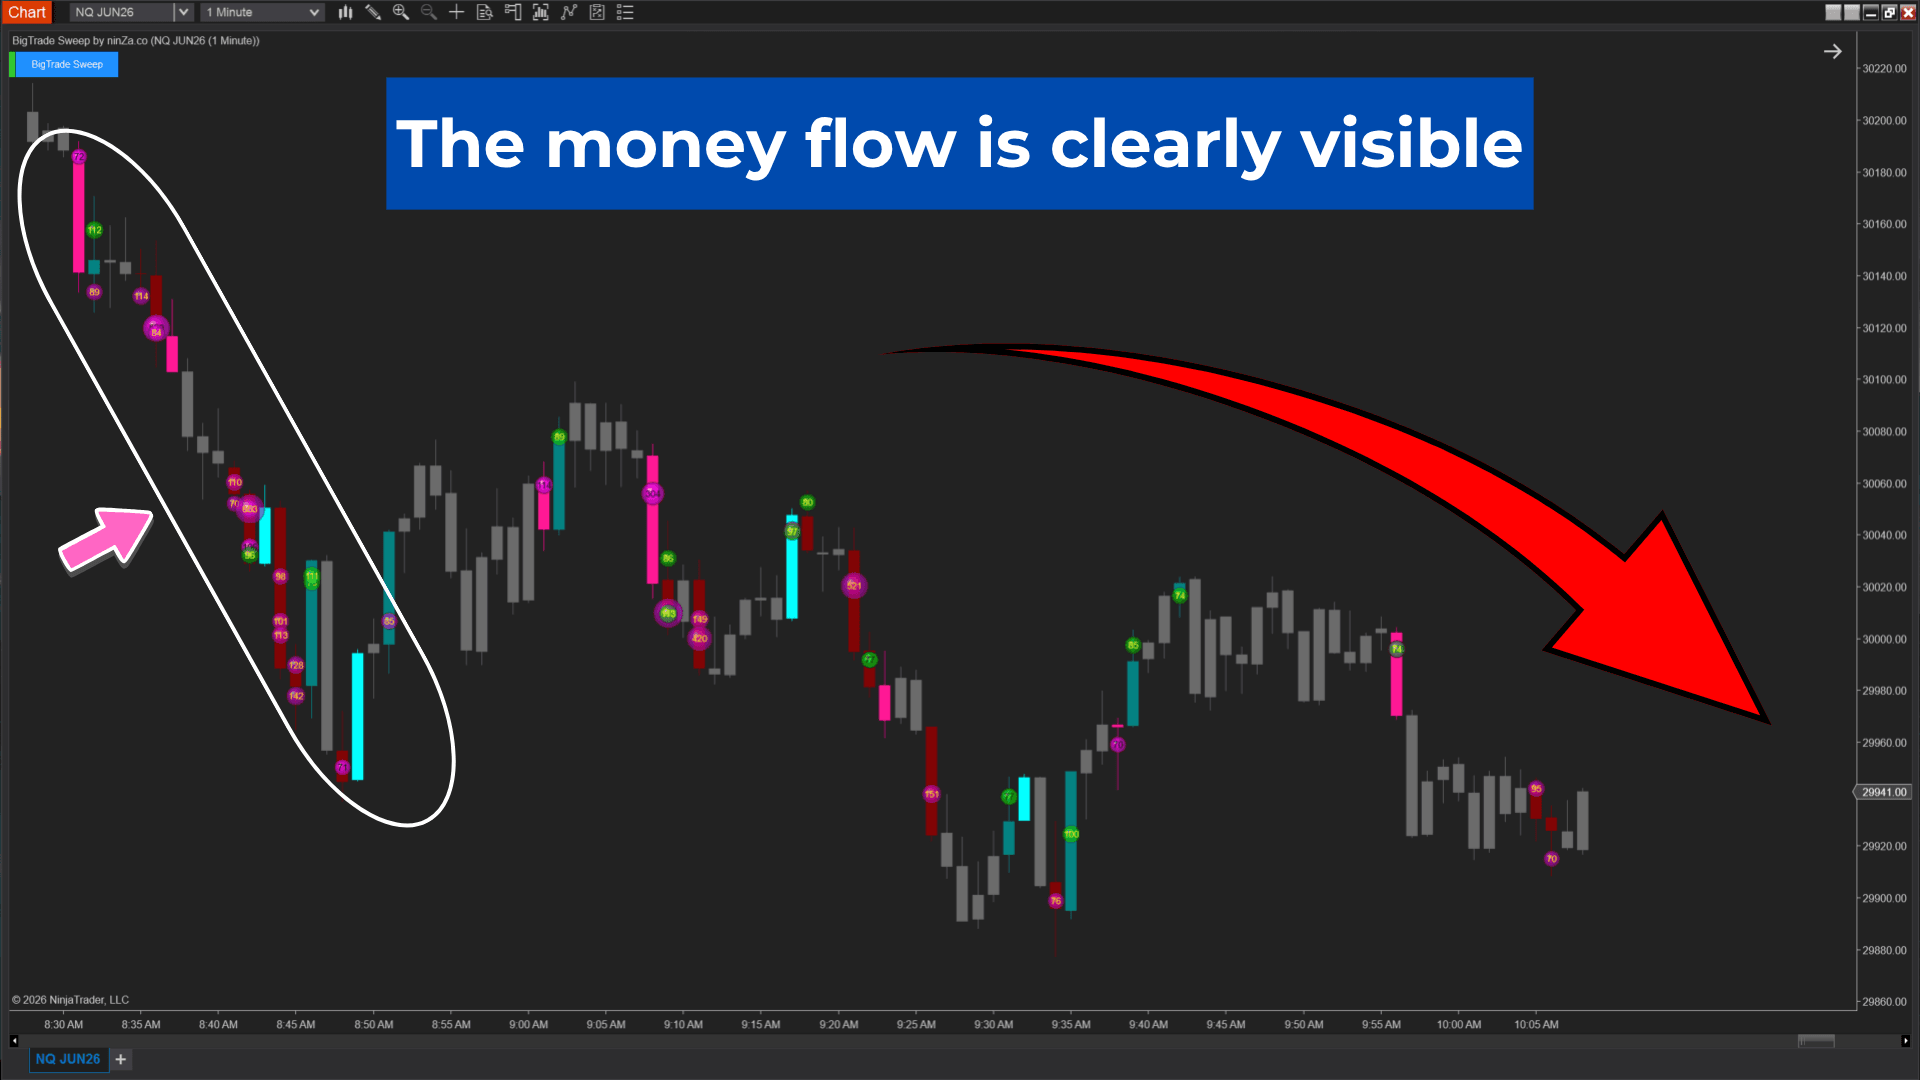
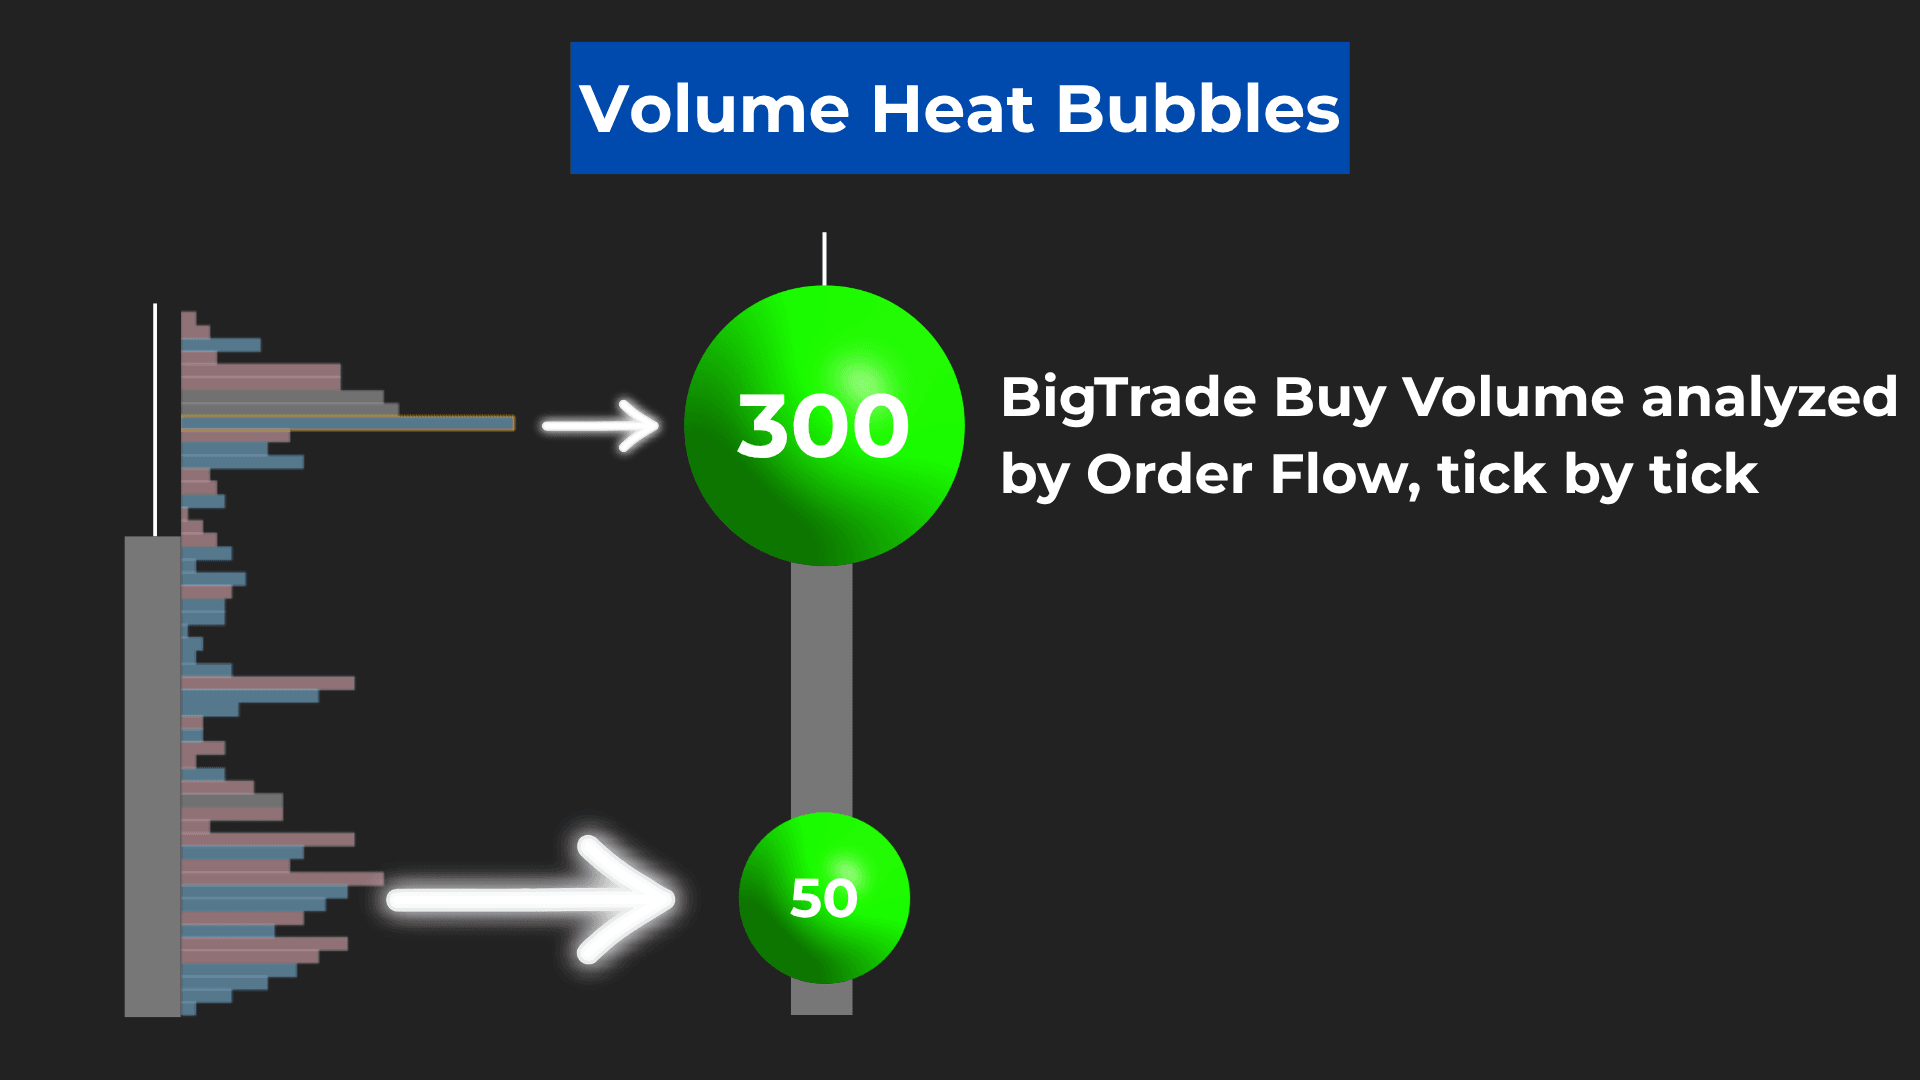
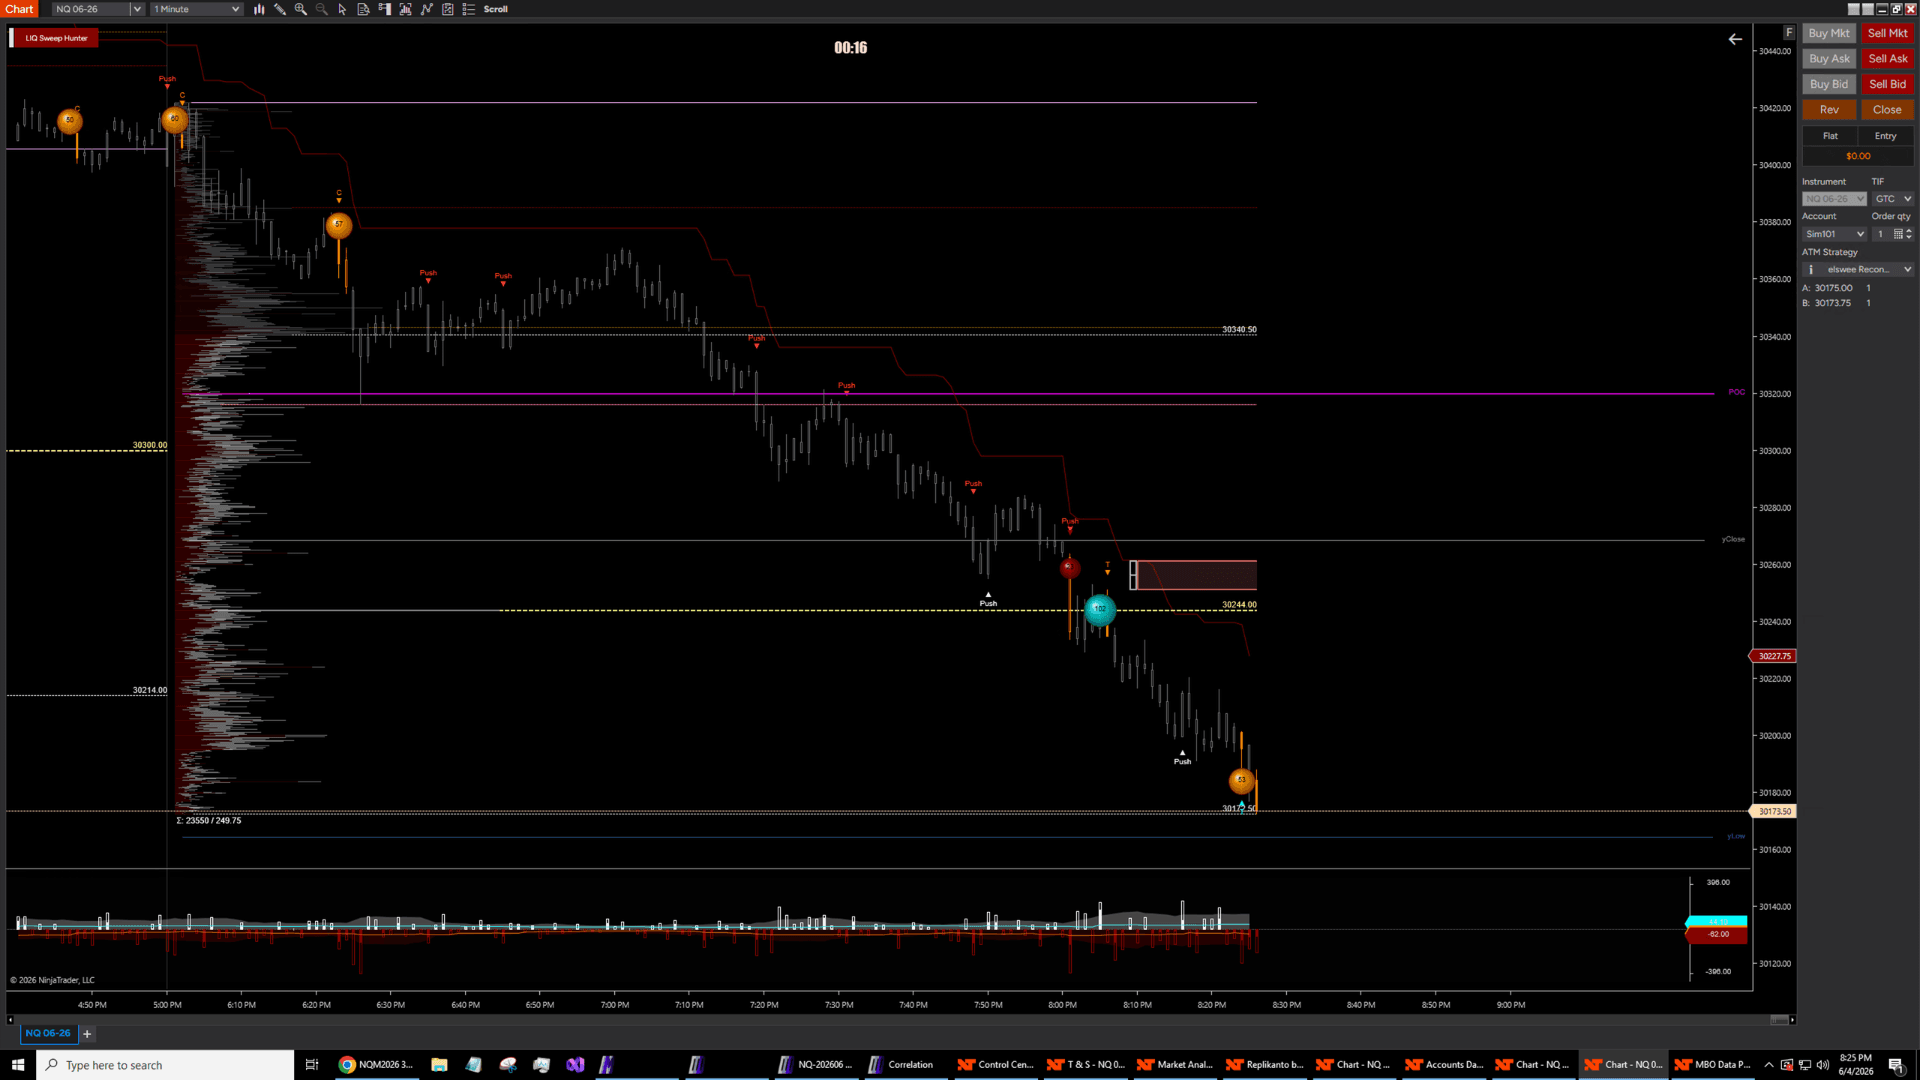
03 / Visual output
Volume Heat Bubbles
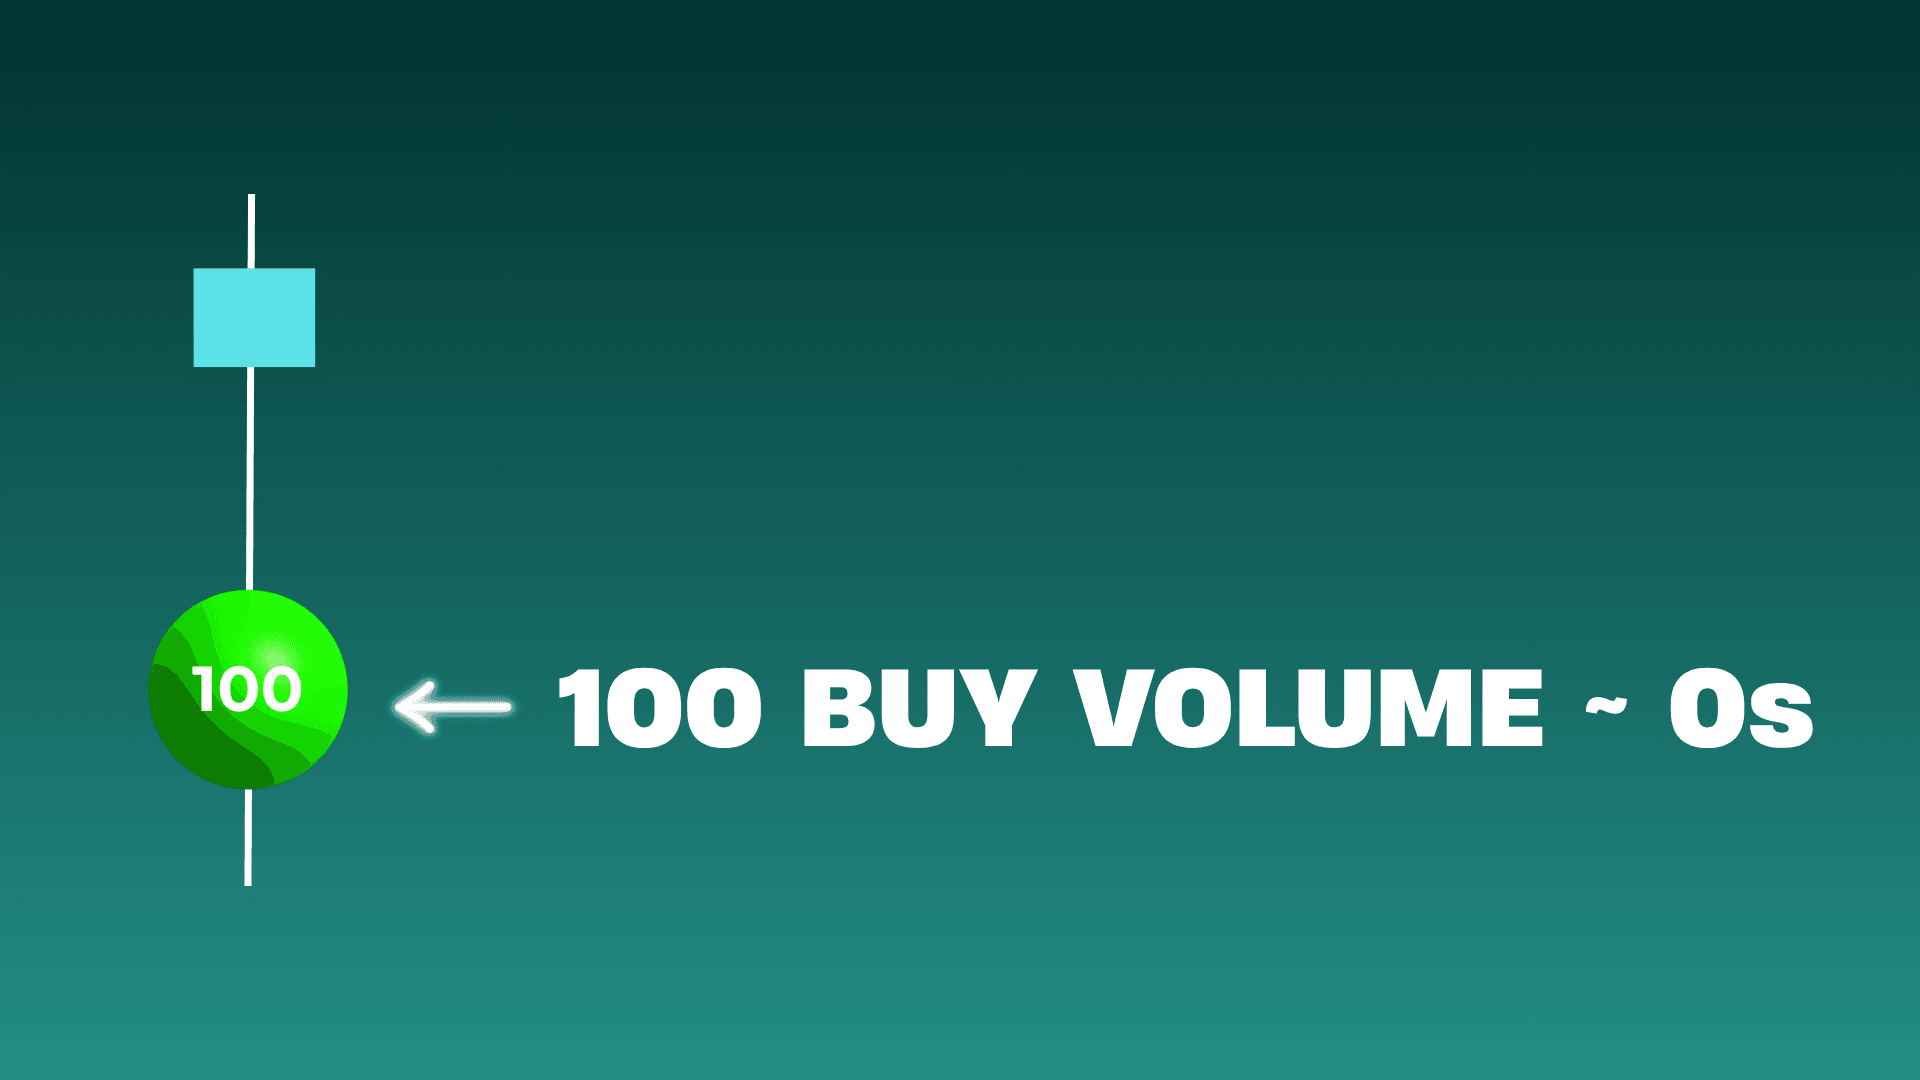
Volume Heat Bubbles turn hidden execution activity into visual hotspots directly on the chart.
Each bubble marks a price level where large liquidity rapidly entered the market.
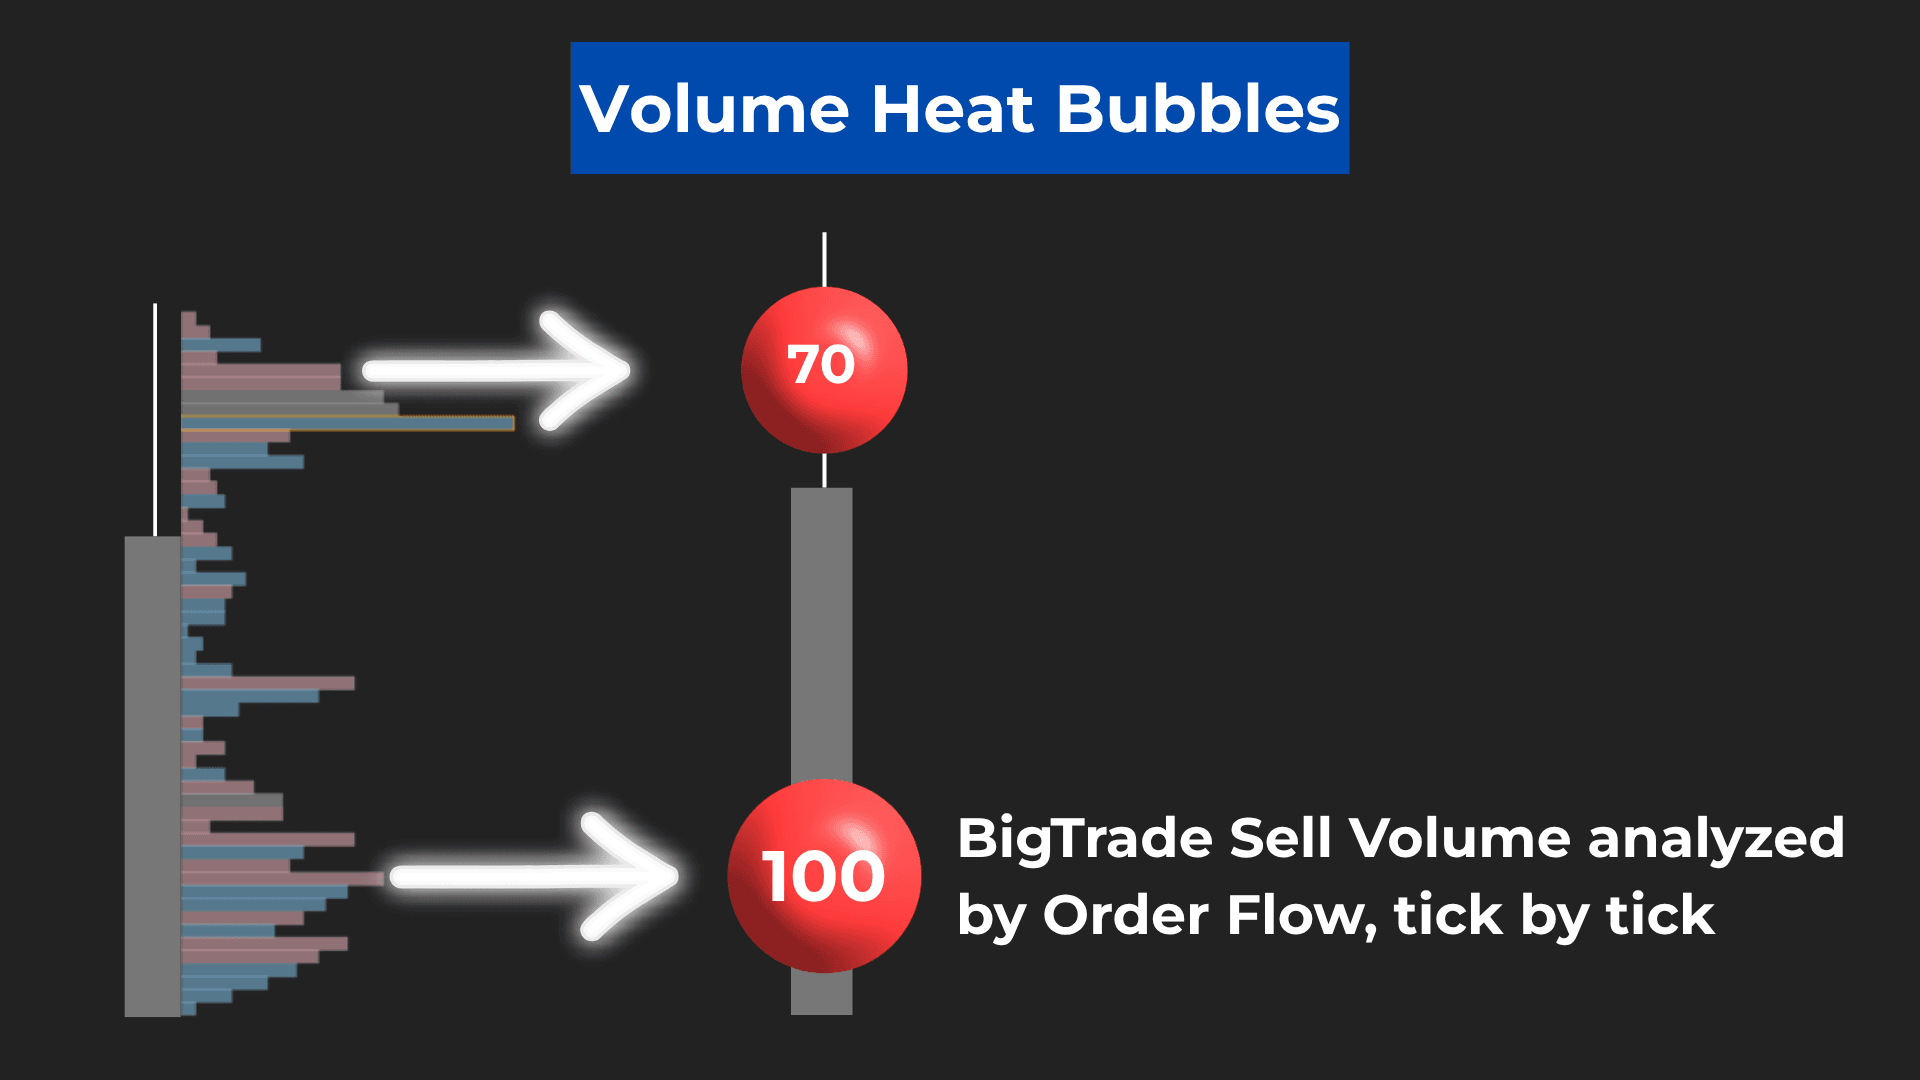
Faster to read Than Traditional Footprint Data
Instead of manually decoding fast-moving Footprint numbers, you can quickly identify where aggressive liquidity entered the market.
This makes Order Flow analysis faster to process, easier to read, and more actionable during volatile market conditions.
Clusters reveal important price zones
When multiple bubbles cluster around the same price level, it often reveals an area where institutional activity is becoming unusually aggressive compared to the rest of the market.
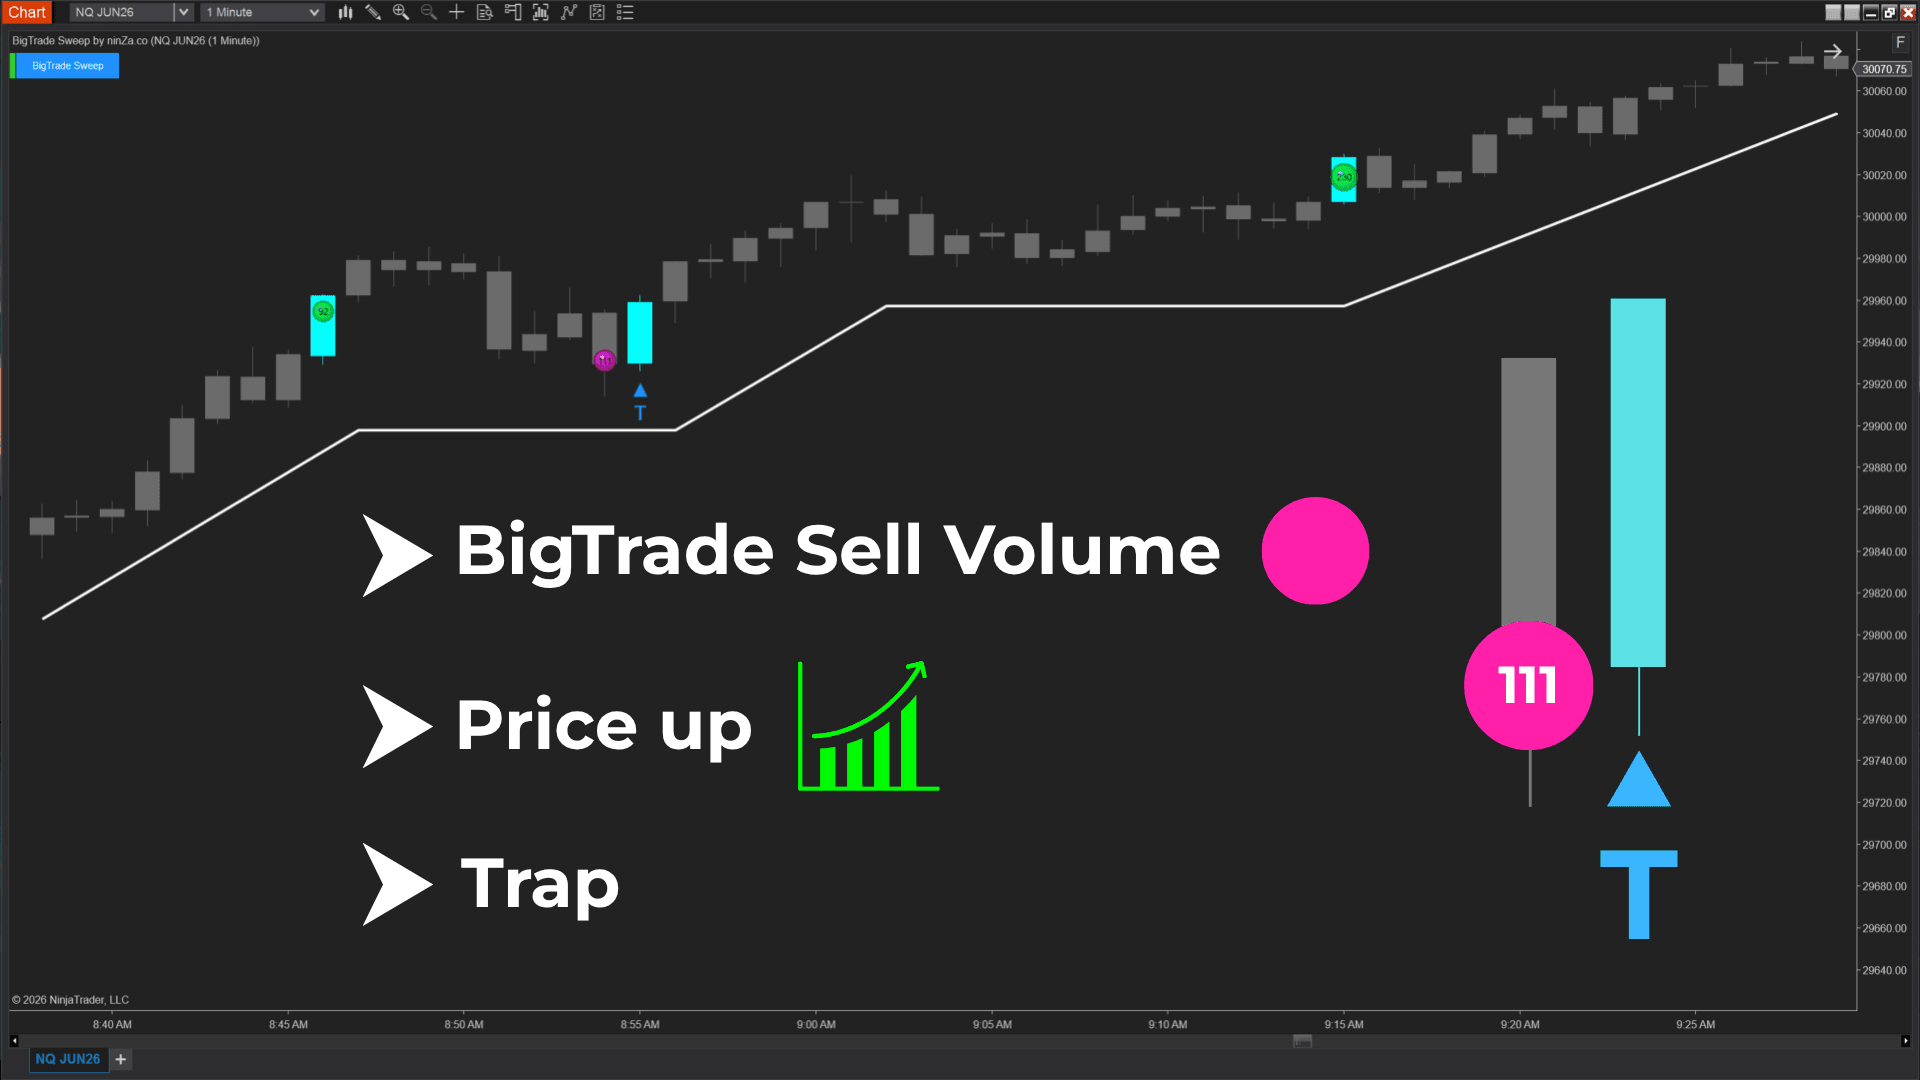
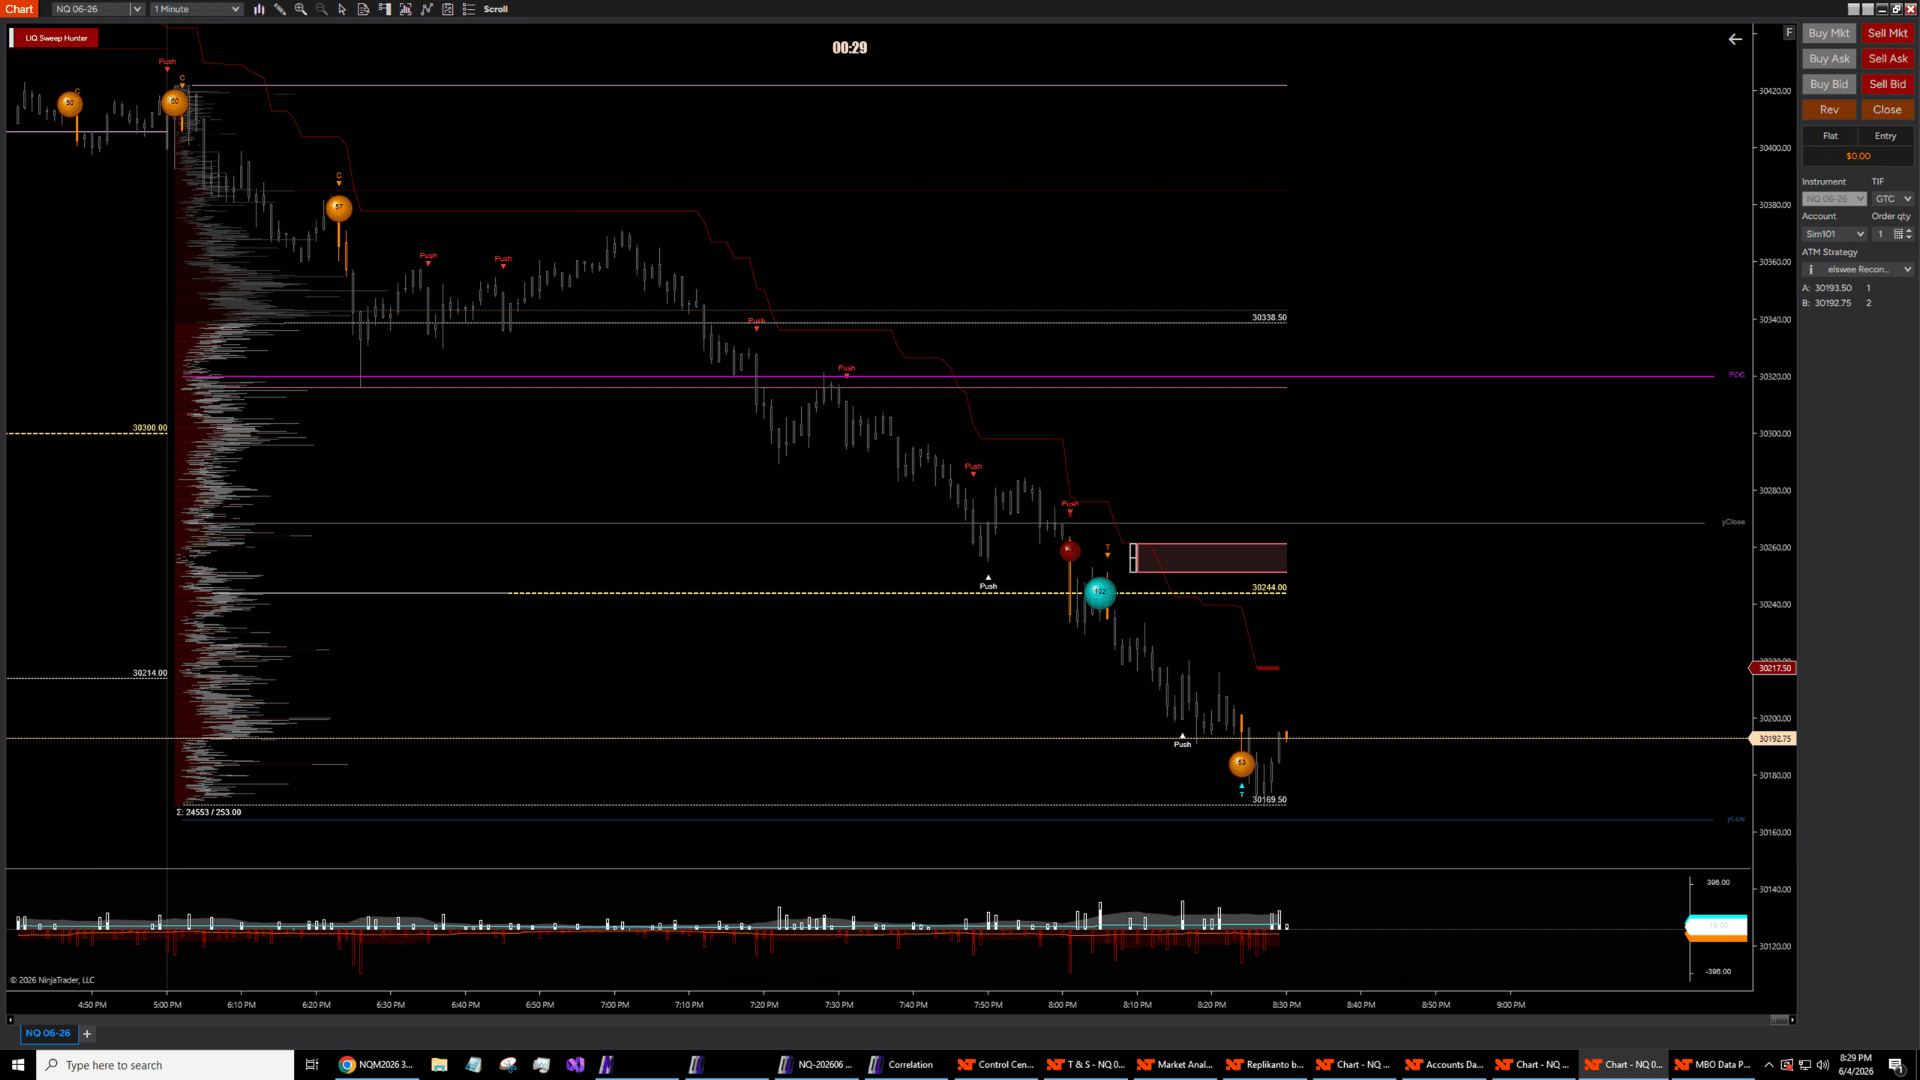
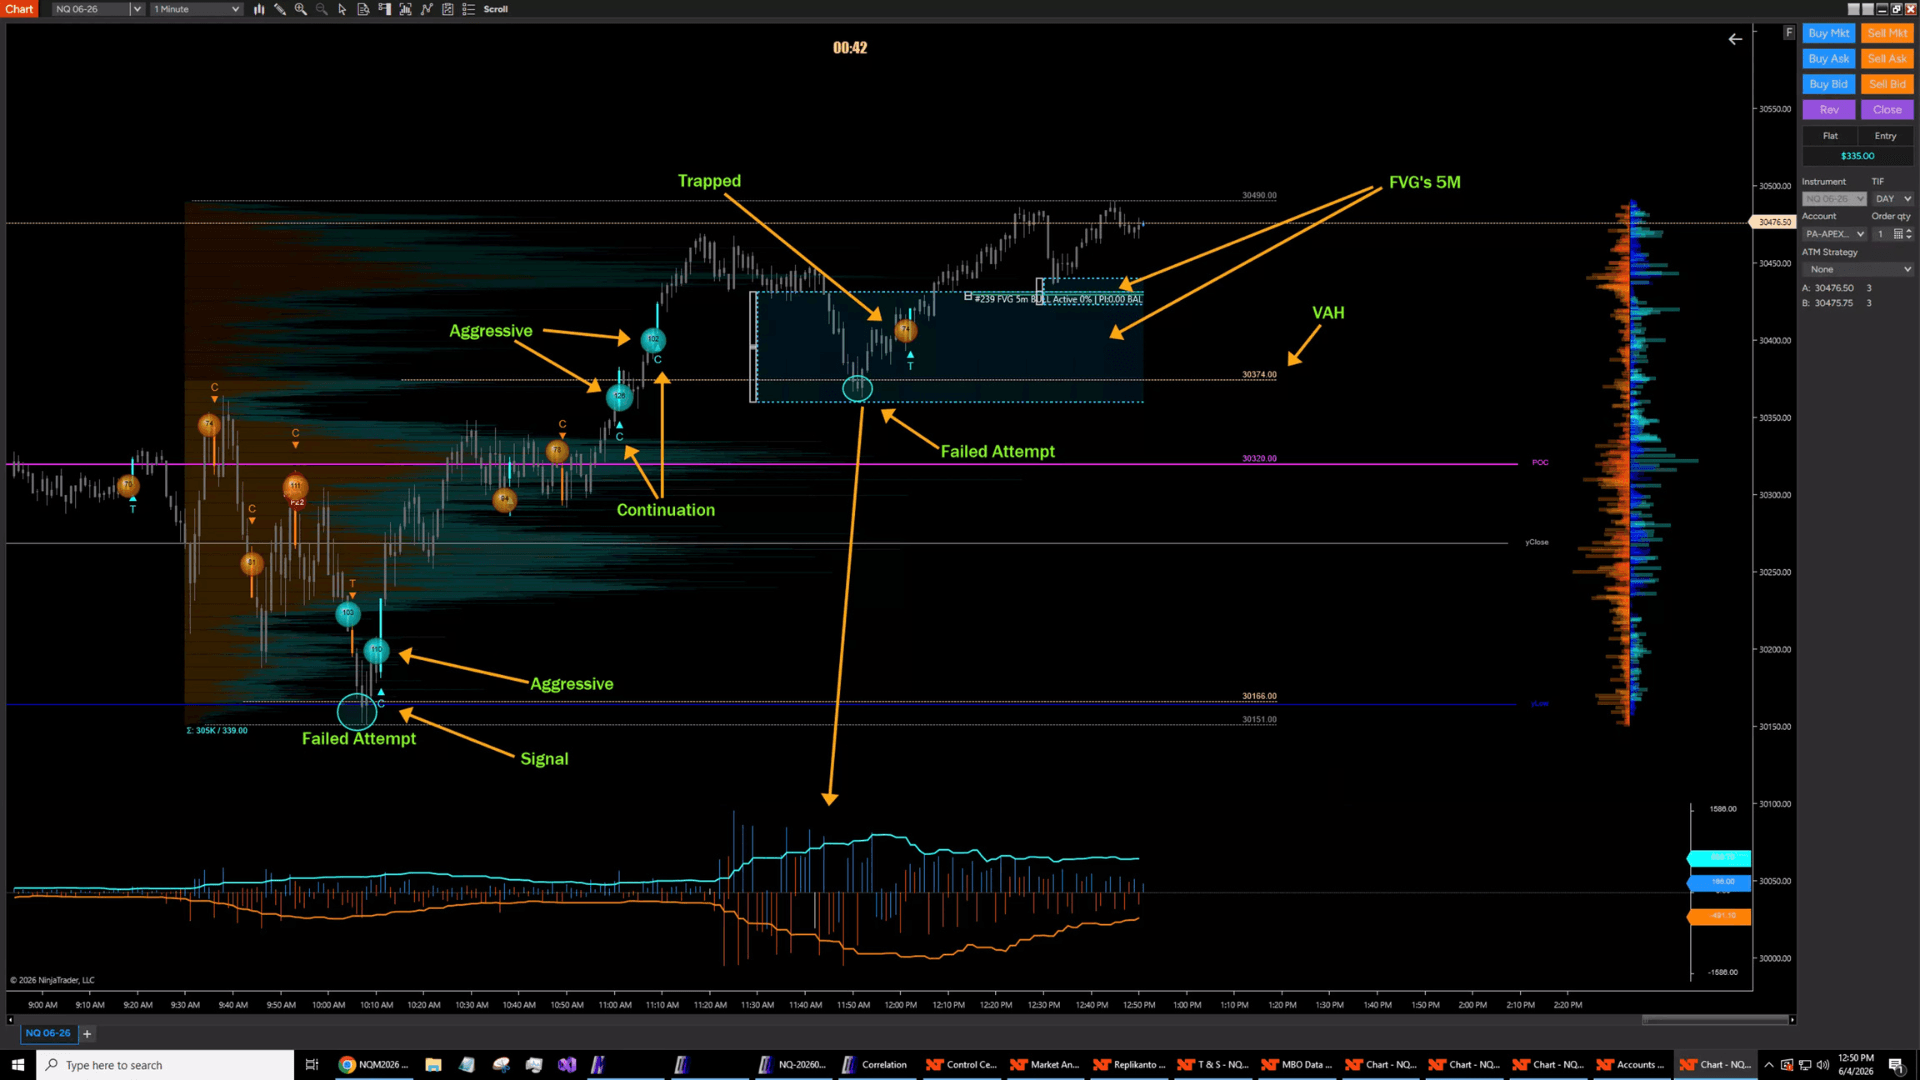
Continuation or Trap after Volume Spikes?
BigTrade Sweep doesn’t stop at detecting volume surges – it reads the market’s reaction afterward.
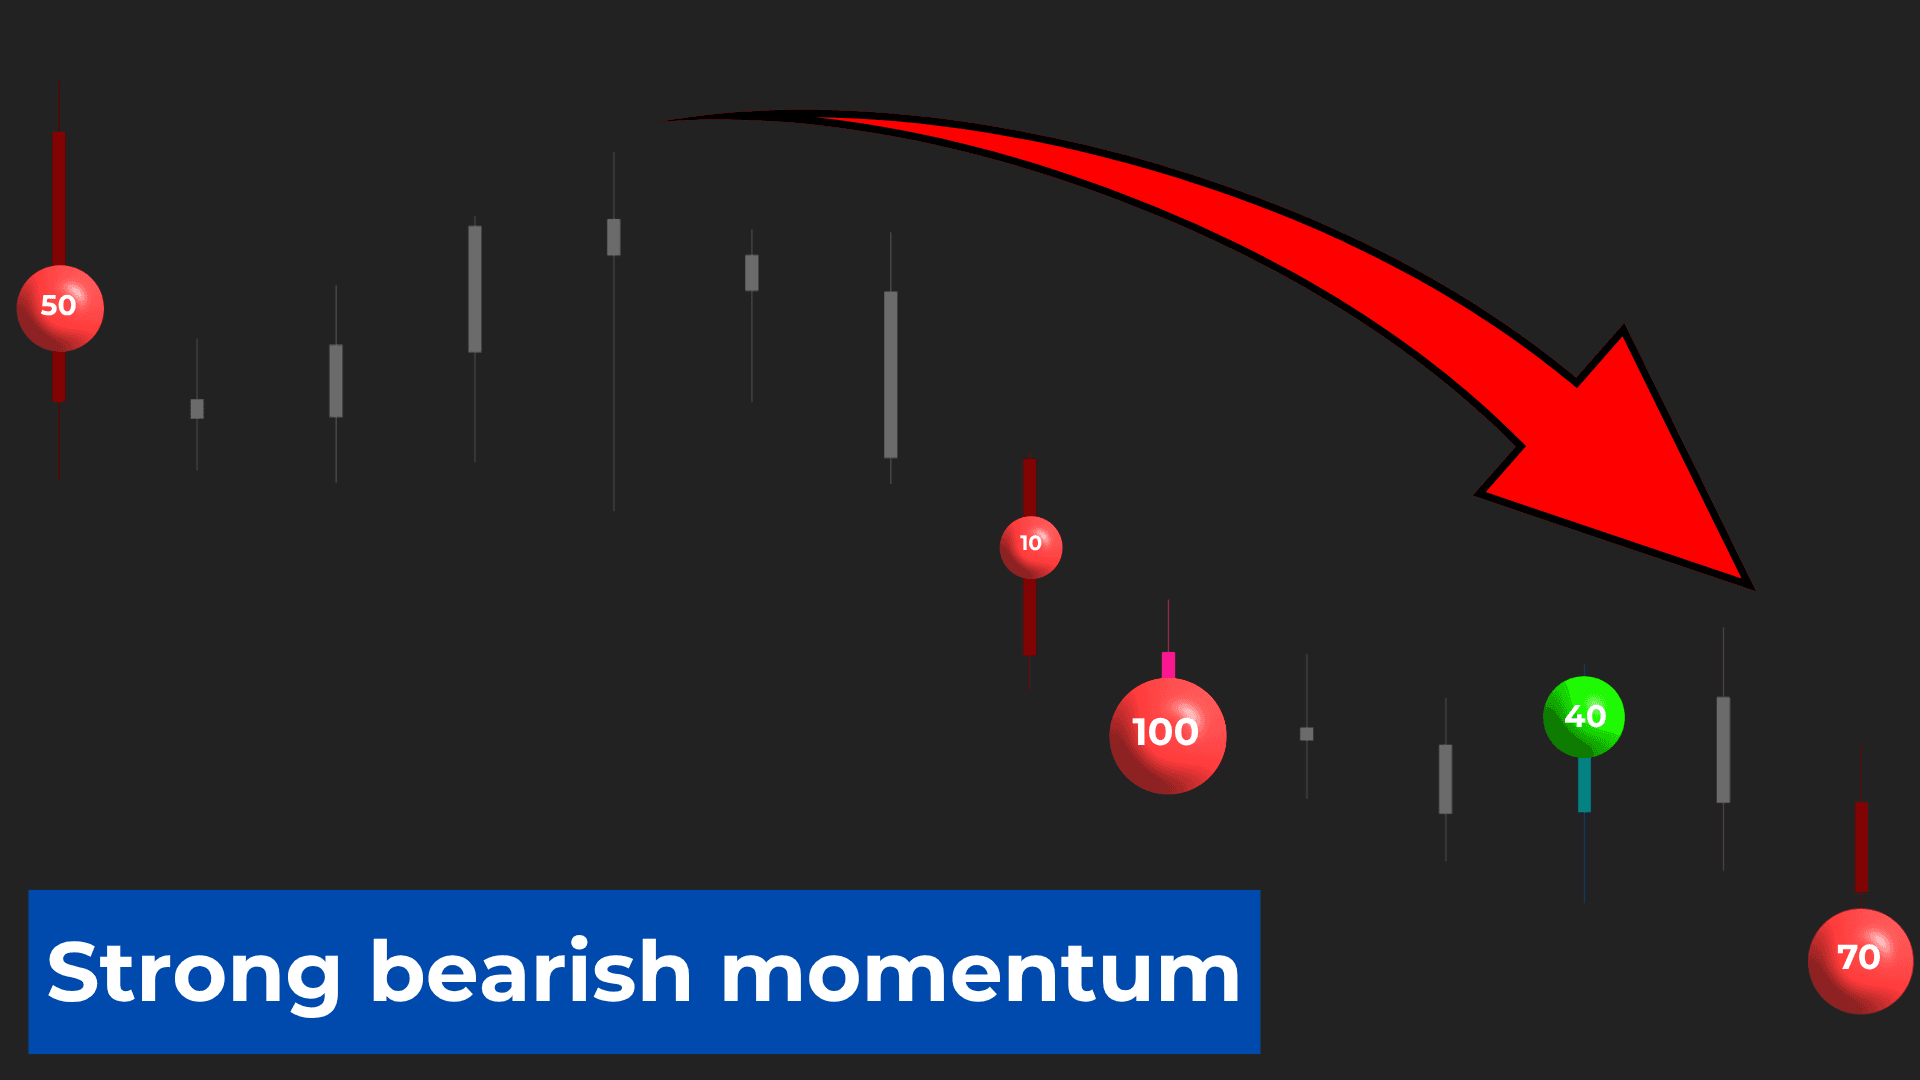
Price reverses after aggressive absorption
The T signal appears when a large wave of aggressive orders pushes price strongly in one direction, but the move is immediately absorbed, and price quickly reverses afterward.
This signals that aggressive traders may have entered into a trap and become stuck in losing positions.
As trapped traders begin exiting, their stop-loss orders can fuel a sharp reversal in the opposite direction.
You can use the T signal to:
- Trade against trapped aggressive participation
- Find reversal entries with tight stop-loss placement near high-volume activity clusters
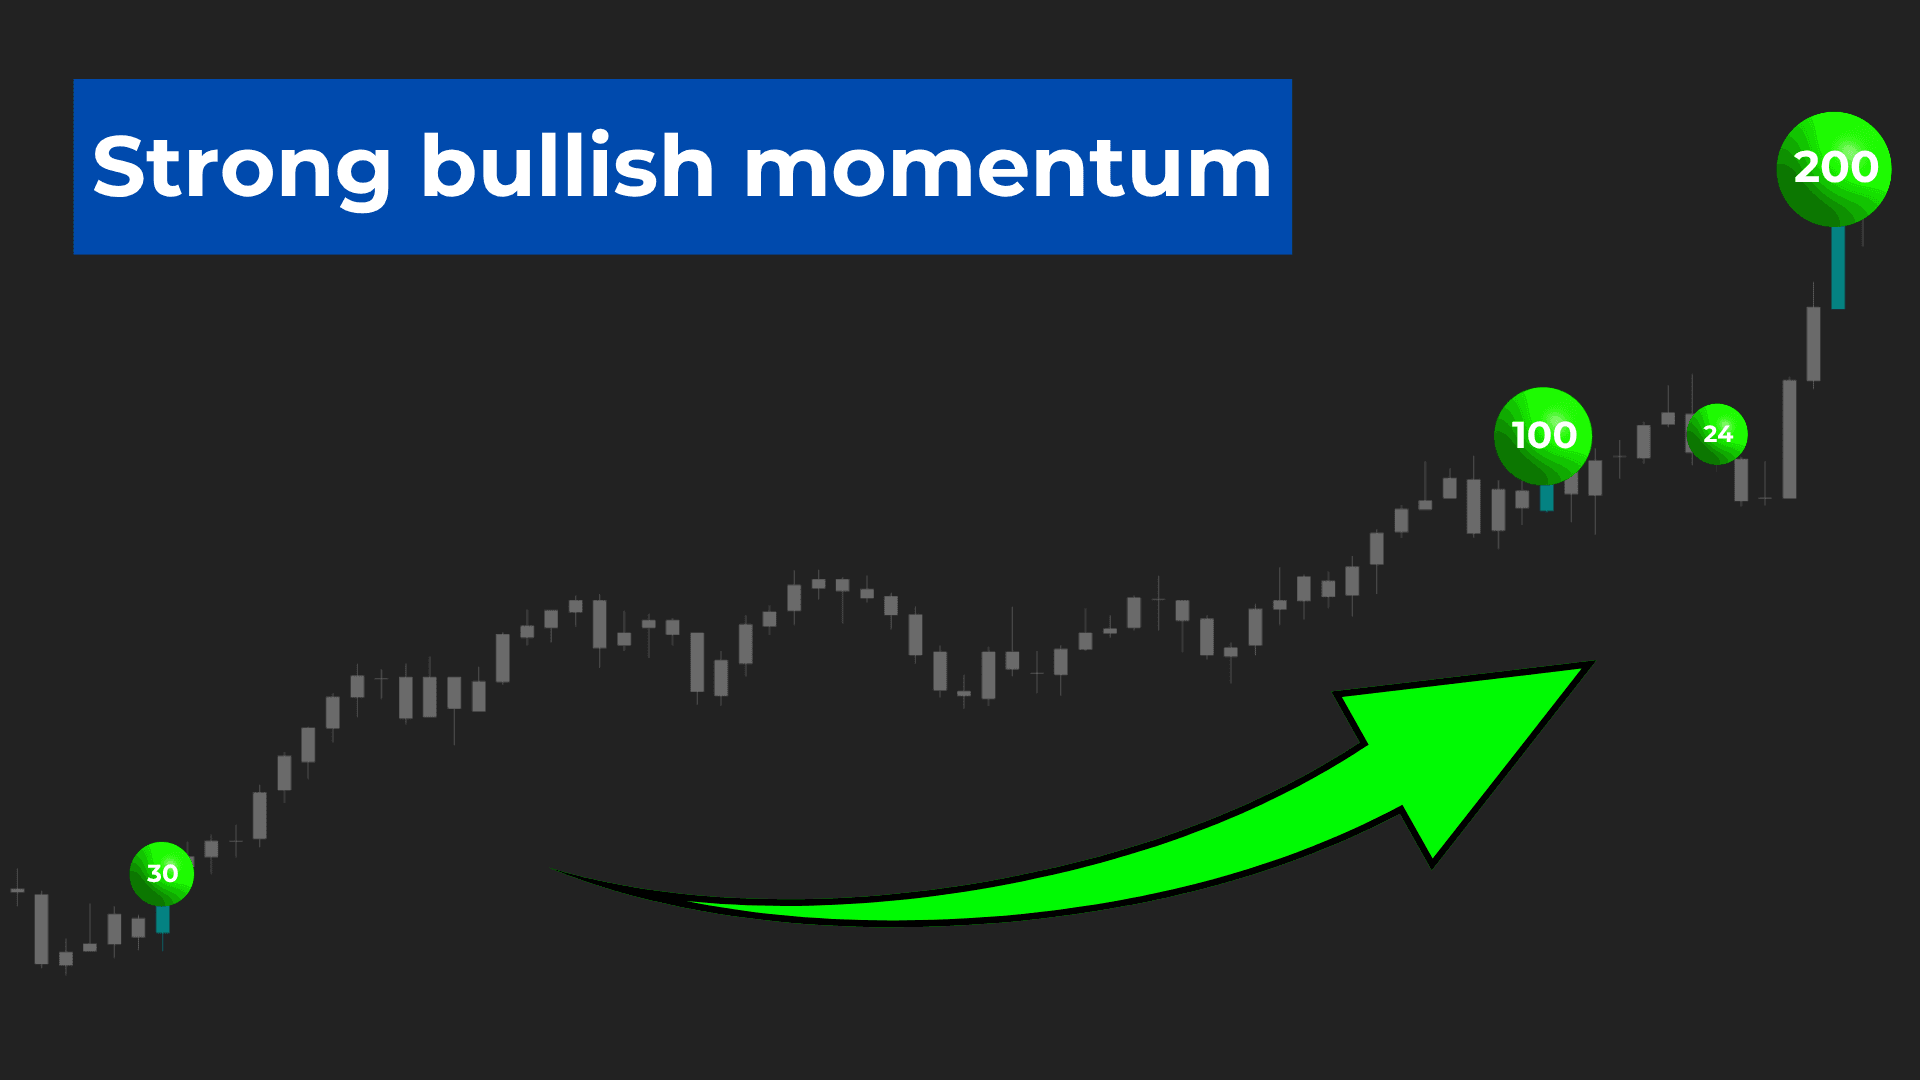
Price continues in the direction of the sweep
The C signal appears when aggressive liquidity sweeps through the order book and price continues moving strongly in the same direction as the large volume activity.
This confirms that the move is not being absorbed and that aggressive buyers or sellers remain in control of the market.
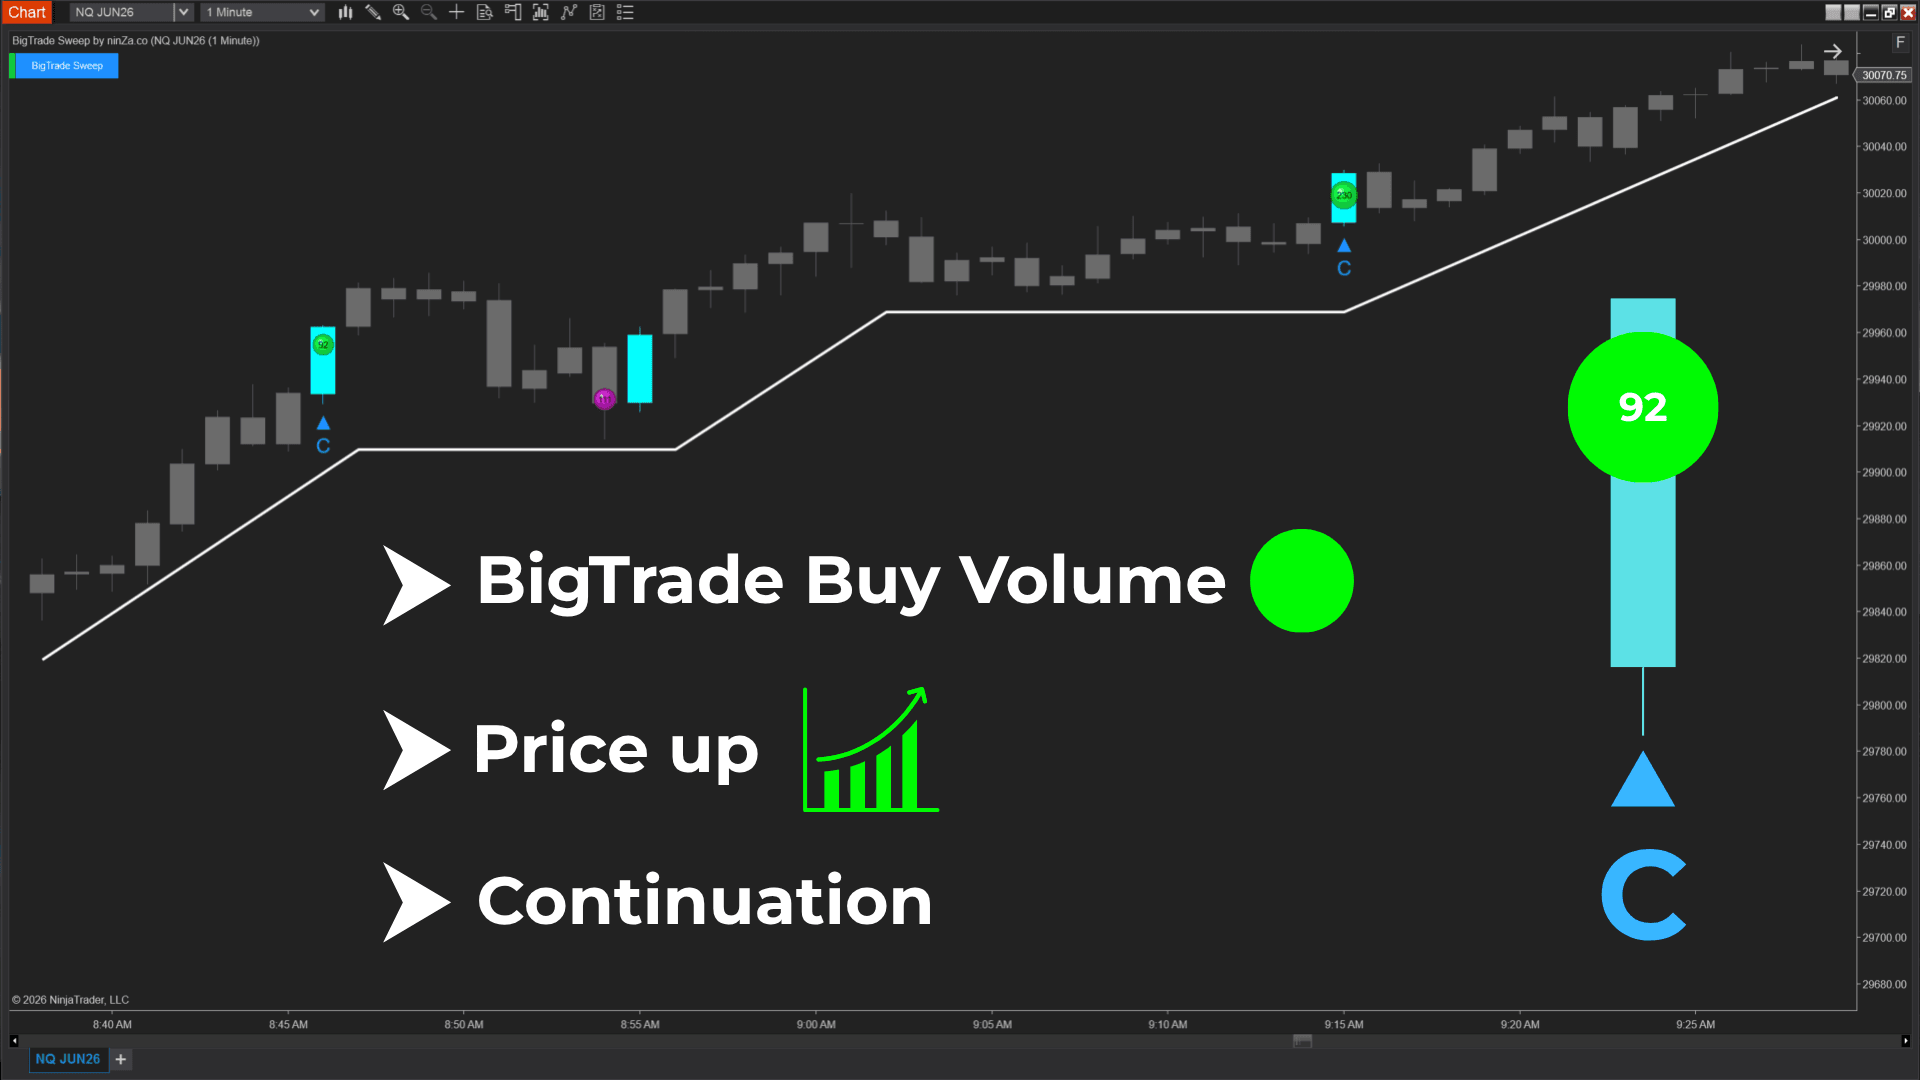
You can use the C signal to:
- Confirm momentum continuation
- Enter alongside strong directional participation
- Scale into existing positions as Smart Money continues driving price forward
See how BigTrade Sweep reads Smart Money activity
How traders are using BigTrade Sweep
BigTrade Sweep helps traders identify unusually large buy and sell executions at the tick level, revealing where aggressive liquidity is entering the market in real time.
In this video, you'll learn how BigTrade Sweep distinguishes between Trap and Continuation scenarios, helping traders better understand whether large participants are being absorbed or successfully driving price movement.
In this video, we put BigTrade Sweep to the test during a live NQ 1-minute trading session and recorded 3 consecutive winning trades.
See how the signals performed in real market conditions and how we used Captain Optimus Strong for trade execution.
In this video, James explores how BigTrade Sweep highlights aggressive market participation and confirms whether that liquidity is being accepted by price.
The result is a more objective way to evaluate momentum and identify higher-conviction trading opportunities.
A big trade appears. Volume expands. But volume alone doesn't reveal market intent. The key is understanding whether larger participants are supporting the move or absorbing it.
Explore real trading examples that show how liquidity sweeps and market reactions can provide valuable context during live market conditions.
 2026_05_27 (3_52_33 AM)_1780454564129.png)
 2026_05_11 (4_26_23 AM)_1780454563520.png)
 2026_05_27 (4_18_24 AM)_1780454563501.png)
 2026_05_26 (3_59_38 AM)_1780454564255.png)
 2026_05_27 (4_13_14 AM)_1780454564641.png)
 2026_05_27 (4_13_27 AM)_1780454564800.png)
 2026_05_27 (4_14_29 AM)_1780454566437.png)
 2026_05_27 (4_38_52 AM)_1780454566589.png)
 2026_05_27 (4_14_45 AM)_1780454566617.png)
 2026_05_22 (4_39_08 AM)_1780454566724.png)
 2026_05_27 (4_15_26 AM)_1780454567050.png)
 2026_05_27 (4_15_00 AM)_1780454568133.png)
 2026_05_20 (4_39_22 AM)_1780454568152.png)
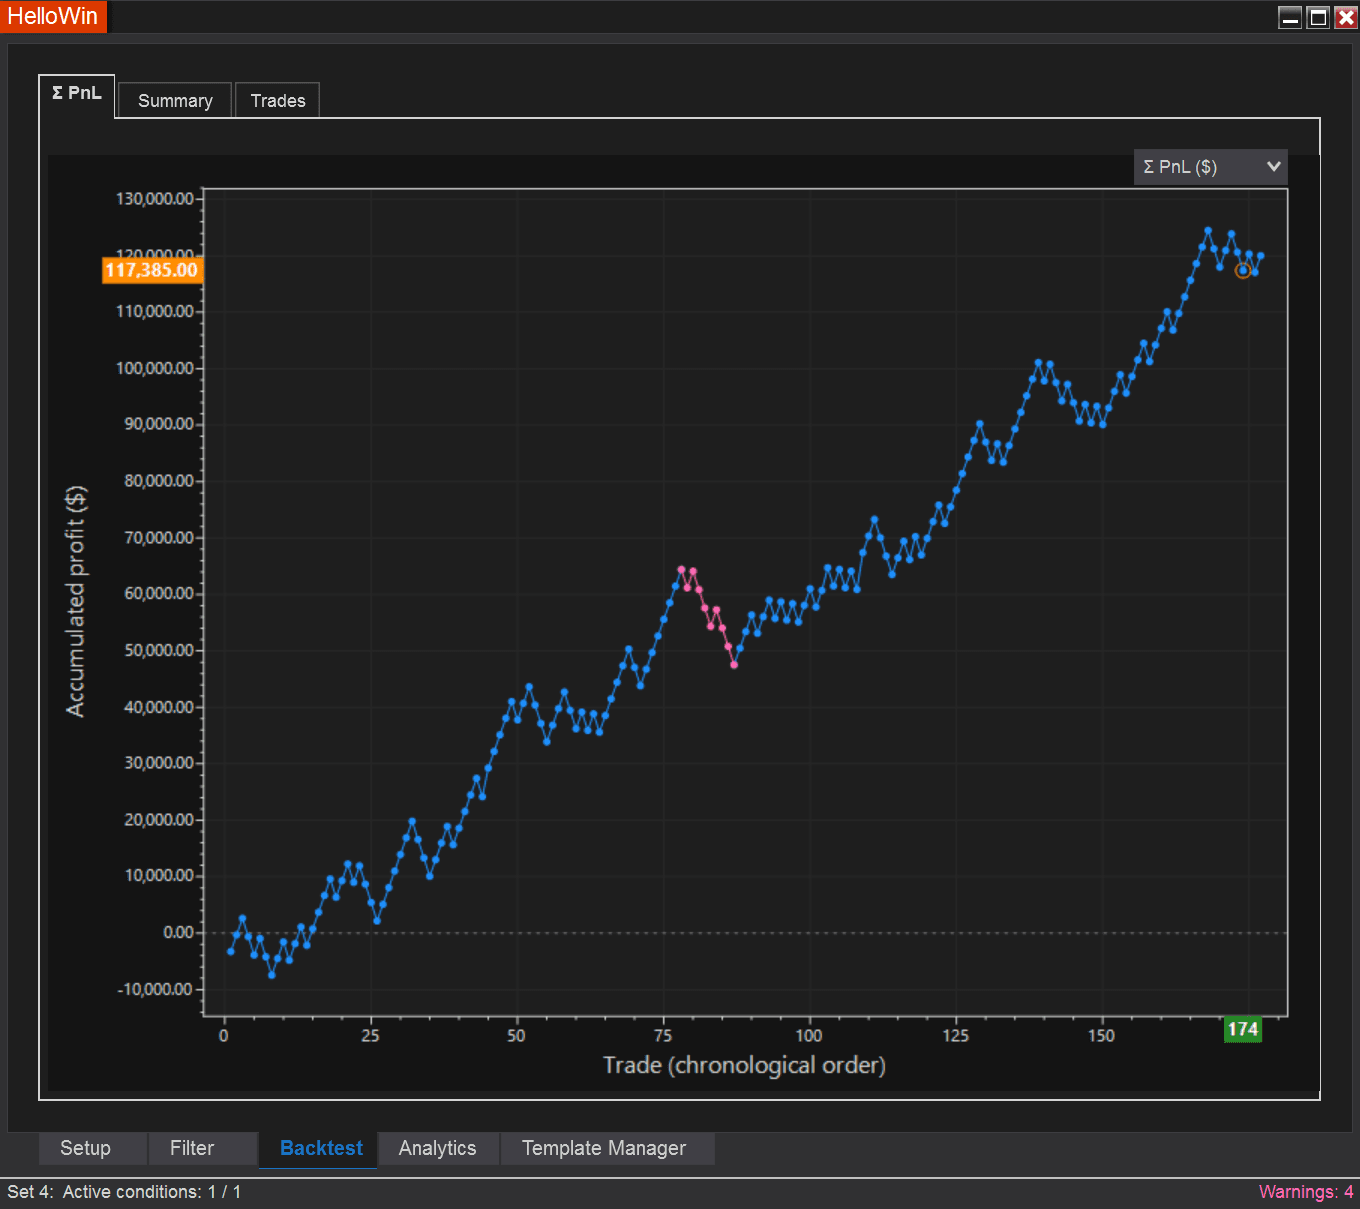
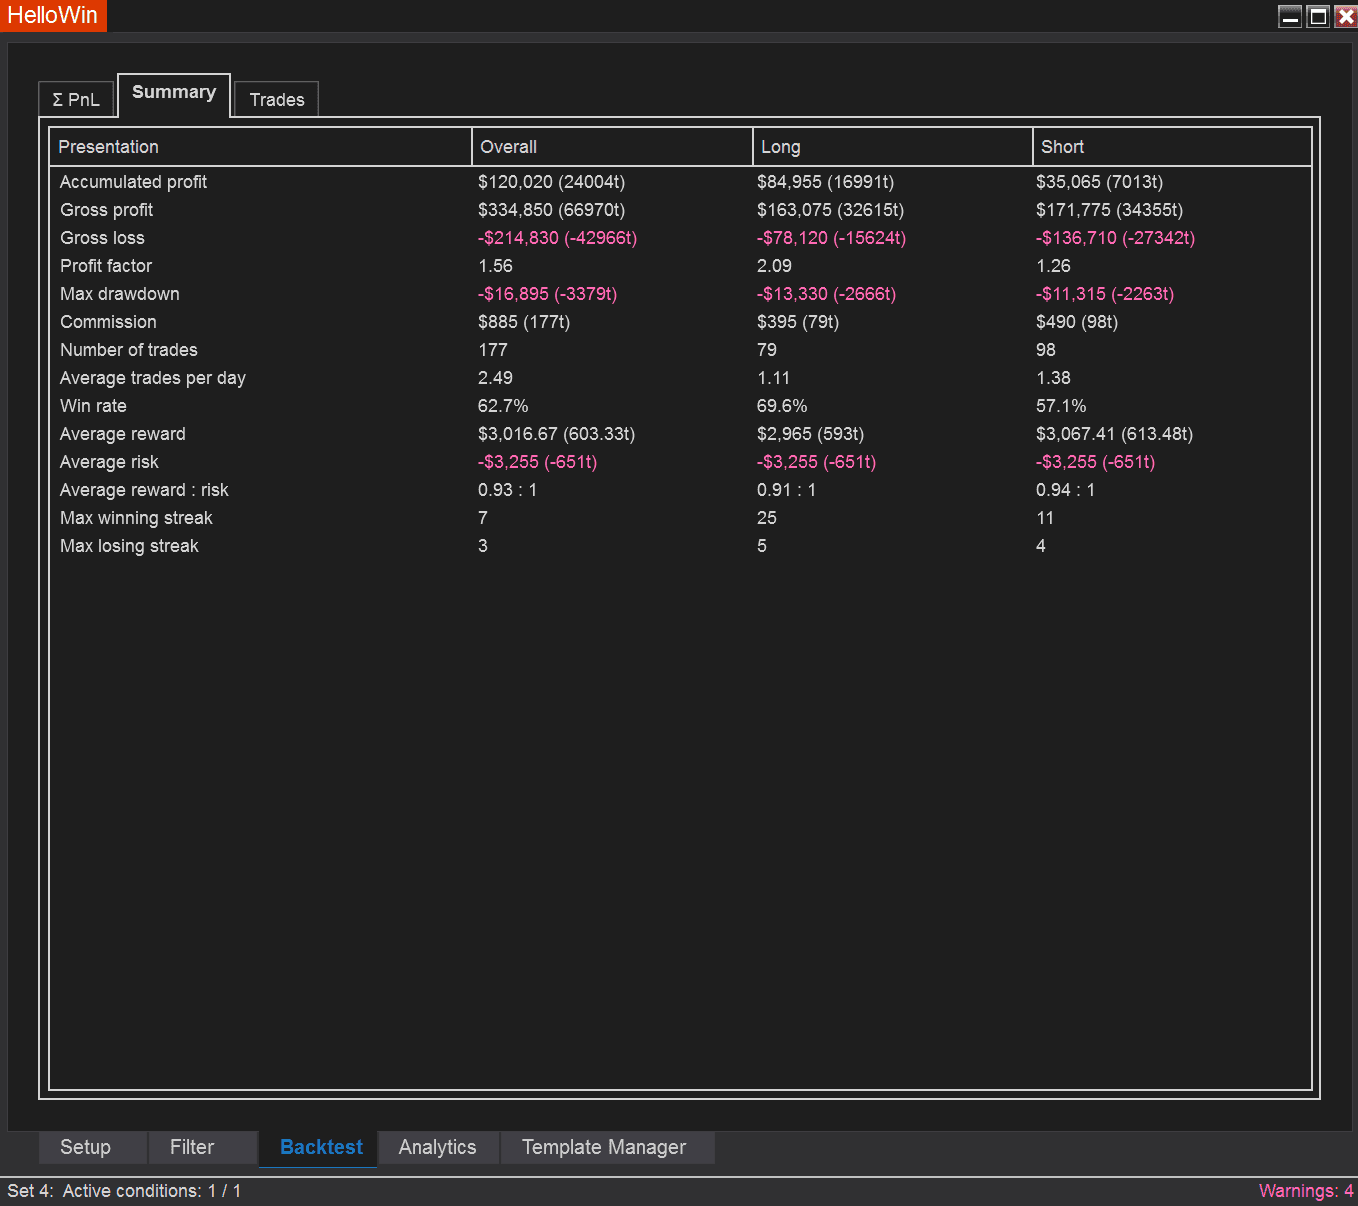
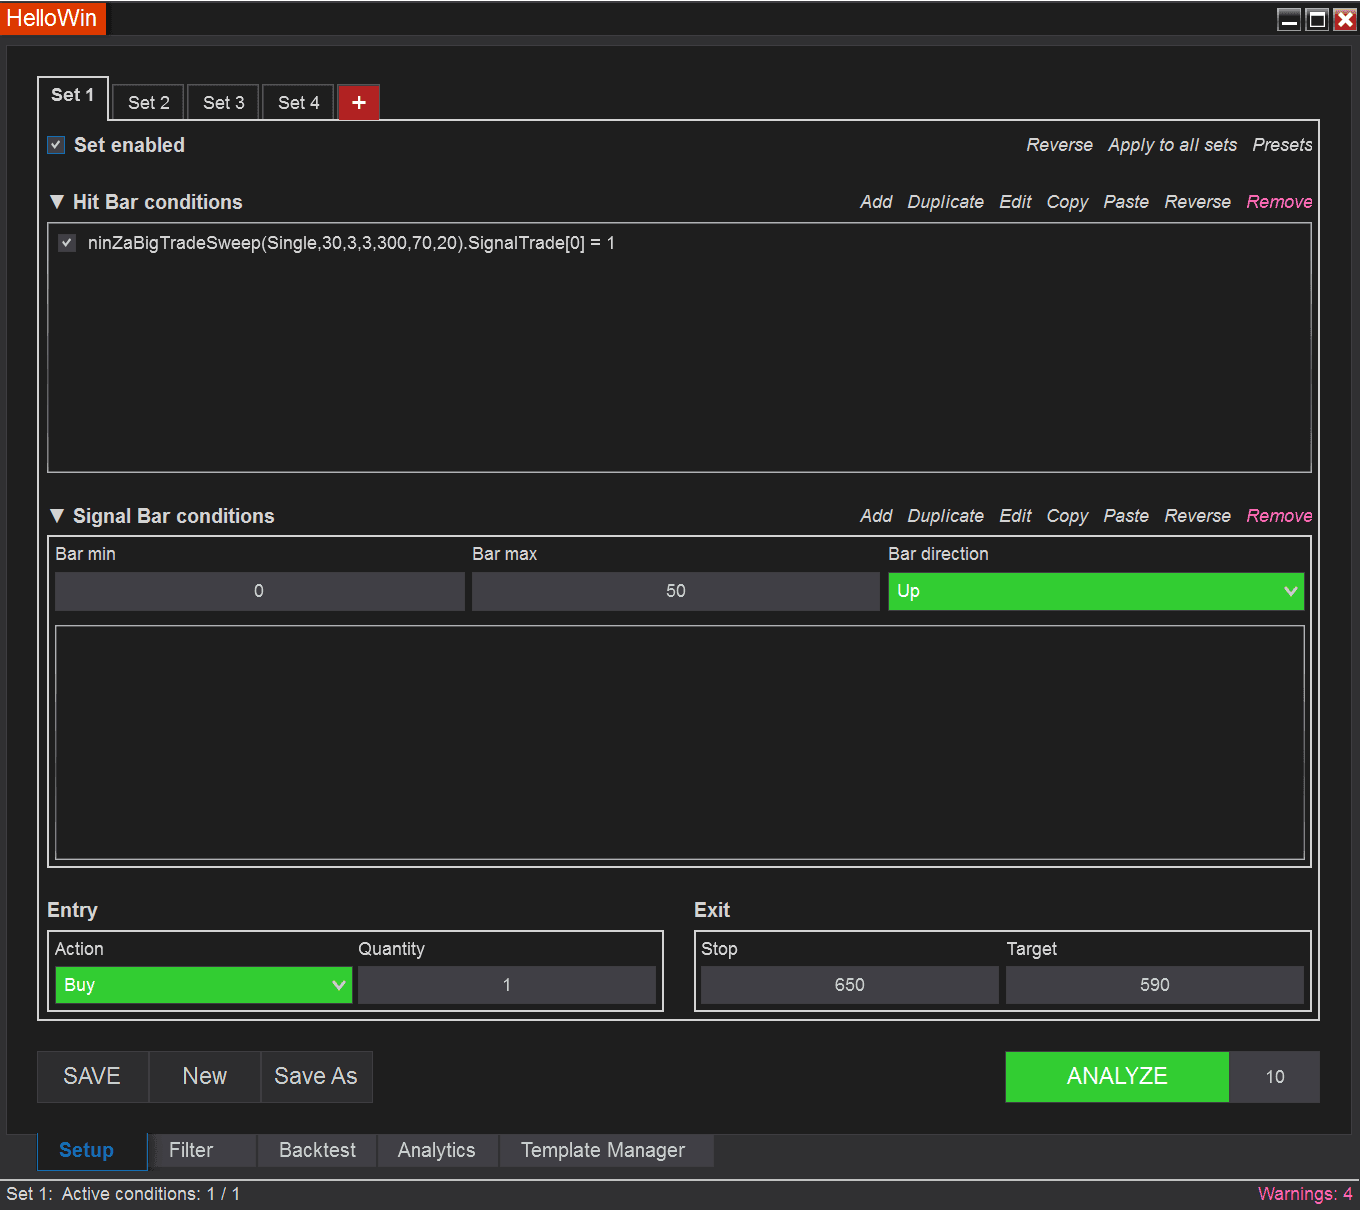
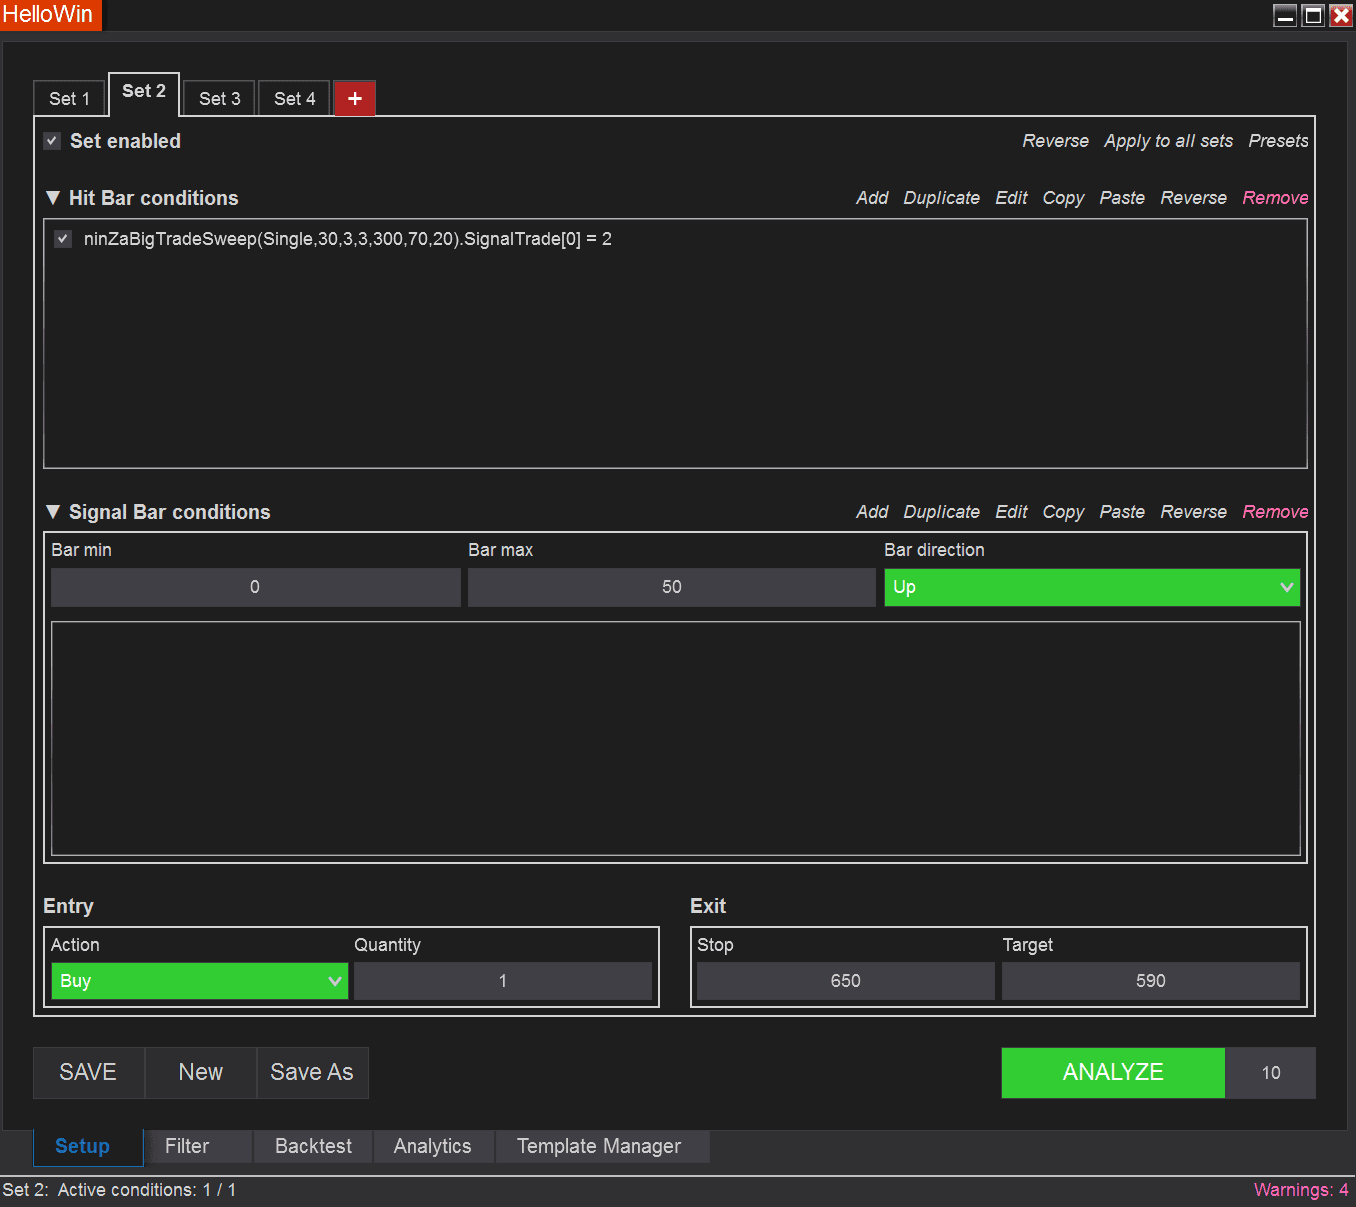
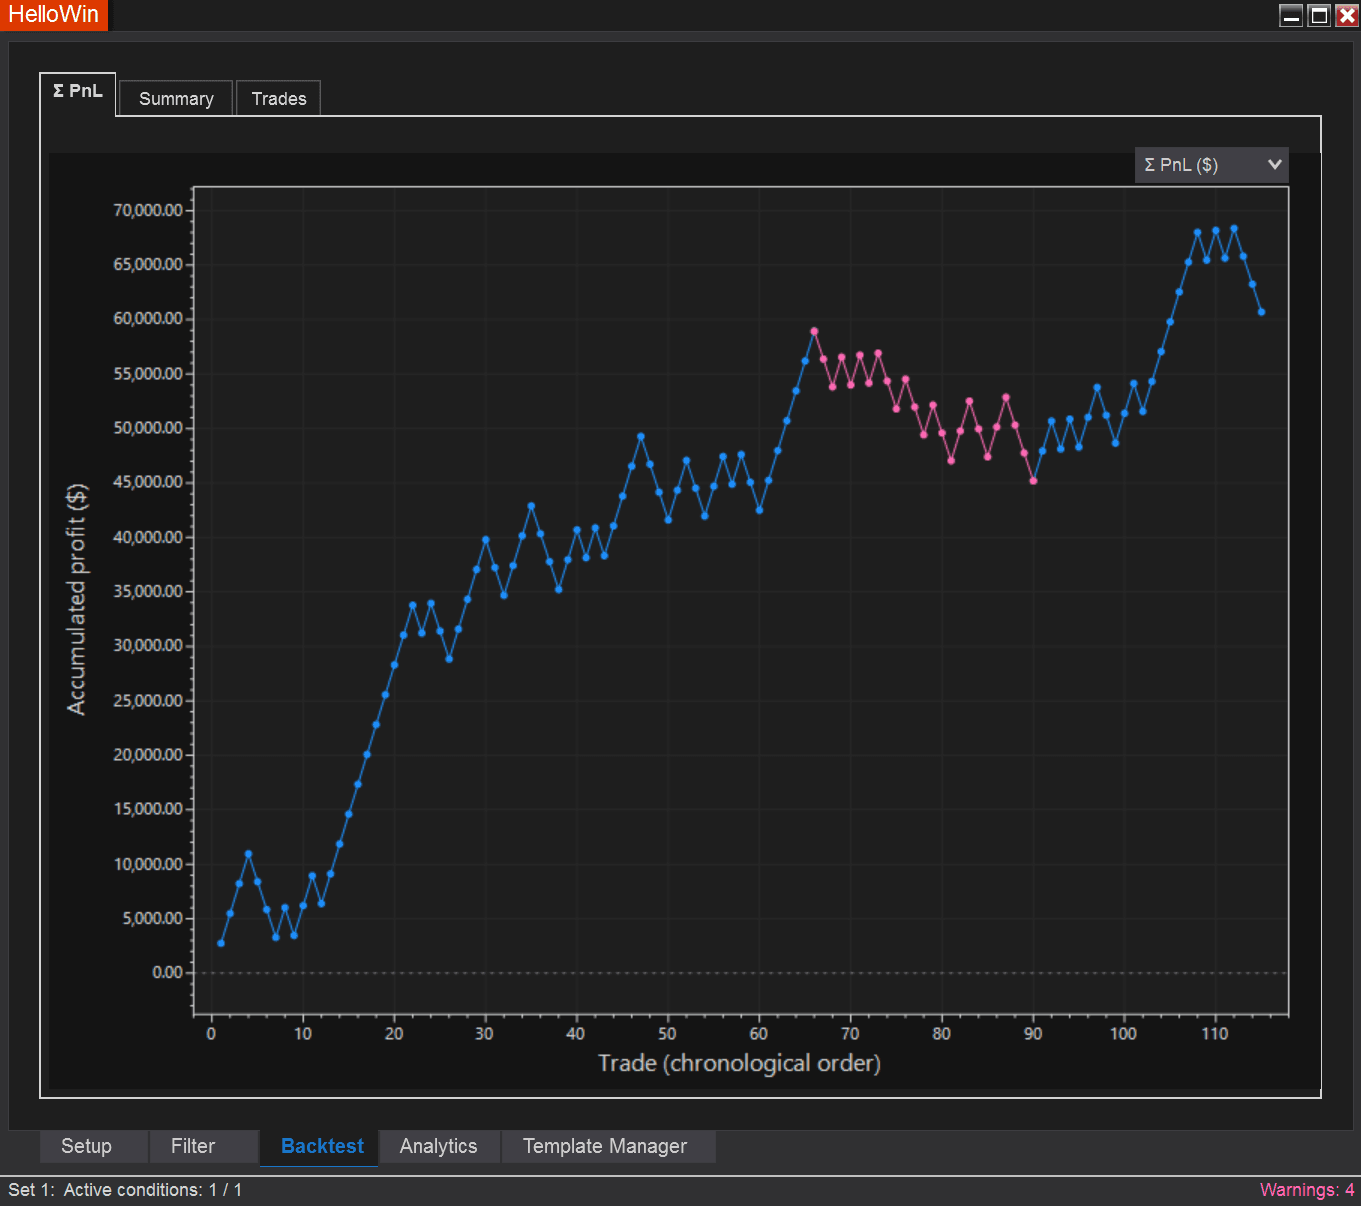
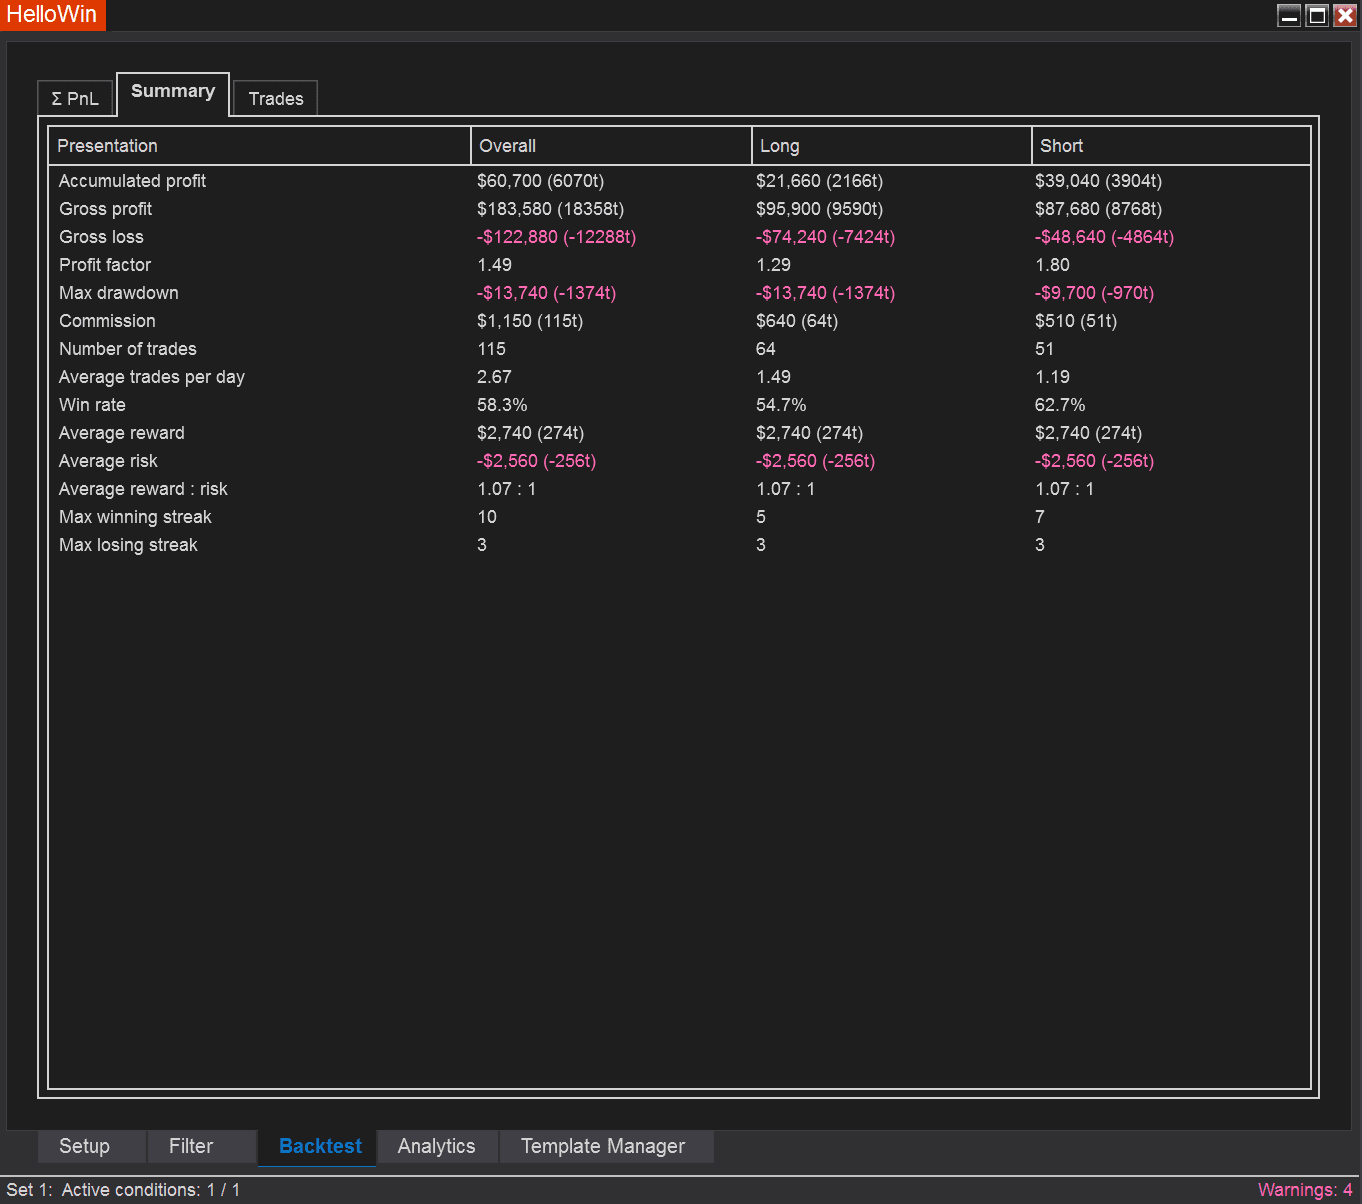
Check out the 100-day backtest results of BigTrade Sweep on the 1-minute NQ chart


Check out the 60-day backtest results of BigTrade Sweep on the 5-minute GC chart


Let's take a look at feedback from professional traders using BigTrade Sweep
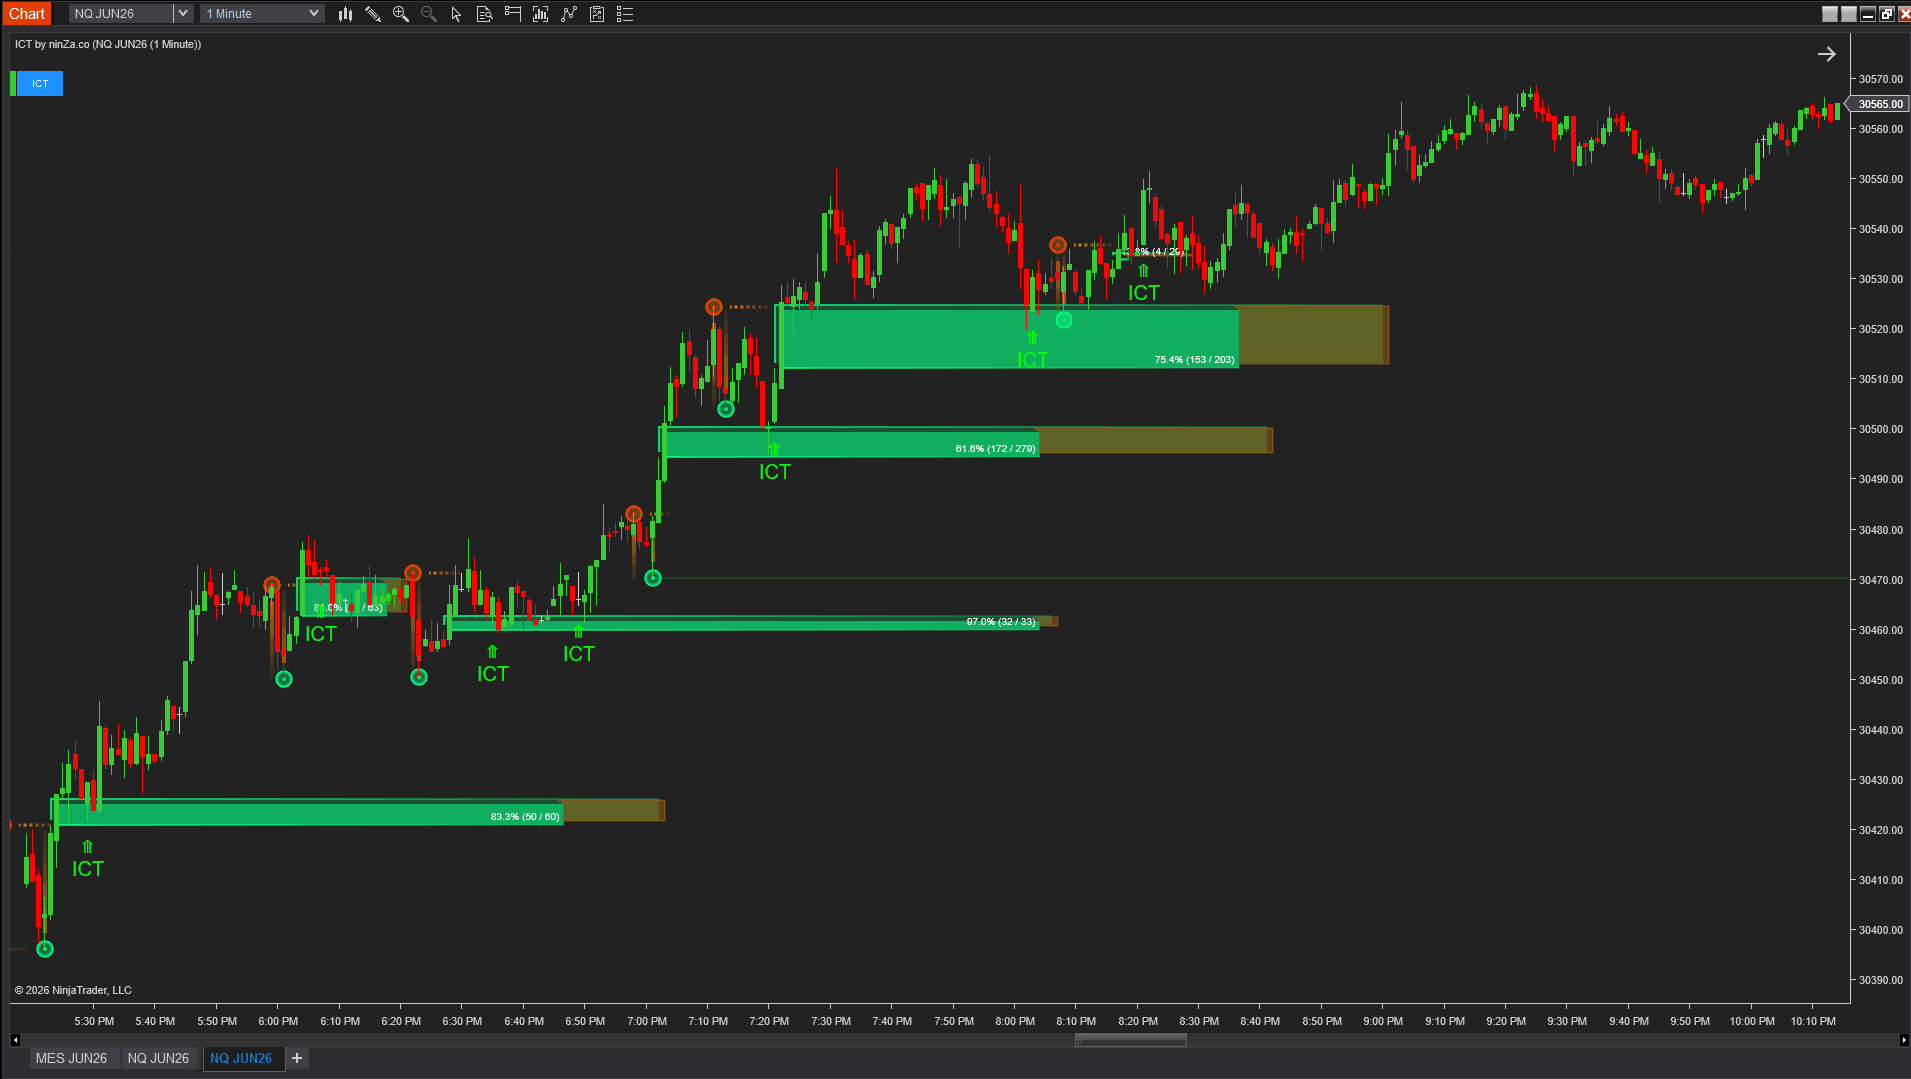
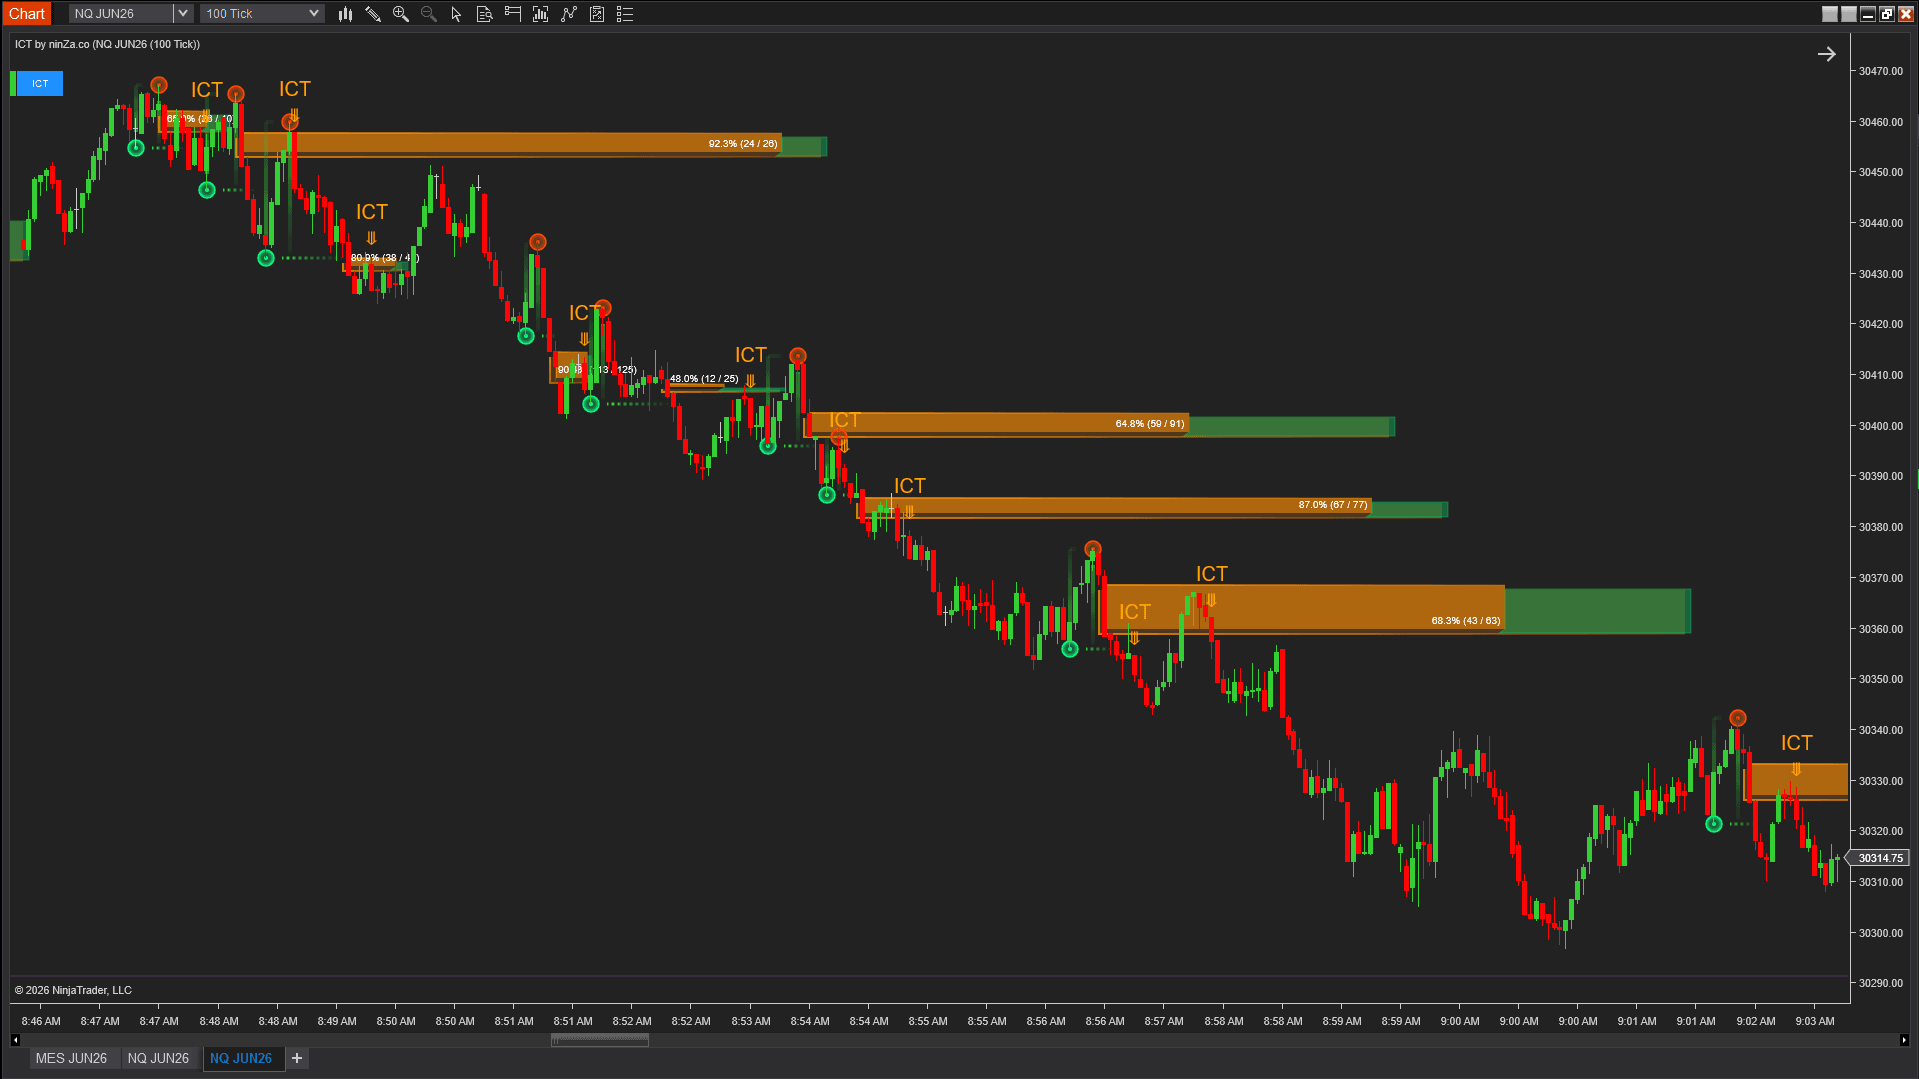
ICT PhantomTrace – 2 frameworks, mapped directly on the chart
ICT PhantomTrace automates 2 widely used ICT frameworks and maps their conditions directly onto the chart, removing the need to manually track multi-step setups in real time.
Framework 01
ICT 2022 Model
The ICT 2022 Model combines liquidity sweeps, displacement, market structure shifts, and Fair Value Gaps into a single trading framework. ICT PhantomTrace automatically identifies each required condition and plots Fair Value Gap zones when all conditions are present.
What the indicator identifies
- Liquidity sweeps (Judas Swings)
- Displacement candles
- Market Structure Shifts (MSS)
- Market Structure Breaks (MSB)
- Fair Value Gaps (FVG) – plotted when conditions align
Framework 02
PDH / PDL Bias Framework
The PDH / PDL Bias Framework uses the previous day's range as a directional filter, allowing Fair Value Gap signals to be evaluated based on the current market context rather than in isolation.
How the bias shifts
Break above PDH / below PDL
When price moves beyond the previous day's range, the indicator prioritizes Fair Value Gap signals that align with the breakout direction.
Return inside previous day's range
When price returns inside the previous day's range, the framework shifts back to an inside-range environment and evaluates Fair Value Gap conditions accordingly.
A few quick answers before you start
▶ 1. Aren’t free Order Flow & Volume Profile tools enough already?
That’s a fair question. Free Order Flow tools can still provide useful market information. The issue is that most Footprint tools flood your screen with numbers, while Volume Profile usually shows broad price zones without telling you exactly when aggressive money is stepping in.
BigTrade Sweep simplifies that process.
It automatically groups aggressive execution activity, filters out smaller retail noise, and displays clear Volume Heat Bubbles only when unusually large liquidity enters the market.
Rather than staring at fast-moving Footprint columns during volatile conditions, you can quickly spot whether buyers or sellers are taking control simply by looking at the size and clustering of the Volume Heat Bubbles directly on the chart.
If BigTrade Sweep doesn’t make your Order Flow analysis clearer and faster within 45 days, you’re covered by our exchange policy.
▶2. Will this work equally well on Gold, Nasdaq, or Forex?
That’s a reasonable concern. Every market has very different liquidity and trading behavior, so fixed-volume indicators can easily become noisy when market conditions change.
BigTrade Sweep solves this with a Dynamic Volume Threshold.
Instead of using one fixed number for every market, the indicator automatically adjusts its filtering based on the recent average trading activity of each instrument.
So, whether you trade Gold, Nasdaq, or Forex, the algorithm adapts automatically to detect unusually large participation relative to that specific market.
That means a large execution on Gold is measured differently from a large execution on Nasdaq, helping you avoid many of the false signals caused by fixed-volume settings.
If you’re unsure how to configure BigTrade Sweep for your market, simply reach out and we’ll help you optimize the setup.
▶3. Does BigTrade Sweep react earlier than MACD or RSI?
MACD and RSI are built from historical price averages, so some degree of lag is unavoidable. BigTrade Sweep works differently.
It analyzes real-time Order Flow at the tick level and monitors aggressive trading activity as it happens within milliseconds.
When Volume Heat Bubbles suddenly expand, it often signals that unusually aggressive liquidity has just entered the market – before many traditional indicators fully react to the move.
And yes. You’ll have 45 days to evaluate whether BigTrade Sweep helps you respond faster to sudden liquidity shifts, backed by our exchange policy.
▶4. Can BigTrade Sweep handle extreme volatility during CPI, FOMC, or NFP?
Yes.During major events like CPI, FOMC, or NFP, Smart Money often uses the surge in liquidity to aggressively enter or exit positions.
And that’s exactly the type of activity BigTrade Sweep is built to detect.
Smart Money often uses news-driven liquidity spikes to aggressively accumulate or distribute positions.
With the Dynamic Threshold continuously adapting to current market activity. The indicator can continue detecting unusually large participation even in the middle of violent market conditions.
Instead of reacting emotionally to chaotic price swings, you can focus on identifying which side is actually controlling the market.
Along with the indicator, you’ll get detailed manuals and video breakdowns to help you understand the logic behind the signals and use BigTrade Sweep effectively.
▶5. Do I need to use a particular chart type with BigTrade Sweep?
No. BigTrade Sweep was designed to stay flexible with your trading style.
It works across Minute Charts, Tick Charts, Renko, and other popular chart types, so you can integrate it into your existing system without rebuilding your setup from scratch.
For example, some scalpers use BigTrade Sweep on Tick Charts to detect aggressive liquidity shifts with faster execution precision.
Meanwhile, many price action traders combine the Volume Heat Bubbles with Renko Charts to filter out market noise and spot cleaner continuation or trap conditions during fast-moving sessions.
If you run into any issues while using BigTrade Sweep, our team is always ready to help within 24 hours via email – or through remote sessions when needed.
Choose your bundle
Essential Participation
[AbsP] BigTrade Sweep
$900 value Save $650
- BigTrade Sweep license: $700 value
- Personalized support: $100 value
- Trader's manual & templates:$100 value
Structure + Participation
[AbsP] BigTrade Sweep + ICT PhantomTrace
Preferred June Access
Upon purchase, you will receive immediate access to BigTrade Sweep. ICT PhantomTrace is scheduled for release in mid-June and will be included for all bundle customers at that time.
- BigTrade Sweep license: $700 value
- ICT PhantomTrace license: $700 value
- Personalized support: $100 value
- Trader's manual & templates: $200 value
Participation + Volume
BigTrade Sweep + VoluTank Army
$1,800 value Save $1,274
- BigTrade Sweep license: $700 value
- VoluTank Army license: $800 value
- Personalized support: $100 value
- Trader's manual & templates: $200 value
Complete Market Framework
BigTrade Sweep + VoluTank Army + VWAP Flux
$2,600 value Save $1,874
- BigTrade Sweep license: $700 value
- VoluTank Army license: $800 value
- VWAP Flux license: $700 value
- Personalized support: $100 value
- Trader's manual & templates: $300 value
30-day exchange guarantee
Test the full indicators in live market conditions for 30 days. Use them on your preferred platform, with your chosen markets and trading style. If you don't see a noticeable improvement in market clarity, timing, or risk-to-reward, we'll offer you an exchange for any other indicator at little or no extra cost.
Trade with more context, starting today
BigTrade Sweep gives you a clearer view of where large participants may be active – so you can make more informed decisions in fast-moving market conditions.
Download ~ 40 FREE indicators & reach more useful resources !!!
Which of these 10 trader types are you?
Discover your trader type and find the trading path that fits you best ↓
ninZa.co Indicators
0 online
![]()
ninZa.co is an official member of NinjaTrader Ecosystem together with 600+ industry-leading professionals that provide traders with quality trading products & services.


even more payment methods
Quick Links
Instructions
Support
Resources & Information
© Copyright 2026 All Rights Reserved

![]()

Because software products may be copied and stored easily, we will NOT issue refunds of any kind. ALL SALES ARE FINAL & NON-REFUNDABLE!
Futures, foreign currency, and options trading contains substantial risk and is not for every investor. An investor could potentially lose all or more than the initial investment. Risk capital is money that can be lost without jeopardizing one's financial security or lifestyle. Only risk capital should be used for trading and only those with sufficient risk capital should consider trading. Past performance is not necessarily indicative of future results.
Hypothetical performance results have many inherent limitations, some of which are described below. No representation is being made that any account will or is likely to achieve profits or losses similar to those shown; in fact, there are frequently sharp differences between hypothetical performance results and the actual results subsequently achieved by any particular trading program. One of the limitations of hypothetical performance results is that they are generally prepared with the benefit of hindsight. In addition, hypothetical trading does not involve financial risk, and no hypothetical trading record can completely account for the impact of financial risk of actual trading. For example, the ability to withstand losses or to adhere to a particular trading program in spite of trading losses are material points which can also adversely affect actual trading results. There are numerous other factors related to the markets in general or to the implementation of any specific trading program which cannot be fully accounted for in the preparation of hypothetical performance results and all which can adversely affect trading results.
NinjaTrader® is a registered trademark of NinjaTrader Group, LLC. No NinjaTrader company has any affiliation with the owner, developer, or provider of the products or services described herein, or any interest, ownership or otherwise, in any such product or service, or endorses, recommends or approves any such product or service.