High-Conviction Reversion Solution

High-Conviction Reversion Solution

Mean reversion built for a higher win rate.

A brief pullback isn't always a meaningful trading opportunity. Price may still need to move farther from its area of balance before a return toward value becomes worth considering.

High-Conviction Reversion Solution is designed to help traders identify meaningful price extremes and focus on opportunities with a stronger basis for a return toward equilibrium.

Move beyond entering on shallow, short-lived pullbacks. Build greater conviction around where price has become meaningfully extended, which side of the market to favor, and when the conditions justify a trade.

Setup 1 Bollinger-based extremes

Setup 2 Volume-defined value

01 Direction 02 Location 03 Reaction Explore the methodology ↓
The trading challenge

Not every price extreme
offers the same opportunity.

Mean-reversion trading isn't simply about buying low and selling high. A trader must first know which side of the market deserves priority and whether price has moved far enough from its balance area to offer a meaningful opportunity.

5 common problems make that decision harder.

A price extreme isn’t a trade setup.
1. Choosing the wrong side of the market

In a rising market, lower price extremes may offer more relevant buying opportunities than upper extremes offer selling opportunities.

In a declining market, the opposite may apply.

Traders who fail to establish directional priority can repeatedly trade against the stronger side, giving back gains even when individual price levels appear attractive.

2. Entering before price reaches a meaningful extreme

A small pullback may produce a brief reaction without traveling far enough from equilibrium.

Entering at that first reaction can be premature. Price may continue toward a deeper extreme before developing a more substantial move back toward value.

3. Treating every pullback the same

Strong directional movement often produces shallow corrections. Less aggressive conditions may allow deeper retracements.

Using the same entry location in both environments can lead to missed opportunities or entries before the correction is complete.

4. Trading against persistent price movement

Price can repeatedly follow an extreme boundary and continue in the same direction. This behavior is commonly called band walking.

Entering against that movement simply because price looks extended can result in repeated losses.

5. Chasing after the intended entry has passed

Without a defined extreme to monitor, traders may enter only after the better price location is gone.

That can mean a wider Stop Loss and less remaining distance to the intended target.

The objective is to identify the appropriate side of the market, wait for a meaningful price extreme, and evaluate whether price is showing the expected response.

The framework

Find meaningful extremes.
Trade the return toward value.

Mean reversion is based on the tendency of price to move away from an area of balance and, under suitable conditions, return toward it.

The farther price moves from that reference, the more relevant a potential return may become.

But price can remain extended, and a shallow correction may not provide enough distance for a meaningful trade.

High-Conviction Reversion Solution follows 3 decisions.
01

Direction - Which side should you favor?

Read the direction of current price movement.

The framework uses price behavior to establish whether Long or Short opportunities deserve priority, rather than relying on volume or volatility measurements to determine that bias.

HAMA Monster helps make that directional behavior easier to read through price-based smoothing.

02

Location - Has price reached a meaningful extreme?

Identify how far price has moved from its average or established value area. The framework uses 2 measurements:

  • Standard deviation: Evaluate the distance between price and its moving average.
  • Volume-defined value: Identify the boundaries of the area where trading volume has concentrated.

These references help determine whether a pullback has reached a meaningful depth. The purpose is to avoid entering on a weak, shallow correction that may still have farther to travel.

03

Reaction - Has price begun returning toward value?

Wait for the qualifying price response at the selected extreme.

Then evaluate the entry, invalidation level, and available risk-to-reward.

Direction determines which side to favor. Location identifies the meaningful extreme. Price behavior determines whether the return-to-value opportunity qualifies.

This turns mean reversion from an assumption about where price should go into a defined process for evaluating where and when to participate.
2 complementary references

Why measure price extremes with Bollinger Bands and volume-defined value?

A meaningful mean-reversion entry begins with a measurable distance from an established reference. High-Conviction Reversion Solution uses 2 complementary methods to identify those extremes.

The idea behind Bollinger Bands

Japanese trader Takashi Kotegawa (B.N.F.) became well known for approaches built around price moving unusually far from its average. One widely reported method involved identifying liquid stocks that had fallen approximately 20-35% below their 25-day moving average, then evaluating opportunities for a move back toward that average.

The important principle wasn't the exact percentage. It was measuring how far price had moved from its normal reference before considering a trade.

Bollinger Bands apply a related idea through standard deviation. Rather than requiring a fixed percentage distance, they measure price extension relative to recent price variability.

The upper and lower bands provide statistical reference levels around a moving average. When price reaches an extreme, traders have a measurable location to evaluate instead of relying on whether it simply looks expensive or cheap.

This solution draws on the underlying principle of measuring price extension, not on a claim to reproduce Kotegawa's exact trading method.

Why Noble POC Band?

Bollinger Bands measure deviation using price statistics. Noble POC Band approaches value from a different perspective: where trading volume has actually concentrated.

The Point of Control (POC) is the price level with the highest traded volume within the selected calculation period. It represents a reference where substantial trading activity has taken place.

When price moves far from that area, traders can evaluate whether the market is accepting the new prices or returning toward its previously established value.

That's where the Value Area High and Value Area Low become important.

VAH and VAL - The boundaries of accepted value

A volume-defined value area contains a selected proportion of the trading volume recorded over the calculation period. Value Area High (VAH) marks its upper boundary. Value Area Low (VAL) marks its lower boundary.

These boundaries separate the calculated area of concentrated trading activity from prices beyond it. They can also become meaningful support and resistance references as price tests those boundaries.

When price moves outside the value area, 2 different behaviors may develop:

  • Acceptance outside value: Price continues trading beyond the boundary, suggesting the market may be establishing value elsewhere.
  • Return toward value: Price moves back inside the area, making the POC and other value references relevant to the next trading decision.

Noble POC Band provides volume-based boundaries for evaluating those situations.

Bollinger Bands measure how unusually far price has moved from its average. Noble POC Band measures that opportunity against an area established by actual trading volume.

Why not VWAP?

VWAP is an effective reference for mean-reversion analysis, especially when traders want to evaluate price against a broader volume-weighted average.

For the shorter-term entry opportunities targeted by this solution, however, waiting for sufficiently extended VWAP-based conditions may require more time and produce fewer qualifying setups.

Our methodology prioritizes reference levels that can be evaluated across shorter trading intervals without abandoning the principle of waiting for meaningful price extremes.

Better trade selection

Designed to improve mean-reversion win rate.

By prioritizing meaningful price extremes, directional context, and qualifying returns toward value, the framework aims to improve trade selection compared with basic mean-reversion approaches that enter on shallow corrections or price extension alone.

The components

3 indicators.
3 distinct responsibilities.

01 Direction

HAMA Monster - Identify the preferred trading direction

Combines Heiken Ashi principles to smooth short-term price fluctuations and clarify the prevailing directional movement.

Key capability: Provides a clearer view of direction from price behavior without requiring traders to combine numerous overlapping indicators.

Its role: Help establish whether Long or Short opportunities should receive priority.

02 Statistical extremes

Bollinger Reversal Pro - Identify statistical price extremes

Measures price extension relative to its moving average using standard deviation.

Its configurable minimum tick-protrusion setting helps distinguish meaningful extensions beyond the bands from ordinary touches.

Key capability: Shows whether price has moved sufficiently far from its average to warrant evaluating a potential return.

Its role: Identify statistical price extremes and qualifying return signals.

03 Volume-defined value

Noble POC Band - Identify volume-defined value extremes

Calculates POC, VAH, and VAL from a rolling distribution of traded volume.

Key capability: Provides volume-based bands that help evaluate whether price has moved meaningfully beyond the area where trading activity was previously concentrated.

Return signal: Identifies qualifying movement back toward the established value area after price has traded beyond it. For the POC-based strategy, the checklist requires confirmation of the return through the POC reference.

Its role: Identify potential trading opportunities as price returns toward volume-defined value.

2 trading setups

1 principle.
2 ways to find your entry.

Setup 1: Flexible entries across different directional conditions.
Setup 2: More selective volume-based entries, designed with a higher-win-rate objective.

Setup 01 / Statistical price extremes

Setup 1 - HAMA Monster + Bollinger Reversal Pro

Flexibility across different market conditions.

Setup 1 allows traders to evaluate mean-reversion opportunities when directional movement is strong and when market conditions support deeper corrections.

The entry location changes according to the prevailing price behavior.

Variation A / Strong directional movement

Trade the shallow pullback near the Middle Plot.

When price is moving strongly in one direction, it may not retrace all the way to the opposite outer Bollinger Band. Instead, the Middle Plot may provide the relevant price reference.

Trading sequence

  1. Use HAMA Monster to establish the preferred direction.
  2. Wait for price to cross the Bollinger Middle Plot in that direction.
  3. Within the following 5-10 bars, wait for price to retest the Middle Plot.
  4. Evaluate an entry in the established direction if the setup and risk conditions qualify.

Why it matters

Waiting exclusively for an outer-band touch during strong directional movement can mean missing otherwise relevant pullbacks. The Middle Plot provides a defined alternative, with a limited retest window to avoid entering long after the original condition has passed.

Variation B / Less aggressive directional movement

Wait for the deeper correction at the opposite outer band.

When directional pressure is weaker, price may retrace farther before returning toward the preferred direction.

Trading sequence

  1. Use HAMA Monster to establish the preferred direction.
  2. Wait for price to extend beyond the outer band opposite that direction.
  3. Wait for Bollinger Reversal Pro to identify the qualifying return signal.
  4. Evaluate the entry, Stop Loss, and Profit Target.

For a potential Long, the lower outer band is the reference. For a potential Short, the upper outer band is the reference.

Why it matters

Entering near the Middle Plot during a deeper correction may be premature. This variation waits for a more meaningful extreme before considering the trade.

The advantage of Setup 1

Flexibility across different directional conditions.

Traders can evaluate opportunities during strong directional movement and during conditions that produce deeper corrections, rather than relying on one fixed entry level for every market environment.

Setup 02 / Volume-defined value

Setup 2 - HAMA Monster + Noble POC Band

Fewer signals. Greater selectivity. A higher-win-rate objective.

Setup 2 uses volume-defined value areas as its primary reference.

Rather than entering simply because price looks extended, it evaluates how price behaves after moving away from an area where substantial trading volume has occurred.

Trading process

Wait for price to return through the value reference.

Its setup requires price to interact with volume-defined boundaries and produce the specified return condition.

Trading sequence

  1. Establish direction: Use HAMA Monster to determine whether Long or Short opportunities deserve priority.
  2. Identify the extreme: Monitor the lower value-area band for a potential Long or the upper band for a potential Short.
  3. Wait for the Return signal: Follow the Noble POC checklist, including the qualifying move back through the POC reference.
  4. Evaluate the trade: Confirm the entry, structural Stop Loss, and available target.

Why this approach prioritizes selectivity

Not every move creates the qualifying sequence.

A Bollinger Band can identify statistical price extensions whenever price and volatility data are available. Noble POC Band uses levels derived from actual trading volume. Not every move creates the complete return sequence, so qualifying entries are expected to occur less frequently.

Setup 2 is designed to prioritize a higher hit rate over maximum trading frequency. The approach doesn't guarantee a higher win rate. Its comparative performance depends on the market, configuration, and execution.

More stable references for Stop Loss and Profit Target

Noble POC Band levels typically change in discrete steps as the underlying volume distribution shifts. While those levels remain unchanged, they provide relatively stable price references for evaluating the entry, stop, and target. This helps traders define risk around market structure rather than arbitrary tick distances.

The dual-bar advantage - Heiken Ashi + ninZaRenko

Heiken Ashi smooths short-term fluctuations to clarify direction, although smoothed values do not represent exact executable prices. ninZaRenko uses price-based reversal structure for timing and stop placement.

Together, they address different parts of the trading decision. Heiken Ashi helps clarify the preferred direction. ninZaRenko helps identify the price-based entry structure.

The trading playbook

A complete guide.
A repeatable process.

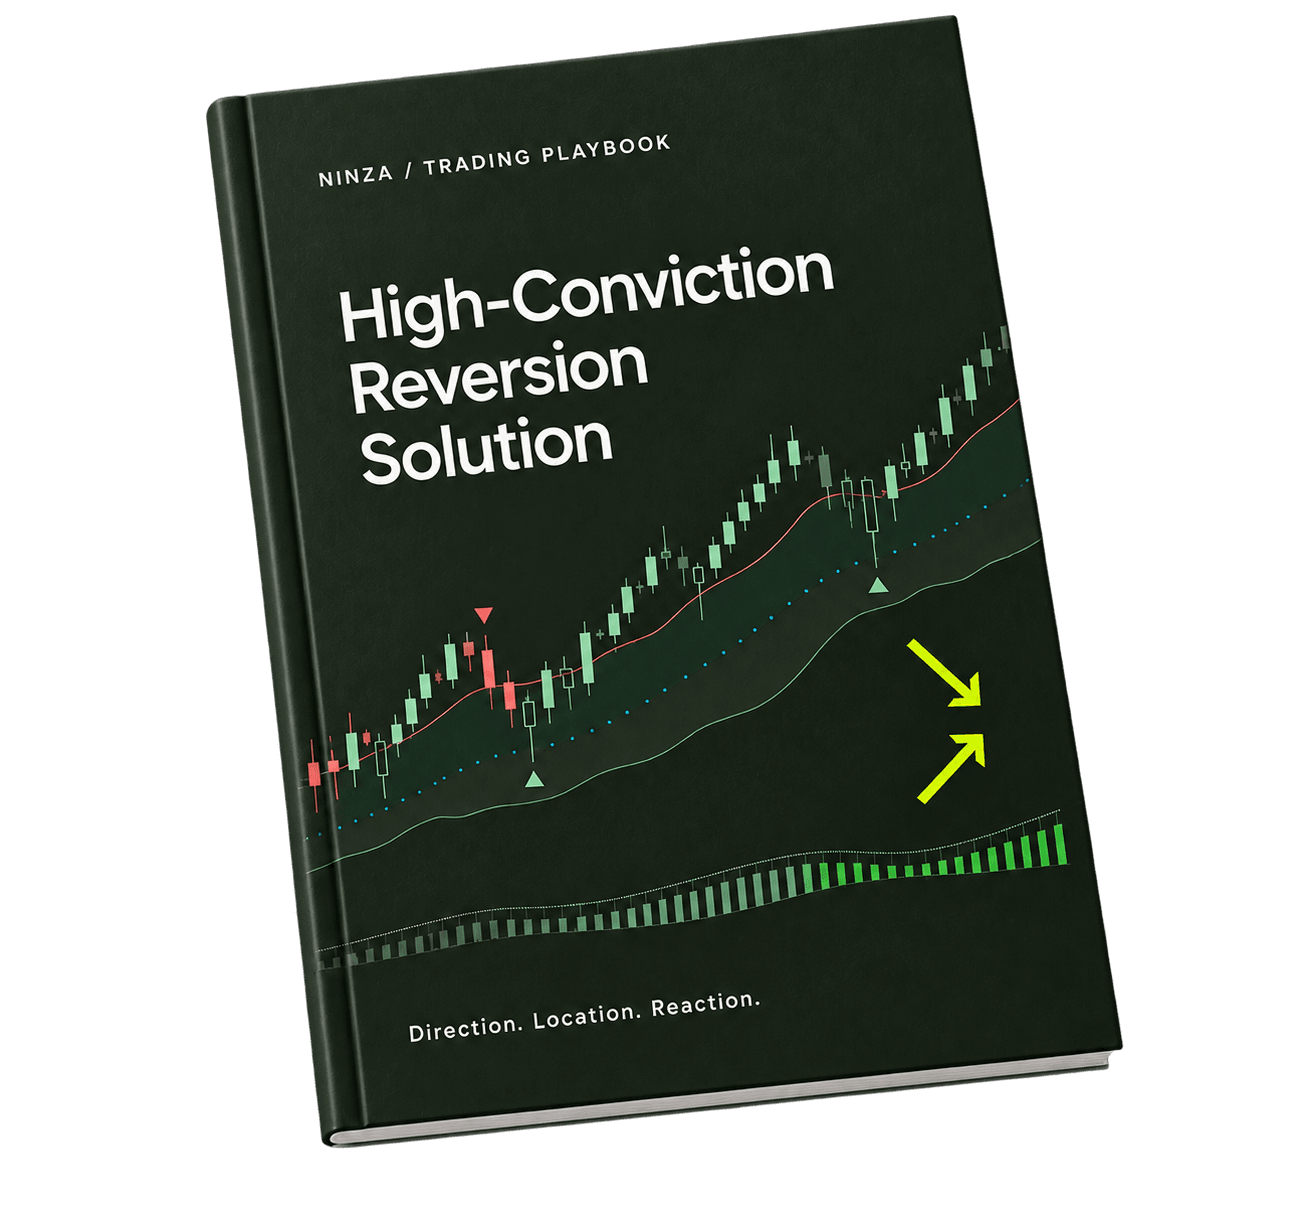
High-Conviction Reversion Solution trading playbook cover

High-Conviction Reversion Solution includes a trading playbook covering strategy principles, entry checklists, risk management, automation, and suggested settings.

Trading playbook included $100 stated value
Chapter 1: Understanding risk & trading principles

Chapter preview

Before exploring Bollinger Reversal Pro, Noble POC Band, and HAMA Monster, it’s worth keeping in mind what these indicators are designed to do - and what they can’t replace. No indicator, however well designed, can take the place of sound risk management and disciplined trading.

Trading always involves the risk of losing money, and with leveraged products, losses can occur faster than you might expect. No system, indicator suite, or checklist - including High-Conviction Reversion Solution - can guarantee a win every time.

Markets operate on probabilities: whether a method has an edge becomes clear only over a sufficiently large series of trades executed correctly, not from one or a few individual trades. The story of Takashi Kotegawa in Chapter 2 is intended to inspire the thinking behind this solution, not to promise the results you may achieve.

This solution helps you identify price zones where there is a sound basis to expect a potential reversal - not predict with certainty where the market will go. The indicators help you identify these areas and confirm signals. Entry timing, stop placement, position sizing, and exits are still guided by your risk management approach, market context, and trading discipline.

5 trading principles to keep in mind

1. Money management

Limit the risk on each trade to 1–2% of your account. The math leaves little room for error: a 10% loss requires an 11% gain to break even, while a 50% loss requires a 100% gain. Keeping risk small helps you withstand the losing streaks that inevitably occur in trading. Taking on too much risk can turn an ordinary losing streak into a threat to your entire account.

2. Risk management

Always set your stop before entering a trade. Your stop should be based on the Band structure or Brick size - the point at which your reason for entering the trade is no longer valid - not on how much you feel comfortable losing. These two numbers are almost never the same. Determine your position size based on the distance to your stop, not the other way around.

3. Discipline

Follow every step in the checklist (Chapter 5). Don’t skip a step just because you feel the price is about to reverse. Many significant losses don’t come from a flaw in the system, but from skipping the process - whether you’re riding high after a winning streak or rushing to make back losses.

4. Mean reversion without guessing tops & bottoms.

High-Conviction Reversion Solution identifies price zones where there is a sound basis to expect a reaction, rather than trying to pick a “bottom” or “top” based on gut feeling. Even a trade entered at the right Band zone can be wrong. When that happens, accepting that you’re wrong and exiting quickly matters more than trying to prove yourself right.

5. A location filter, not a forecast

This solution helps you identify price zones where there is a sound basis to expect a reaction, but it doesn’t guarantee that price will react there. Understanding this distinction helps you evaluate the system over a series of trades rather than giving up after a few consecutive losses - a normal part of any probability-based trading approach.

Reference - Leverage and speculative trading risks

Financial regulators warn that trading leveraged products can result in substantial losses and may not be suitable for everyone. No strategy, indicator, or system can eliminate these risks entirely. Money management and personal discipline are key factors in determining whether you can sustain your trading over the long term.

Source: U.S. Commodity Futures Trading Commission (CFTC), Customer Advisories on Leverage and Speculative Trading Risk - cftc.gov

The content in this document is for educational purposes only and is based on how markets behave and how each tool works. There will still be times when things don’t play out as expected, such as during unexpected news events, periods of very low liquidity, or rare and unpredictable events.

Chapter 2: The origin story & the challenges traders face

Chapter preview

A toolkit starts with a clear question, not an indicator. This chapter tells the story behind the solution and identifies the four specific problems that High-Conviction Reversion Solution was designed to address.

1. Where it all began

Takashi Kotegawa, known in Japan’s trading community by the nickname B.N.F., is often cited as an example of a trader who turned a small account into a substantial fortune through stock trading alone. Over eight years, he reportedly grew his capital from around ¥1.6 million (~$15000) to approximately ¥20 billion (~$150 million).

The most valuable lesson isn’t the amount of money he made, but his willingness to adapt rather than stick to a single trading approach. He adjusted his methods to changing market conditions, whether the market was declining (bearish) or rising (bullish).

Bear Market (2001–2002) - The “Moving Average Divergence” approach

This was the period when his trading style began to take shape. His approach focused on liquid stocks that had fallen 20–35% below their 25-day moving average (MA25). The further the price moved away from the moving average, the greater the potential for a rebound. He exited when the price recovered toward the MA25.

Rather than trying to capture the entire recovery, he focused on the move from an extreme price deviation back toward normal levels - the part of the move he considered most likely to occur.

Bull Market (2006–2008) - The “Sector Correlation” approach

As the market shifted into an uptrend, buying stocks after steep declines (mean reversion) became less effective because prices rarely fell far below the moving average. He adapted his approach: when a sector was rising alongside the Nikkei 225 but a particular stock was lagging behind, he would buy that stock, expecting it to eventually catch up with the rest of the sector.

What High-Conviction Reversion Solution takes from B.N.F. is a way of thinking, not a fixed set of numbers - because he himself didn’t rely on a single formula for every market situation. High-Conviction Reversion Solution doesn’t try to “replicate” B.N.F.’s approach. There isn’t enough data to know exactly what he did, and how to manage capital is a personal decision for every trader. What this toolkit takes from his approach is one idea: price tends to fluctuate around a central area of value, and when it moves too far away from that area, a force pulling it back often emerges. This doesn’t happen every time, but often enough to build a data-driven trading approach around it.

Bollinger Bands essentially measure how far price has moved from its normal range of variation, much like the MA Divergence approach described above, but in quantitative terms. The bands also adjust to changing volatility rather than relying on a fixed percentage. This is why High-Conviction Reversion Solution uses Bollinger Bands as its core framework.

2. Four common challenges for mean-reversion traders

Before looking at the solution, we need to clearly identify the problems - because a solution only has value when the problem it addresses is well understood.

  • No well-defined entry point. Many traders see the price falling and think, “It looks cheap now”, so they buy. But “looks cheap” isn’t a specific price level, nor does it come with a clearly defined risk. If the entry isn’t based on a well-founded price zone, it’s difficult to determine where to place a reasonable STOP. And a trade without a well-defined STOP is a trade without a plan.
  • Prone to FOMO (fear of missing out). Without a specific price zone to wait for, traders can easily chase price as soon as they see a promising candle. They end up entering wherever it “feels right” rather than at a level they identified in advance. The result is a late entry, a distant STOP, and an unfavorable risk-to-reward ratio (R:R) from the start.
  • Whipsawed in sideways markets. Trend-following systems often suffer repeated stop-outs in ranging markets because false signals are common. Without a way to distinguish meaningful pullbacks from weak ones, traders can end up entering on minor price moves only to get stopped out repeatedly. Their accounts gradually erode without a clear trend ever taking shape.
Chapter 3 - Solution philosophyLocked · Included with purchase
Chapter 4 - The 3 indicatorsLocked · Included with purchase
Chapter 5 - Trading checklistsLocked · Included with purchase
Chapter 6 - ATM configuration and risk managementLocked · Included with purchase
Chapter 7 - Improving trade selectionLocked · Included with purchase
Chapter 8 - Automated trading integrationLocked · Included with purchase
Chapter 9 - Suggested settingsLocked · Included with purchase

Explore Chapter 1 and the available Chapter 2 preview above. Purchase the solution to unlock chapters 3-9 and the complete practical resources.

Optional extensions

Bring your rules into execution.

Infinity Algo Engine$

Build rule-based strategies without coding.

Infinity Algo Engine$ supports multi-condition strategy development for both Bollinger variations, including the Middle Plot retest and outer-band signal approaches illustrated in the playbook.

Its Hit Bar and Signal Bar logic helps separate setup conditions from execution triggers.

Key capabilities: Multi-condition logic, supported indicator signals, separate entry scenarios, ATM configurations, and reusable strategies.

Captain Optimus Strong v2

Automate compatible entry conditions and trade management.

The playbook includes configuration examples for Bollinger Variation B and the Noble POC checklist.

Captain Optimus Strong supports predefined entry and exit conditions, ATM integration, and operational risk controls.

Key capabilities: Compatible signal combinations, automated execution, session filters, and predefined protection rules.

Automation compatibility and behavior should be verified with the intended chart settings before live execution.

What changes in your workflow

A more selective approach
to trading price extremes.

01. Pursue a higher mean-reversion win rate

Rather than entering on every apparent pullback, the framework prioritizes meaningful statistical or volume-defined extremes and qualifying price responses.

The objective is to improve the proportion of successful entries compared with less selective mean-reversion methods.

This is an intended advantage, not a guaranteed performance result.

02. Reduce premature entries in sideways markets

Sideways price action can produce repeated small moves that appear actionable before price reaches a meaningful extreme.

Waiting for the appropriate band or value-area boundary helps avoid entering on those shallow reactions.

Instead of taking a position while price still has room to move against it, traders can evaluate entries closer to the extremes of the established range.

03. Combine smoother directional analysis with more defined entry timing

Heiken Ashi helps filter short-term price fluctuations and clarify the preferred direction. ninZaRenko provides price-based reversal structure for entry timing.

Using both perspectives helps address the limitations of relying on a single chart type for direction and execution.

04. Avoid buying after price has already moved too high or selling after it has moved too low

Mean reversion emphasizes entering at meaningful price extensions rather than chasing a move after much of it has already developed.

That can provide a more favorable starting location for evaluating the distance to the stop and the potential return toward value.

The entry still requires confirmation and risk assessment.

05. Filter out weak, shallow pullbacks

A small reaction doesn't necessarily mean price has traveled far enough from its average or value area.

By measuring price extension through standard deviation or volume-defined boundaries, the framework helps traders avoid treating every brief correction as a meaningful opportunity.

06. Apply the methodology across different chart intervals

The underlying approach can be adapted to Renko, tick-based, and time-based charts with appropriate indicator settings.

The playbook includes suggested configurations for multiple chart types and Renko ratios.

Settings should be evaluated for the intended market rather than assumed to perform equally across every interval.

Live trading

From the framework
to the live chart.

See the methodology applied in a live market. Watch directional context, qualifying return conditions, and trade management come together.

Live session / 01

Reading value, price action and momentum

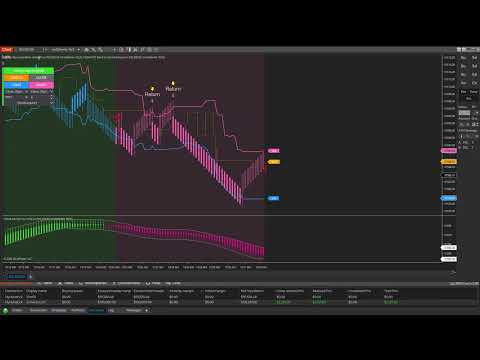
In this video, we explore how volume distribution, price action, and momentum shifts help traders identify potential reversals. Through a live trading session with around 18 trades and 15 winners, we also demonstrate how to adjust stop-losses, profit targets, and position size based on changing market conditions.

Live session / 02

Setup 2 / From Asia to New York

In this video, we test Setup 2 during the transition from the Asian session to the New York session, when shifting liquidity, volatility, and market participation can make mean reversion trading more challenging. Across 15 consecutive live trades, we recorded 10 winners and 5 losses, while examining why certain trades worked, why others failed, and how to manage risk as market conditions change.

Live session / 03

Setup 2 / Value and momentum shifts

In this video, we demonstrate Setup 2 in a live trading session, focusing on how to identify potential mean reversion opportunities through shifts in market value and price momentum. We also walk through the importance of assessing market structure, volatility, and timeframe selection before trading, along with adjusting stop-losses and managing risk as market conditions change.

Live session / 04

Setup 1 / Low-volatility conditions

In this video, we explore 2 trading approaches for identifying mean reversion opportunities in both trending and ranging markets. We also review our first live trading session with Setup 1, covering 9 trades in low-volatility conditions, the challenges of limited trading opportunities, and how we handled signals, manual entries, and initial setup adjustments.

Live session / 05

Setup 1 / 20-trade session

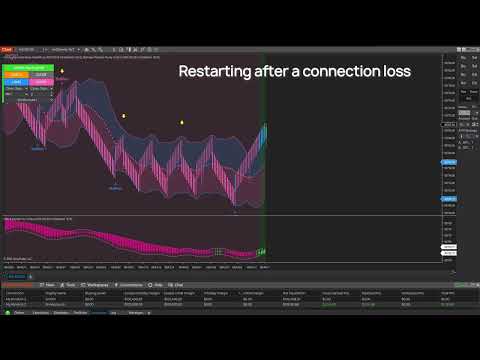
In this video, we review another live trading session with Setup 1, covering 20 trades with 16 winners and 4 losses, achieving an 80% win rate for the session. We also show how trading opportunities were selected, how risk was managed under changing market conditions, and how trading resumed after an unexpected power outage.

Live session / 06

Setup 1 / Short-side opportunities

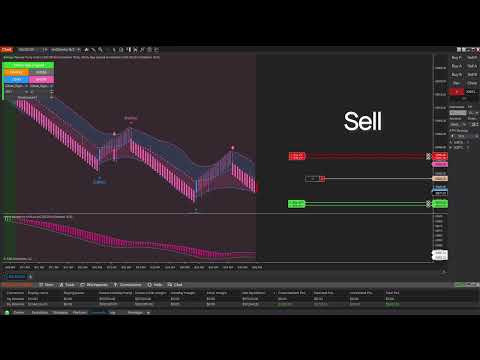
In this video, we review 12 live trades using Setup 1, focusing on market conditions that favored short positions as buying pressure weakened and bullish pullbacks failed to sustain momentum. We also examine how reversal sell signals developed near dynamic resistance, why stop-loss sweeps were less frequent, and how price responded throughout the session.

Before you decide

5 practical questions.

1. "I already use Bollinger Bands. Why would I need this?"

Bollinger Bands measure statistical price extension, but they don't independently establish directional priority or identify volume-defined value.

This solution combines those perspectives with documented trading setups, a dedicated playbook, and personalized support.

The value is the complete trading methodology, not simply another band indicator.

2. "Will it work during strong directional moves?"

Strong directional movement can keep price near an extreme boundary for extended periods.

HAMA Monster helps establish the preferred side, while the 2 Bollinger variations account for different correction depths.

The framework provides defined entry conditions, although no setup eliminates trading risk.

3. "Will 3 indicators complicate my chart?"

Each has a distinct role: directional analysis, statistical extremes, or volume-defined value.

The playbook and suggested settings explain how the components fit into the intended workflow.

4. "Will signals behave differently in live trading?"

Developing Renko bricks and indicator values may differ from completed historical bars.

Signal behavior should be verified under the intended configuration through appropriate testing before live execution.

5. "What if the solution doesn't fit my trading style?"

Review the playbook previews and trading demonstration before deciding.

Eligible purchases are covered by NINZA's 30-day product exchange program, subject to its terms.

Included with strategy and execution options

Multi-Formula Vol Band

A volume-weighted view of price extension, band behavior, and potential returns toward balance.

Product value $700Included with High-Conviction Reversion Solution + Infinity Algo Engine$ and High-Conviction Reversion Solution + Captain Optimus Strong v2.

01

9 Middle Plot types

Choose from 9 middle-plot calculations to define the reference price may return toward after moving away from balance.

02

Bands informed by volume

Advanced volume-weighted formulas create the upper and lower bands, giving traded volume a role in their construction instead of relying on standard-deviation expansion that treats each bar equally.

03

3 layers of information

Read per-bar absorption, Buy / Sell Volume, and the degree of expansion in the upper and lower bands directly on the bands.

04

Contraction and expansion zones

Highlighted areas make it easier to distinguish narrowing bands from expanding bands.

05

Pullback and Reversal signals

2 signal types help identify potential pullback and reversal opportunities within the band structure.

1 methodology.
3 ways to put it to work.

02 / Strategy option

High-Conviction Reversion Solution +
Infinity Algo Engine$

$840

With coupon ZSUPPORT applied.

Everything in the core solution, plus:

  • Infinity Algo Engine$ license
  • Multi-layer strategy-building capabilities
  • Hit Bar and Signal Bar logic
  • Dedicated ATM control for supported conditions
  • Personalized support for the additional product ($100 stated value)
  • Multi-Formula Vol Band at no additional charge ($700 value)

Best fit: Traders who want to build advanced rule-based strategies.

Choose strategy option ↗

03 / Execution option

High-Conviction Reversion Solution +
Captain Optimus Strong v2

$800

With coupon ZSUPPORT applied.

Everything in the core solution, plus:

  • Captain Optimus Strong v2 license
  • Supported multi-indicator automation
  • Automated entry, exit, and protection rules
  • ATM integration
  • Personalized support for the additional product ($100 stated value)
  • Multi-Formula Vol Band at no additional charge ($700 value)

Best fit: Traders who want more consistent automated execution.

Choose execution option ↗

October assistance

Additional October assistance

Most products receive the standard 10% purchase assistance during October. High-Conviction Reversion Solution is among the selected products eligible for additional 20% assistance during October.

The amounts above already reflect the applicable ZSUPPORT coupon.

Additional assistance is available during October 2026 only, subject to applicable terms and per-trader limits. Final eligibility and checkout totals should be confirmed before purchase.

30DAYS
30 days

A trading solution should fit the way you trade.

The included playbook, chart configurations, and personalized support help you understand and evaluate the methodology.

If it isn't the right match, NINZA's 30-day product exchange program provides an alternative.

Eligible purchases may be exchanged for qualifying products within 30 days, subject to applicable terms and any required price differences or fees.

Your next trading decision

Trade meaningful extremes,
not every pullback.

High-Conviction Reversion Solution brings directional analysis, measurable price extremes, and qualifying return-to-value conditions into one structured methodology.

Choose between flexible Bollinger-based entries and more selective POC-based setups.

Know where price is extended. Know which side to favor. Know when to enter.

Continue to checkout ↗

The amounts shown reflect coupon ZSUPPORT. Check the final total at checkout.

Watch the demonstration ↗