
Chapter 2: Why Noble Cloud, Entropy Voltex & Bollinger %B Pro?
This chapter answers a fundamental question: Why these 3 indicators and why removing any one of them weakens the entire approach.
1. The missing piece in scalping
Before looking at each indicator individually, let's start with a more important question:
Why do so many scalpers consistently lose money even when they correctly identify the market direction?
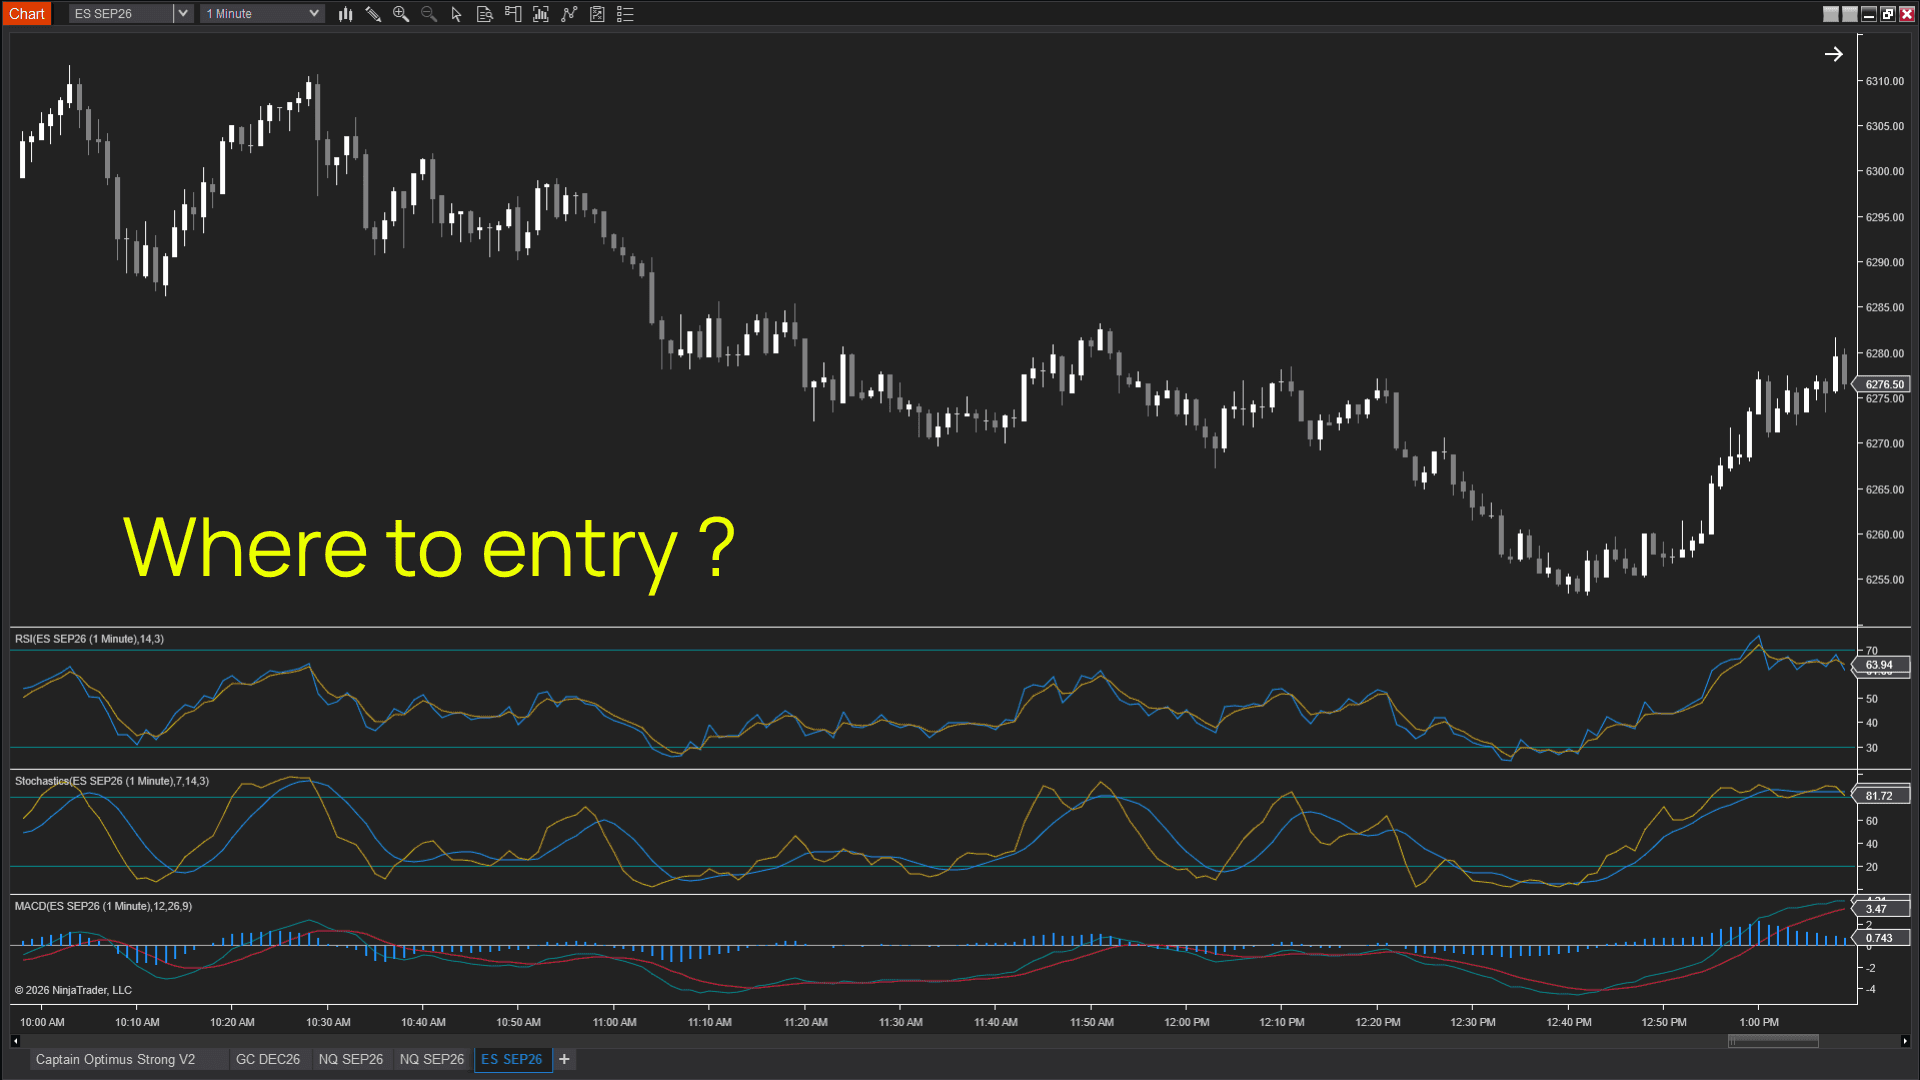
The answer is that direction alone is not enough.
Correct market direction is only 1 of 3 conditions required for a high-quality trade. The other two are the quality of the price movement at the moment of entry and the strength of the momentum driving that move.
Most traditional indicator combinations – such as moving averages, RSI, MACD, and Stochastic – tend to measure different variations of the same thing. Although they use different calculations, they are all trying to answer essentially the same question:
"Where is the market likely to move next?"
As a result, a chart filled with multiple indicators confirming the same direction can still produce poor entries. They may agree on the trend, yet none of them answers two questions that matter just as much:
- Is this entry location actually high quality?
- Does the market currently have enough momentum to sustain the move?
Expansion Entry Scalping Solution was designed to fill this gap by separating the trading decision into 3 independent dimensions, with each indicator measuring a different aspect of the market rather than repeating the same information.
Each indicator is responsible for answering one critical question.
| Dimension | Indicator | Question it answers |
|---|---|---|
| Direction | Noble Cloud | Which direction should I trade, and where should I look for entries? |
| Movement quality | Entropy Voltex | Is the current price movement reliable, or is it just noise? |
| Momentum | Bollinger %B Pro | Is there enough momentum for the move to continue? |
What happens when one of these 3 dimensions is missing?
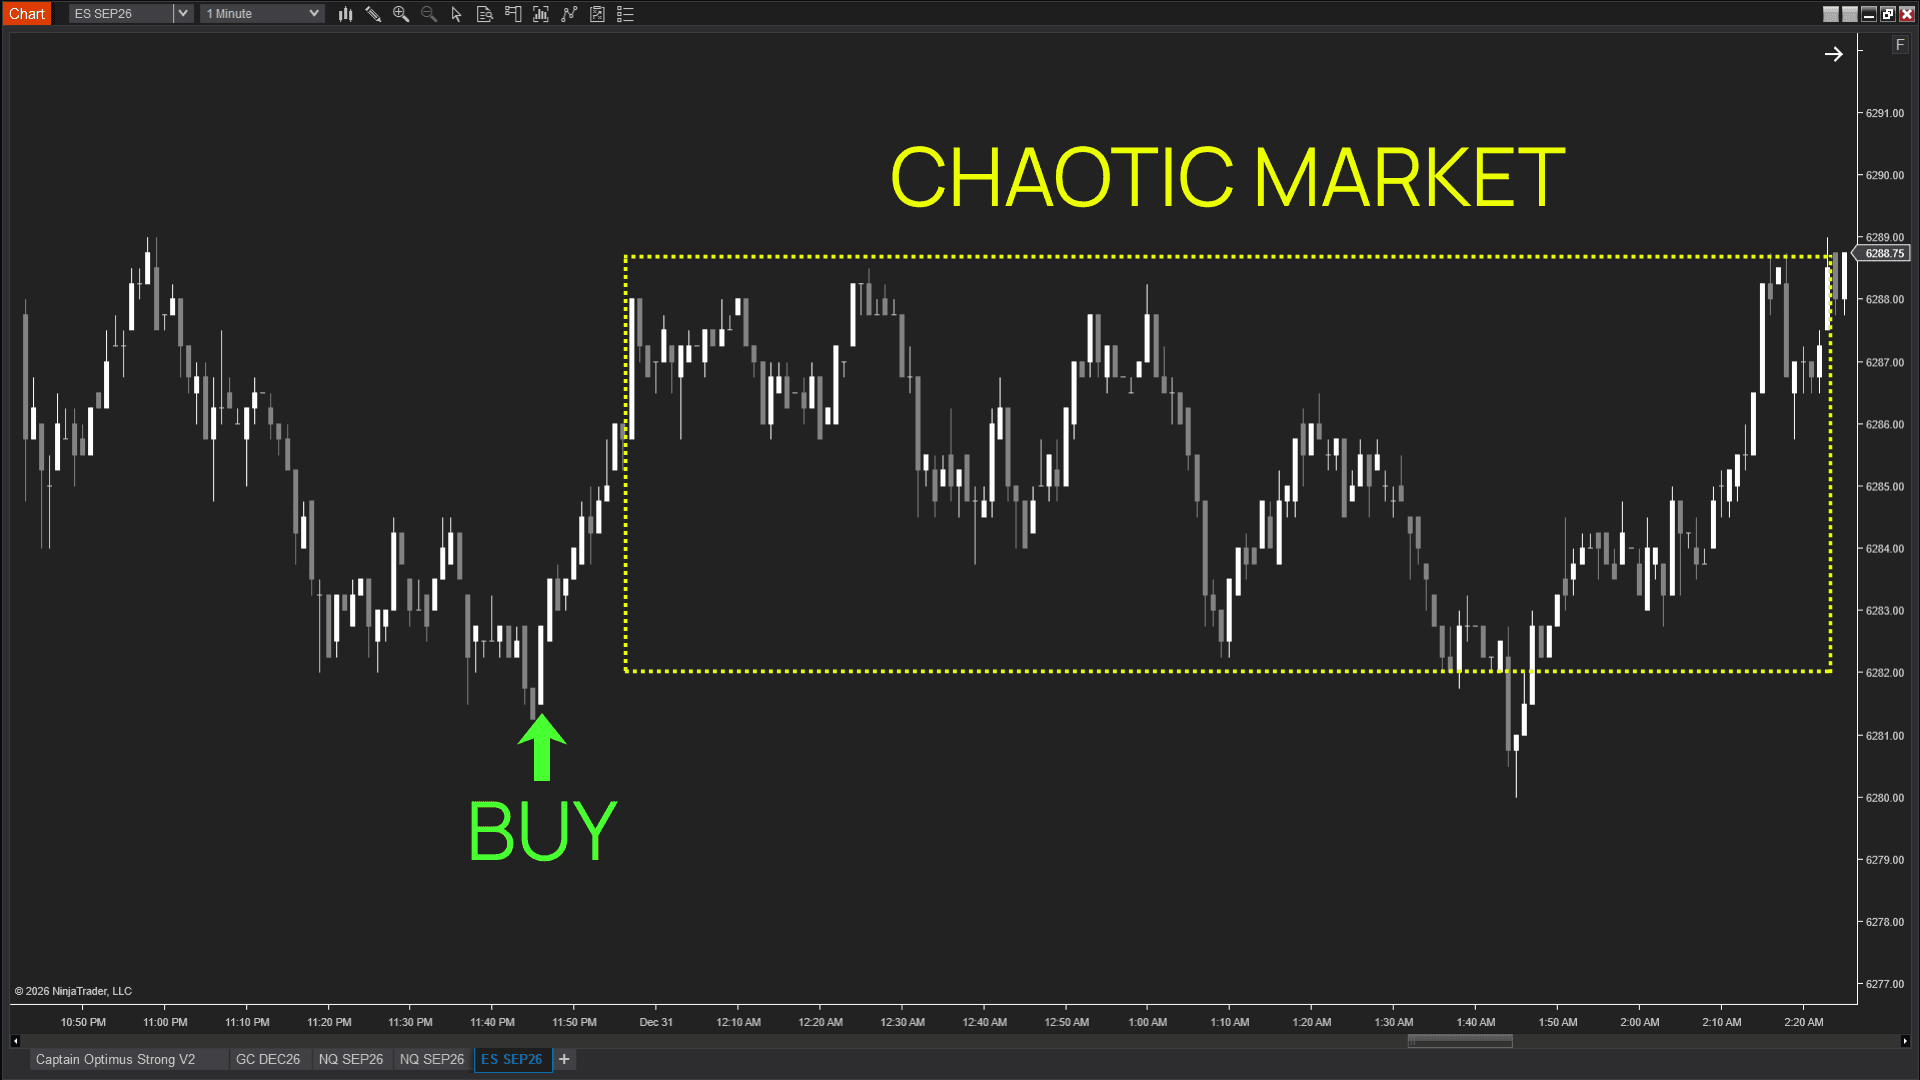
Direction without quality
This is one of the most common reasons traders experience the frustrating situation of "getting the direction right, but the trade goes nowhere."
When the market lacks structure and price behavior becomes dominated by noise, even a correct directional bias offers little advantage. Without a stable market environment, price often fails to generate the follow-through needed for a successful trade.
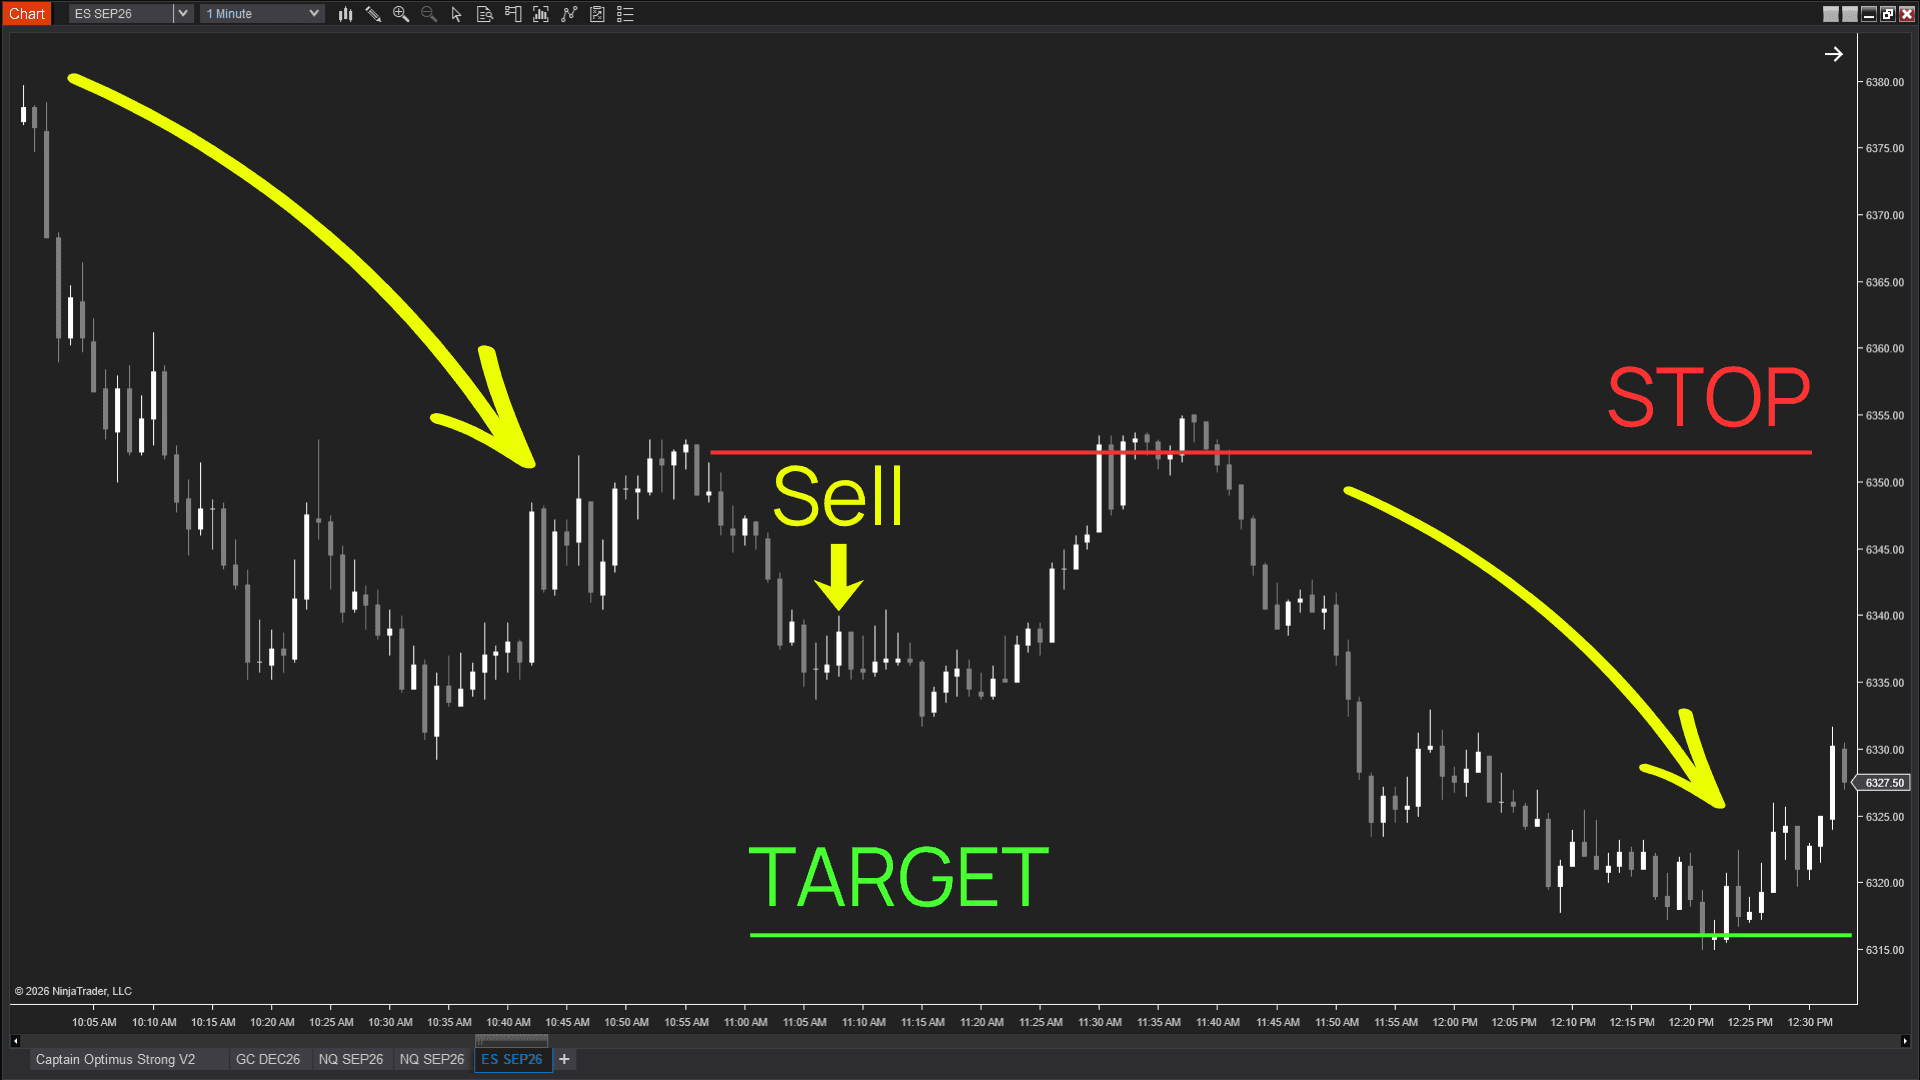
Quality without momentum
A well-structured market doesn't automatically lead to profitable trades.
Even under favorable market conditions, weak momentum can prevent price from reaching your target. Instead, the move may lose strength, stall, or transition back into a noisy environment before the trade has enough time to develop.
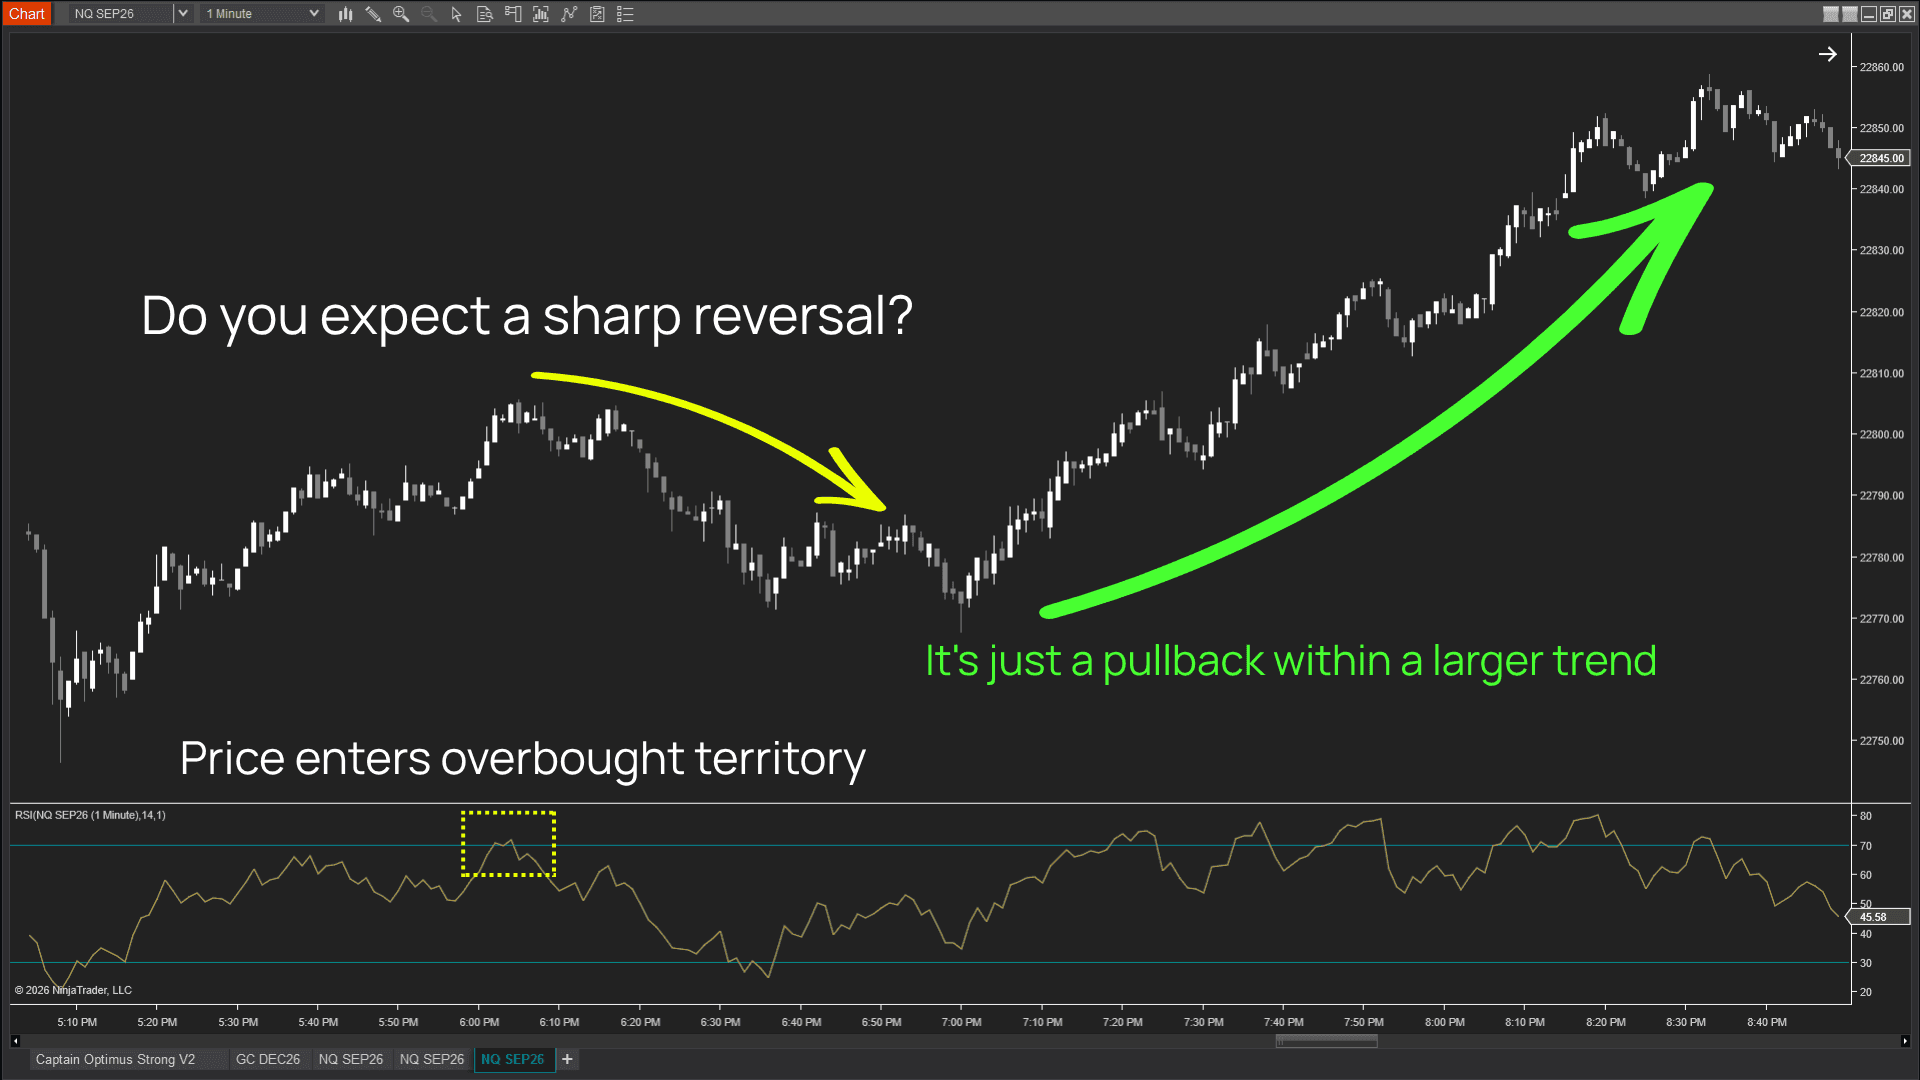
Momentum without direction
Strong momentum alone doesn't necessarily signal the beginning of a new trend.
A common mistake among traders is relying solely on momentum indicators such as RSI or MACD. A strong momentum move against the dominant market direction is often nothing more than a sharp retracement rather than a genuine trend reversal, increasing the risk of trading against the prevailing trend.
This explains why many scalping strategies appear convincing in theory but become inconsistent in live markets. The problem isn't a lack of trading signals – it's a lack of independent confirmation. Each indicator may perform well on its own, but without validating different aspects of the market, the overall decision remains incomplete.
This principle also aligns with the well-known study by Barber and Odean (2000), which analyzed 66,465 brokerage accounts and found that the most active traders significantly underperformed the broader market. More trades did not lead to better results. Better trade selection did.
2. Noble Cloud: Why trend should be a zone, not a line
Most trend-following tools, such as a single Moving Average or EMA, represent trend with a single line. While this works well as a directional filter, it provides little information about where the market is actually likely to react.
Markets rarely respond to an exact price level. Instead, they tend to react within price zones where buying and selling activity has previously reached a temporary balance. This is why Noble Cloud is built around a cloud rather than a single line.
The cloud serves 2 purposes at the same time:
Direction Filter
Price above the cloud favors long opportunities. Price below the cloud favors short opportunities. This is the most visible and straightforward function of Noble Cloud.
Dynamic Support and Resistance Zone
The cloud also represents an area where the market has previously established agreement around value.
In general, a thicker cloud suggests that price spent more time accepting that region in the recent past, creating stronger price memory. When price revisits the cloud, it is therefore more likely to react – either by finding support or encountering resistance – than at an arbitrary price level with little historical significance.
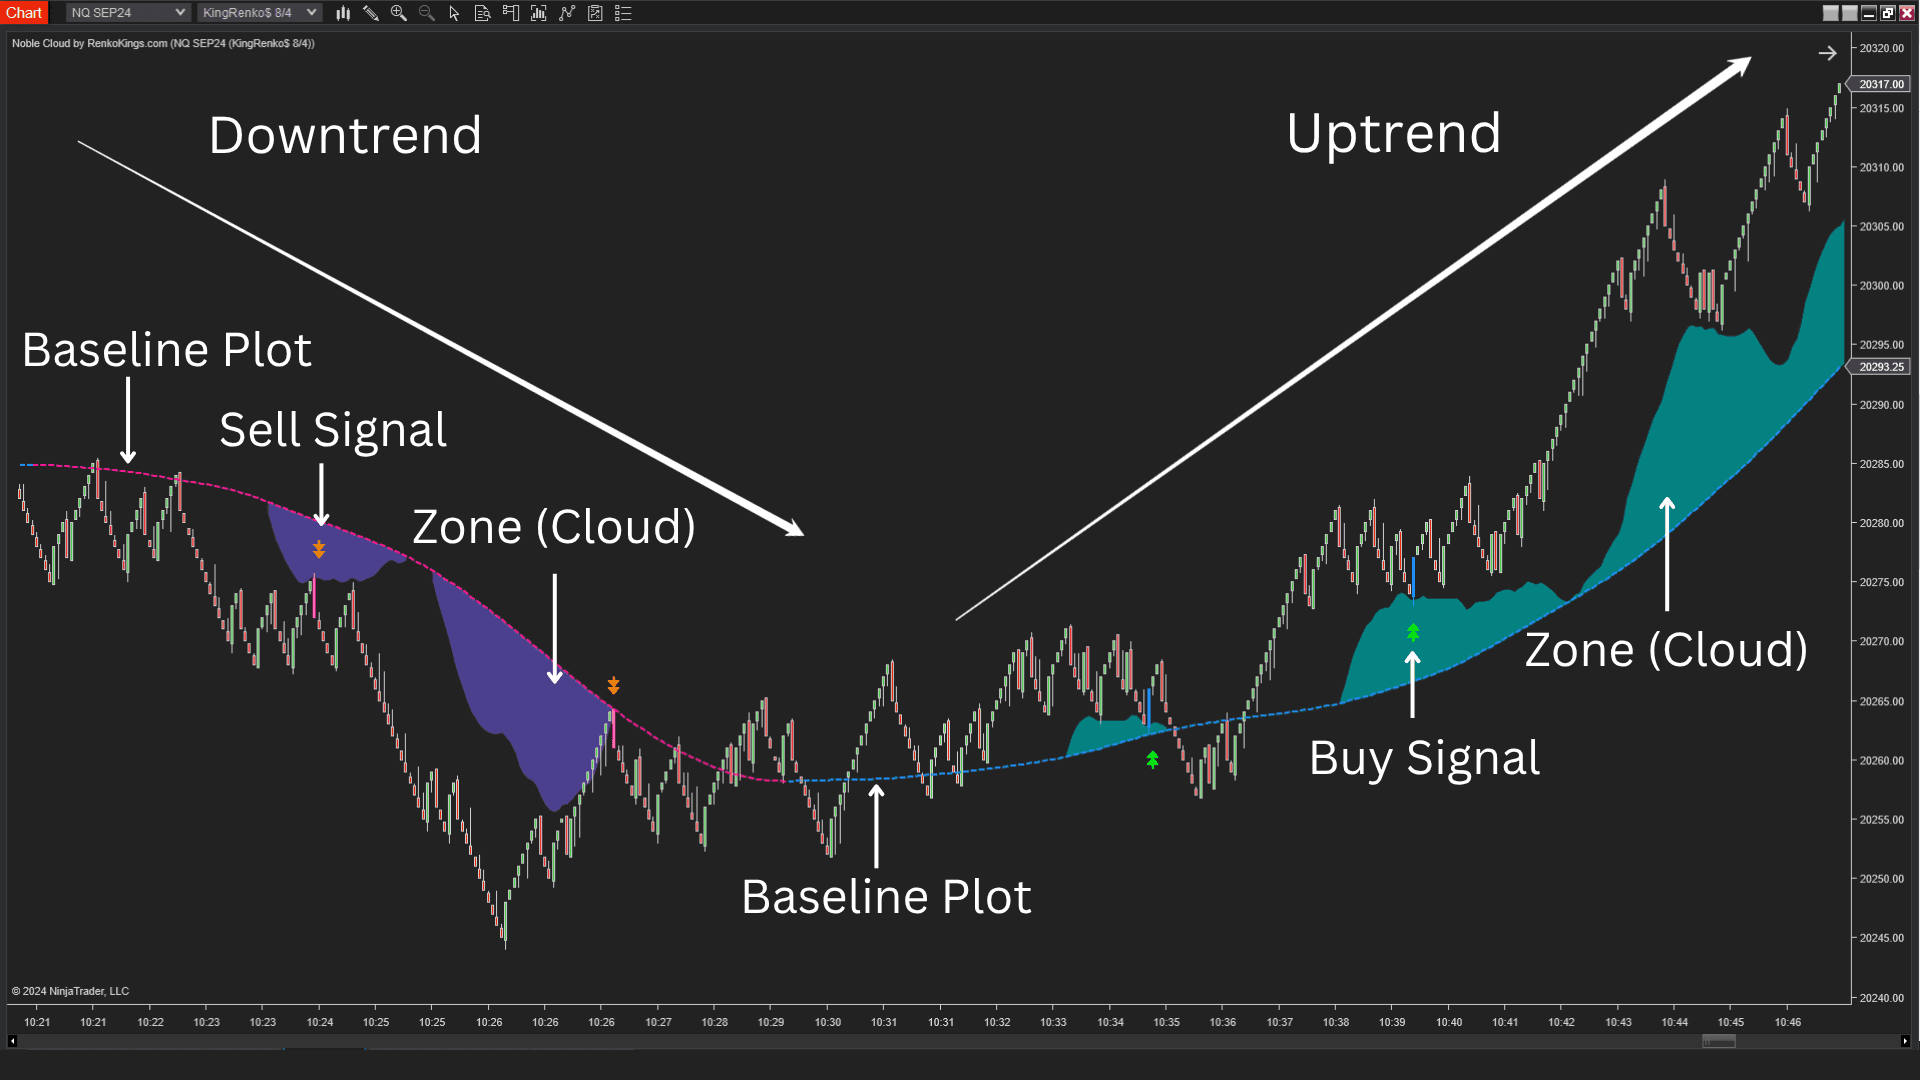
This is also why the pullback step in the trading checklist is just as important as identifying the trend itself.
Entering immediately after confirming the trend often means chasing price instead of waiting for the market to return to an area where buyers and sellers have previously shown meaningful agreement.
By waiting for a pullback into the cloud, you are using Noble Cloud as it was intended: not simply as a trend indicator, but as a framework for identifying higher-quality entry locations.
3. Entropy Voltex: Order vs. disorder in the market
Among the 3 indicators, Entropy Voltex is the easiest to misunderstand. At first glance, it may appear to be another momentum indicator. In reality, it answers a completely different question.
Momentum asks how strongly price is moving.
Entropy asks how organized that movement is.
This distinction is fundamental.
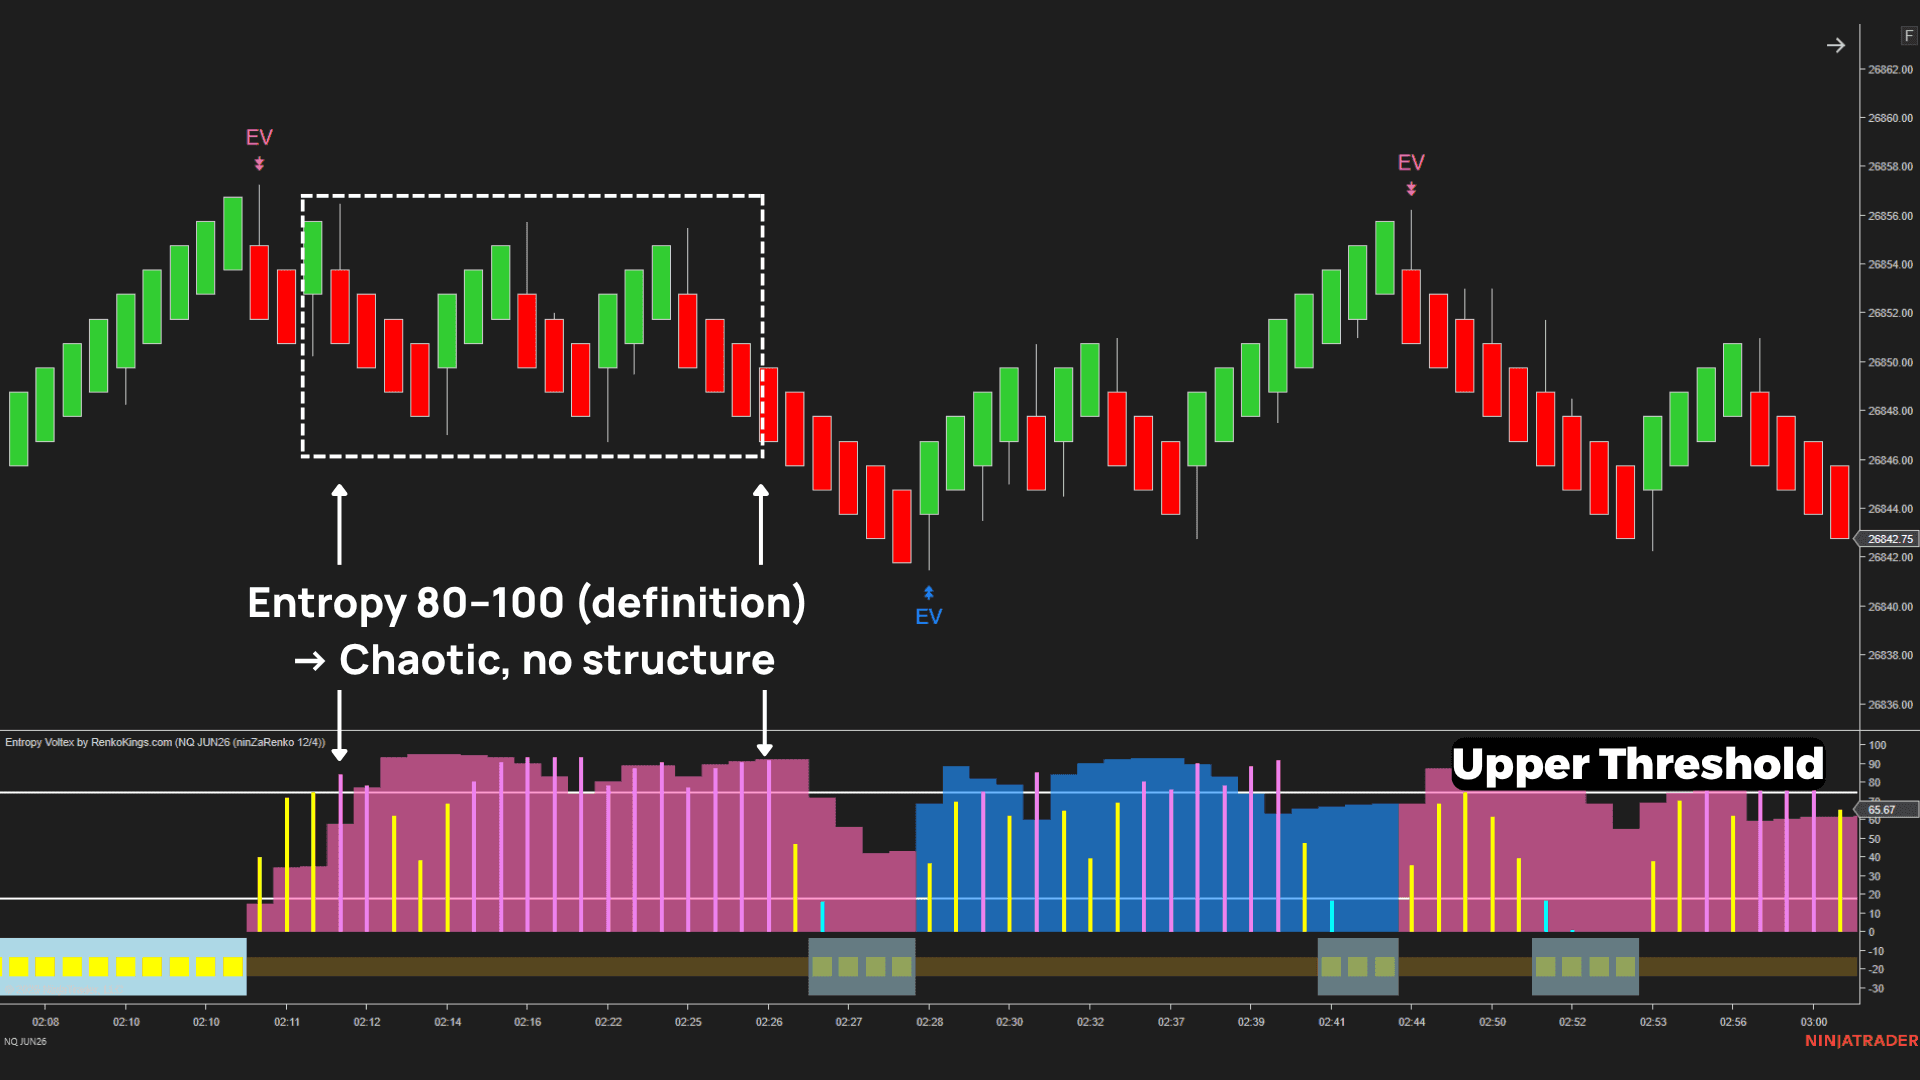
In information theory, entropy is a measure of uncertainty within a stream of information. Lower entropy indicates a more organized and predictable structure, while higher entropy reflects greater randomness and uncertainty.
Applied to financial markets, lower entropy suggests that consecutive price movements are behaving in a more consistent and directional manner. Higher entropy, on the other hand, indicates that price action has become increasingly fragmented, with movements that are less structured and more difficult to interpret. Traders often recognize these conditions as noisy or directionless markets.
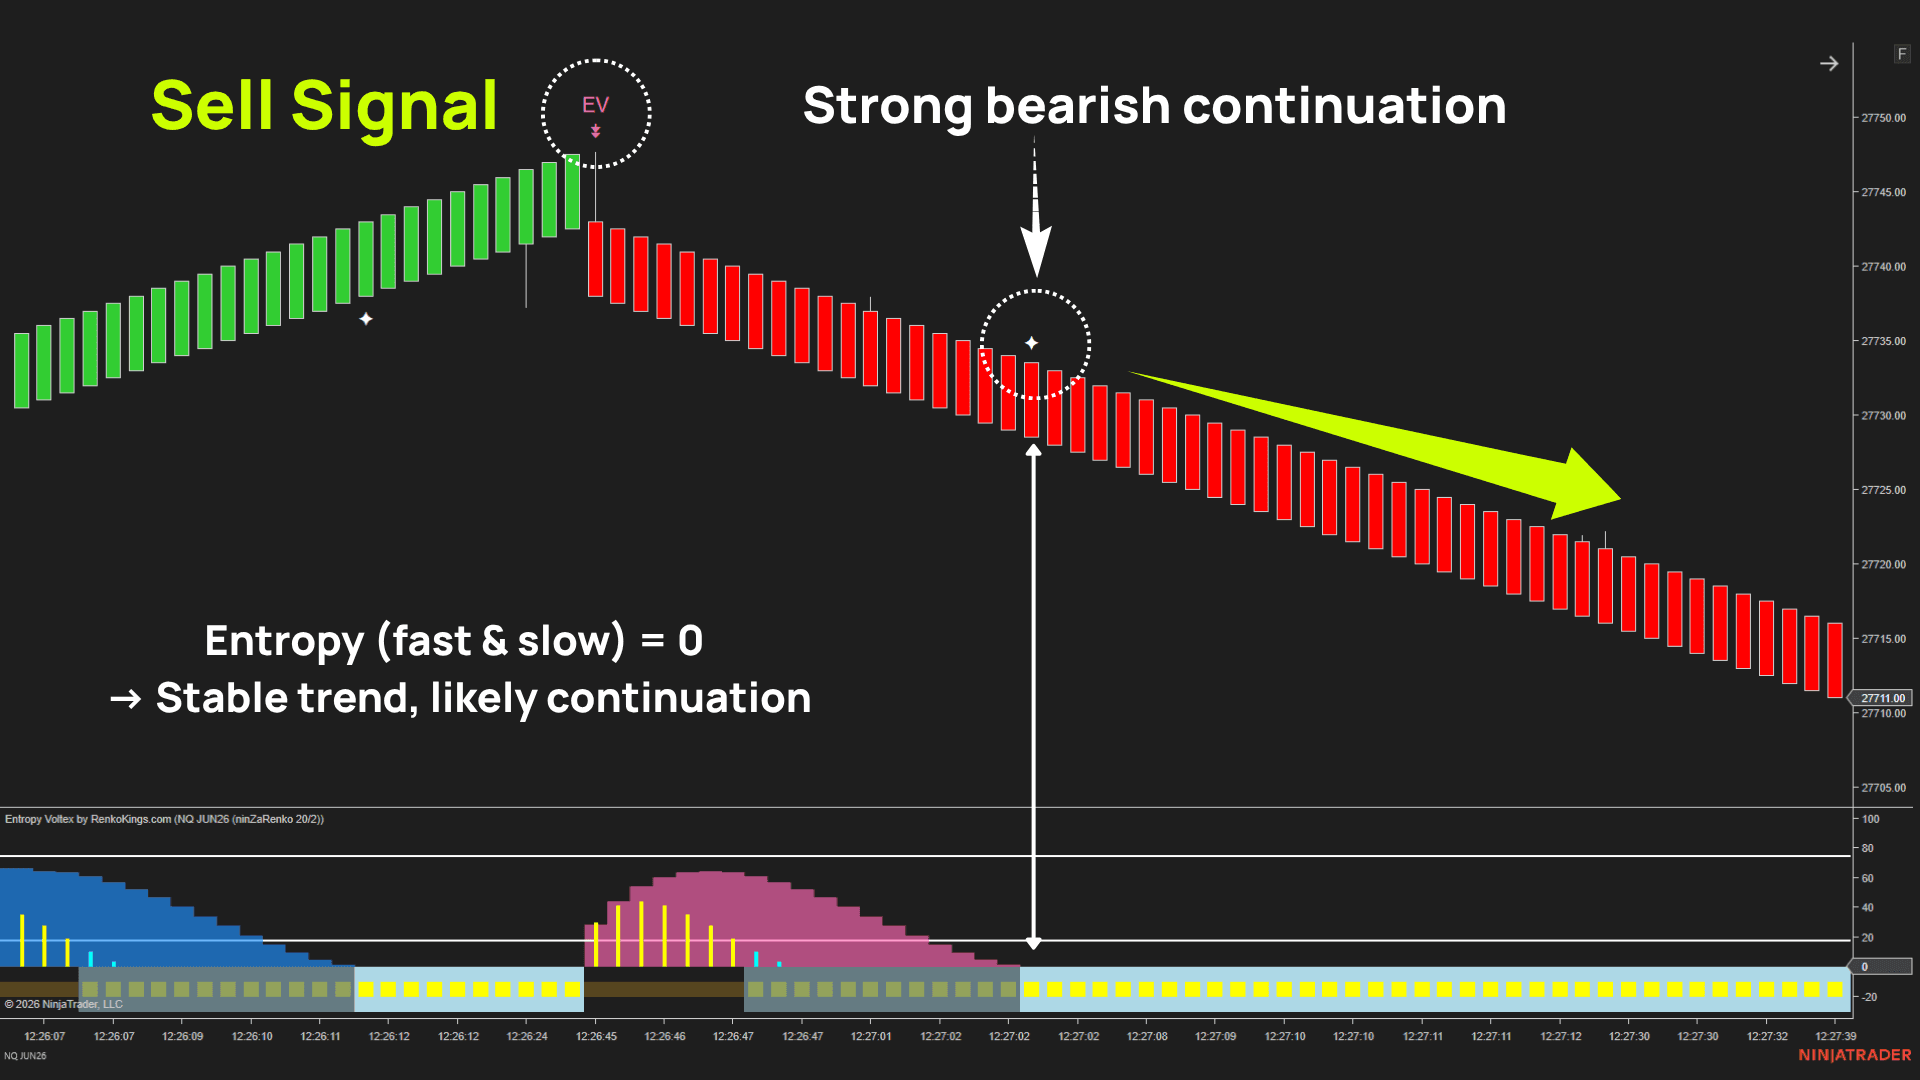
This raises an important question: "Why does market structure matter just as much as market direction?"
Because sustainable moves rarely emerge from randomness alone.
Before a meaningful breakout develops, the market often goes through a period of balance in which buyers and sellers repeatedly absorb each other's orders within a relatively narrow range. During this phase, price may appear active, yet direction remains uncertain and movement lacks consistency.
As one side gradually gains control, price behavior begins to organize. The market transitions from a state of uncertainty toward a more directional structure, creating conditions where follow-through becomes more likely.
Entropy Voltex is designed to identify this transition – from disorder to order – rather than simply detecting whether price is moving up or down.
This is why Entropy Voltex measures the quality of price movement, not its direction.
A large bullish candle occurring during a highly disordered market may be nothing more than a temporary liquidity sweep before reversing. By contrast, a more modest move that occurs as market structure becomes increasingly organized often provides a more reliable foundation for trend continuation, even if it appears less dramatic on the chart.
Conceptual foundation
The concept of entropy originates from Claude Shannon's Information Theory, where entropy describes the level of uncertainty within an information source. In the context of financial markets, entropy provides a useful framework for describing the degree of order or unpredictability in price behavior. Like any quantitative concept applied to trading, its practical value depends on how it is modeled, implemented, and validated against real market data.
4. Bollinger %B Pro: Why momentum deserves its own measurement
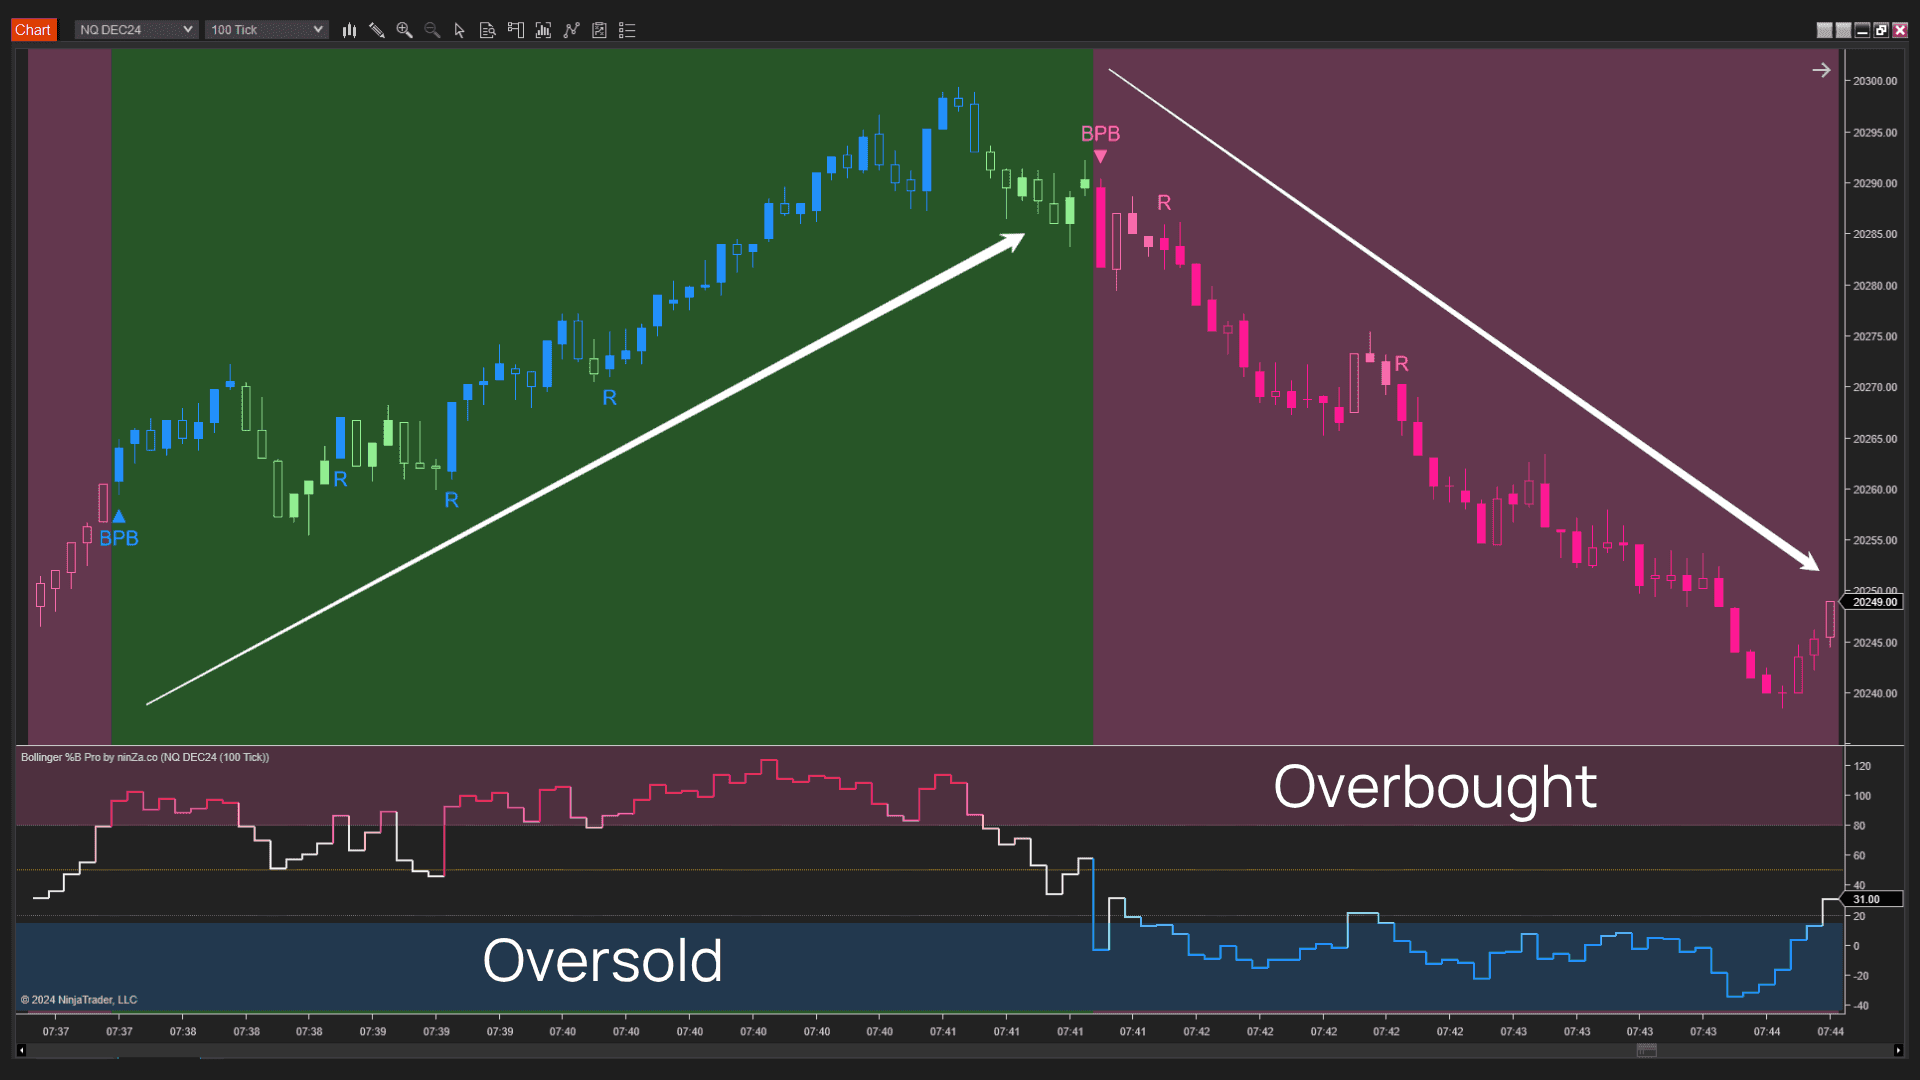
Bollinger %B measures the position of price relative to the Bollinger Bands.
A reading of 0 indicates price is at the lower band, while 1 indicates price is at the upper band. Values below 0 or above 1 suggest that price has moved beyond the bands – an indication that the move exceeds the market's recent normal volatility range.
So why is Bollinger %B still necessary if Entropy Voltex has already confirmed that market conditions are favorable?
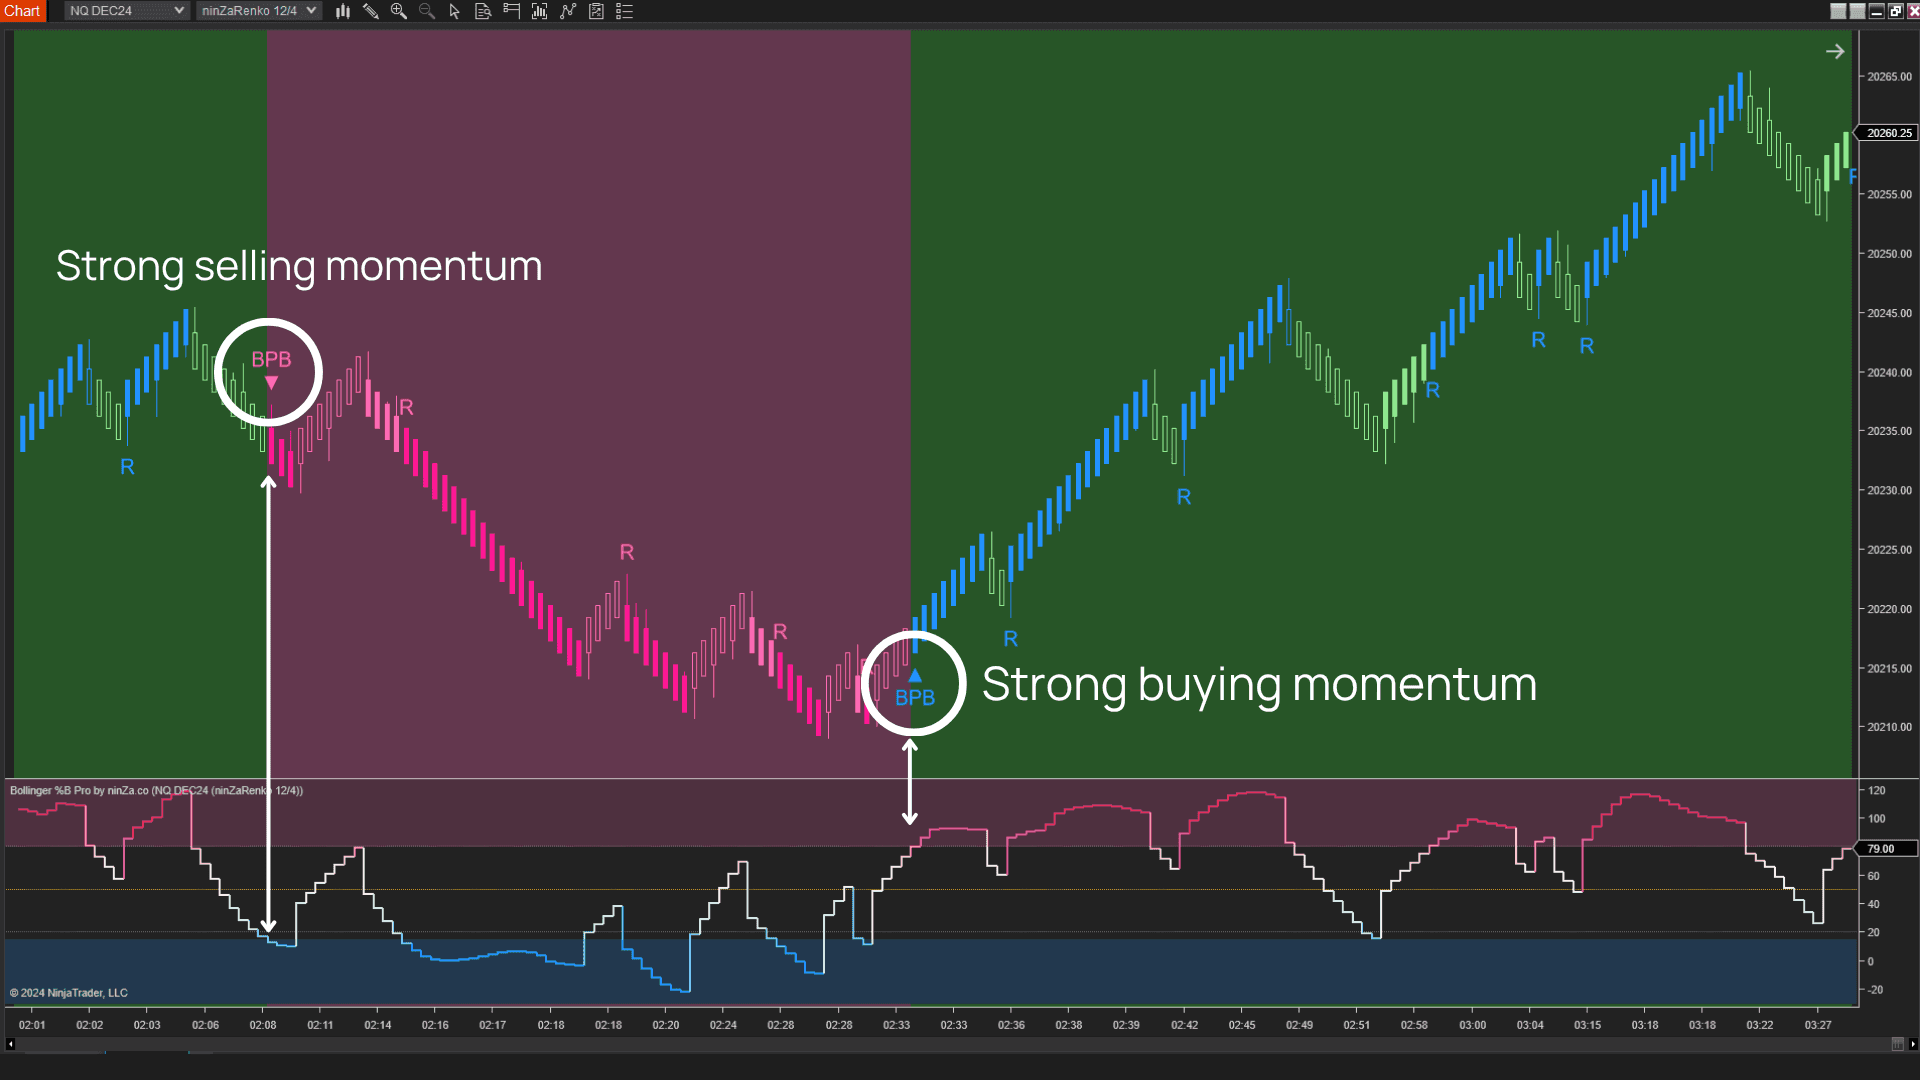
Because an orderly market isn't necessarily a strong one.
A market can transition from disorder to order while still producing only limited price expansion. The structure may be reliable, but the move may simply lack enough momentum to travel far enough before conditions begin to deteriorate again.
This is where Bollinger %B Pro plays a different role.
Rather than evaluating the quality of market structure, it evaluates whether the current move has enough momentum to justify a scalping trade.
In other words, it helps confirm that the move is not only reliable, but also capable of reaching realistic profit targets within the expected holding time.
The Pro version has also been refined to reduce false signals during narrow, low-volatility ranging markets.
The original %B can generate frequent upper- and lower-band readings even when overall price movement remains confined to a very small range. By requiring more meaningful price expansion before signaling, Bollinger %B Pro improves signal quality and reduces unnecessary entries.
Conceptual foundation
Bollinger Bands, developed by John Bollinger, are adaptive volatility bands based on standard deviation. The bands widen as volatility increases and contract as volatility decreases, making %B an effective way to measure the relative position of price within the current volatility environment.
Like any technical indicator, however, Bollinger %B should not be interpreted as a standalone buy or sell signal. Its value comes from being combined with other independent information – in this case, direction from Noble Cloud and movement quality from Entropy Voltex.
Key takeaway
These 3 indicators were not chosen simply because each performs well on its own. They were selected because each answers a different question that every high-quality trade should answer:
- Noble Cloud – Am I trading in the right direction?
- Entropy Voltex – Is the current price movement reliable?
- Bollinger %B Pro – Is there enough momentum for the move to continue?
Together, they provide three independent forms of confirmation: direction, movement quality, and momentum.
When one of these dimensions is missing, the trade is far more likely to suffer from one of the entry problems discussed earlier. More importantly, this framework gives you a practical way to diagnose why a trade failed – instead of simply concluding that "the market didn't behave as expected".
Continue reading →
Chapter 3: How to trade with Expansion Entry Scalping Solution
Download ~ 40 FREE indicators & reach more useful resources !!!
LIVE Intraday Trading | Stop chasing Early Entries. Let Timing guide your entry →

NINZA Indicators
0 online
_1787026707358.svg)
NINZA is an official member of NinjaTrader Ecosystem together with 600+ industry-leading professionals that provide traders with quality trading products & services.




even more payment methods
Quick Links
Instructions
Support
Resources & Information
© Copyright 2026 All Rights Reserved



Because software products may be copied and stored easily, we will NOT issue refunds of any kind. ALL SALES ARE FINAL & NON-REFUNDABLE!
Futures, foreign currency, and options trading contains substantial risk and is not for every investor. An investor could potentially lose all or more than the initial investment. Risk capital is money that can be lost without jeopardizing one's financial security or lifestyle. Only risk capital should be used for trading and only those with sufficient risk capital should consider trading. Past performance is not necessarily indicative of future results.
Hypothetical performance results have many inherent limitations, some of which are described below. No representation is being made that any account will or is likely to achieve profits or losses similar to those shown; in fact, there are frequently sharp differences between hypothetical performance results and the actual results subsequently achieved by any particular trading program. One of the limitations of hypothetical performance results is that they are generally prepared with the benefit of hindsight. In addition, hypothetical trading does not involve financial risk, and no hypothetical trading record can completely account for the impact of financial risk of actual trading. For example, the ability to withstand losses or to adhere to a particular trading program in spite of trading losses are material points which can also adversely affect actual trading results. There are numerous other factors related to the markets in general or to the implementation of any specific trading program which cannot be fully accounted for in the preparation of hypothetical performance results and all which can adversely affect trading results.
NinjaTrader® is a registered trademark of NinjaTrader Group, LLC. No NinjaTrader company has any affiliation with the owner, developer, or provider of the products or services described herein, or any interest, ownership or otherwise, in any such product or service, or endorses, recommends or approves any such product or service.